Prometheus教程
- 2022 年 8 月 30 日
- 筆記
- Prometheus
Prometheus介紹
主要特徵
- 使用時間序列數據(
tsdb)的多維度數據模型 - 靈活的查詢語言(
PromQL) - 不依賴分散式存儲,單個節點是自主的
- 通過
http請求拉取(pull)時間序列數據(tsdb) - 通過網關推送(
push)時間序列數據(tsdb) - 支援監控目標的動態服務發現和靜態配置
- 多樣化的影像介面展示,包括
grafana
架構圖及相關組件
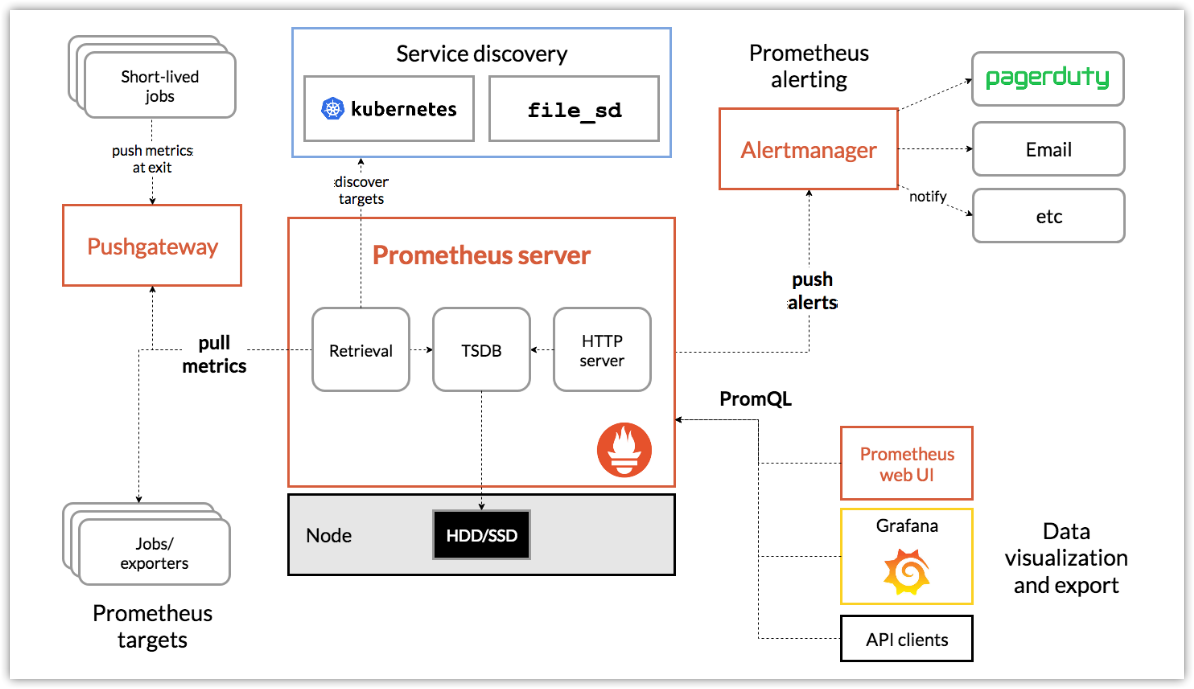
- 主服務Prometheus Server負責抓取和存儲時間序列數據
- 客戶庫負責檢測應用程式程式碼
- 支援短期任務的PUSH網關
- 多種數據出口(exporter)
- 告警器Alertmanager
- 命令行查詢工具PromQL
- 其他各種支撐工具
重要概念
數據模型
Prometheus將所有數據存儲為時間序列(time series),即一個屬於相同指標和相同標籤維度的帶時間戳的數據流。除了存儲時間序列數據外,也可以將臨時的時序數據作為查詢結果。
metric和label
每個時間序列(time series)由metric指標名和可選的label標籤(鍵值對)唯一確定。
metric反映了被監控樣本的含義(如:http_requests_total – 接收http請求的總數),metric指標名可以包含字母、數字、下劃線、冒號(需要符合正則:[a-zA-Z_:][a-zA-Z0-9_:]*)。
Label啟動了prometheus的多維數據模型。對於同一個metric,打上不同的label組合,就會形成特定維度的metric實例。查詢語言PromQL就可以基於這些維度進行過濾或聚合。Lable標籤名可以包含字母、數字、下劃線(需要符合正則:[a-zA-Z_][a-zA-Z0-9_]*)。以__作為前綴的標籤,是系統保留的關鍵字,只能在系統內部使用。
api_http_requests_total{method="POST", handler="/messages"}
等同於:
{__name__="api_http_requests_total",method="POST", handler="/messages"}
Samples取樣值
取樣值是一個具體的時間序列數據,有序的取樣值形成時間序列數據列表。
取樣值包含兩部分:
- 一個64位的浮點值
- 一個精確到毫秒級的時間戳
Notation標記
時間序列通常由metric和一組label進行標記。
格式:
<metric name>{<label name>=<label value>, ...}
例如,metrci名稱為api_http_requests_total,標籤為method=”POST”,handler=”/messages”,則該時序數據可以標記如下:
api_http_requests_total{method="POST", handler="/messages"}
指標類型
Counter(只增不減的計數器)
累計值
Gauge(可增可減的測量器)
當前值,暫時性
Histogram(柱狀圖)
Summary (匯總)
任務和實例
- job
- instance
Getting Started
安裝
tar -zxvf prometheus-2.33.1.linux-amd64.tar.gz -C /root/	# 上傳安裝包後解壓至root目錄
mv prometheus-2.33.1.linux-amd64 prometheus
cd prometheus/
配置
配置文件為prometheus.yml
global:
  scrape_interval:     15s
  evaluation_interval: 15s

rule_files:
  # - "first.rules"
  # - "second.rules"

scrape_configs:
  - job_name: prometheus
    static_configs:
      - targets: ['localhost:9090']
global:全局配置
scrape_interval:抓取目標的時間間隔,默認1分鐘
evaluation_interval:計算規則的時間檢查,默認1分鐘。Promethues使用該規則創建新的時序數據和告警。
rule_files:提供給PS載入的規則文件的位置
scrape_configs:配置PS的監控目標。由於PS也會暴露自身的運行數據,所以PS也可以抓取和監控自身健康狀態。
job_name:job名
static_configs:靜態配置
targets:監控目標,'localhost:9090'表示從本地9090埠抓取數據,抓取url默認為//localhost:9090/metrics。同時PS自身也通過該url暴露數據。
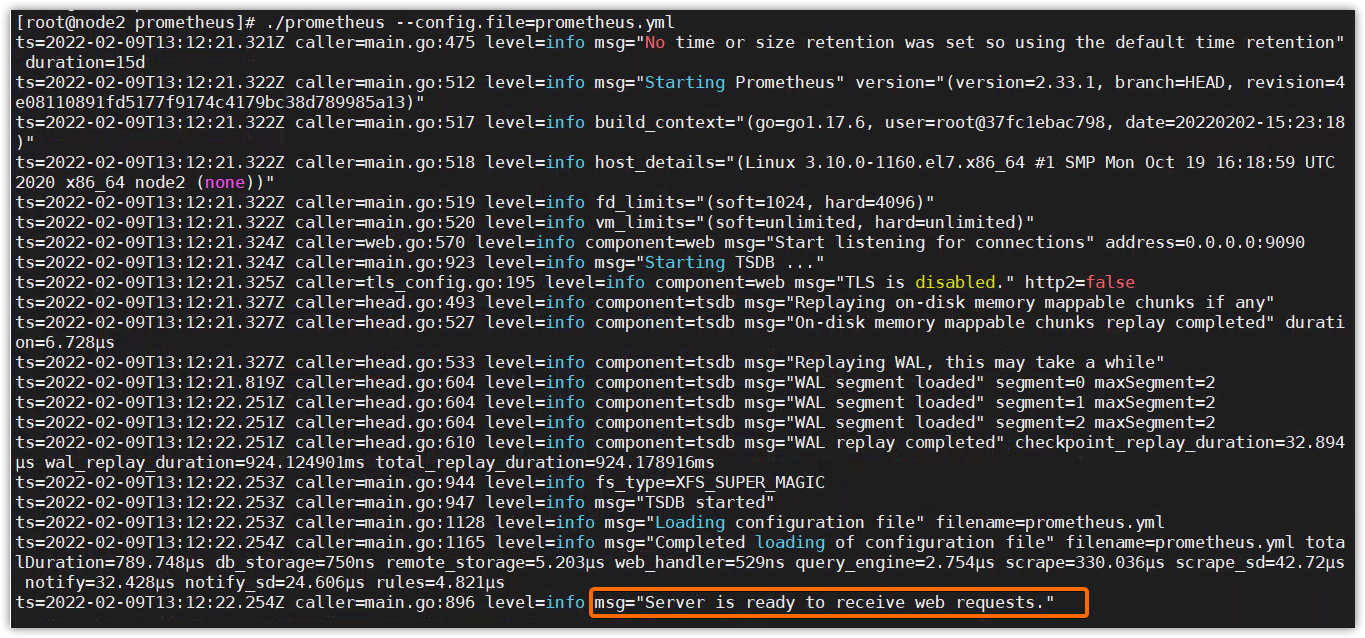
啟動
$ ./prometheus --config.file=prometheus.yml
# 或
$ nohup ./prometheus --config.file=prometheus.yml --web.enable-lifecycle &		# 後台運行,動態重載配置
訪問
訪問Prometheus://localhost:9090或//localhost:9090/graph
訪問自身metrics介面://localhost:9090/metrics
UI數據查詢
使用PromQL查詢數據,示例如下:
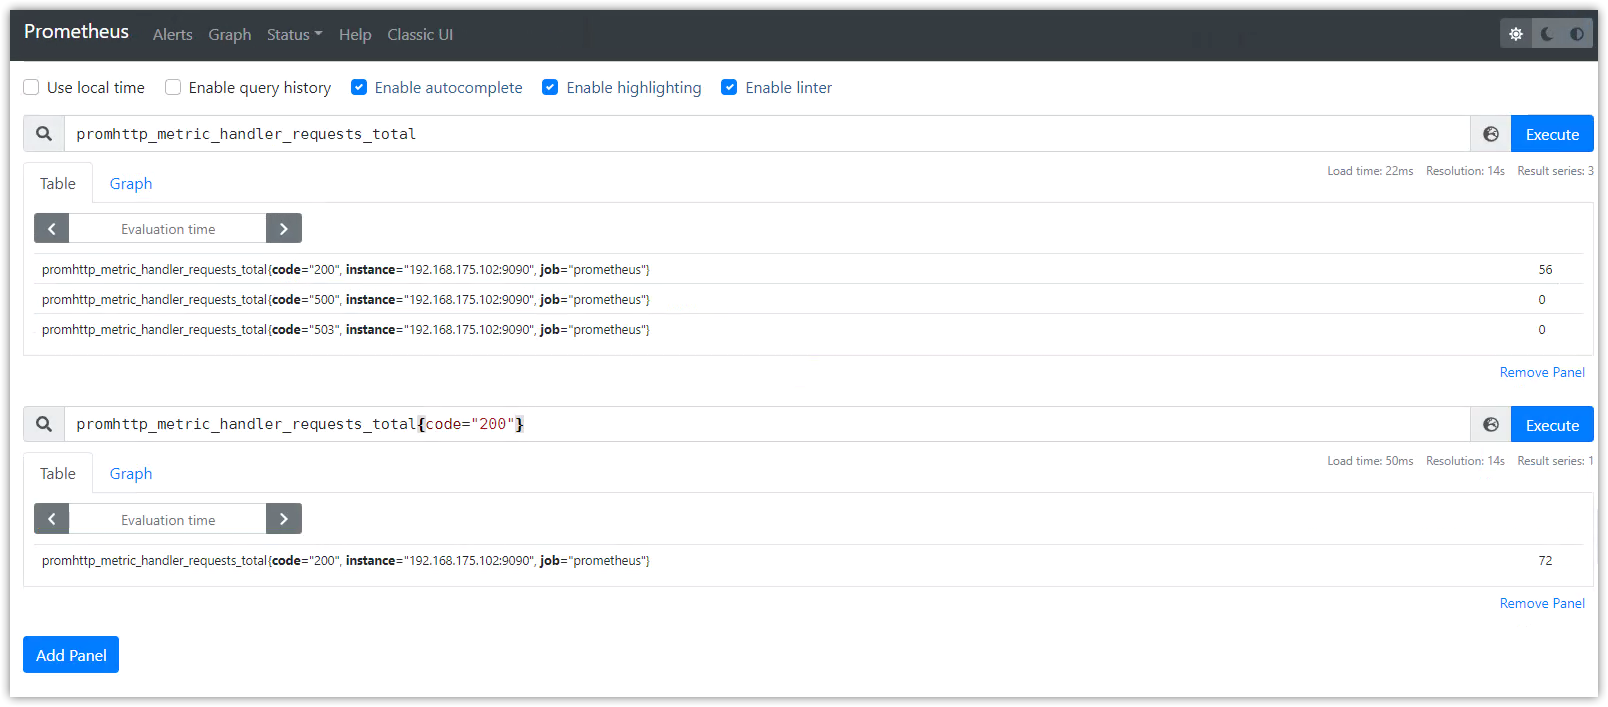
數據列表顯示
promhttp_metric_handler_requests_total:PS的/metrics介面請求總數
promhttp_metric_handler_requests_total{code="200"}:返回http200的請求數
prometheus_target_interval_length_seconds:兩次數據抓取的實際時間間隔
count(prometheus_target_interval_length_seconds):返回的時序數量
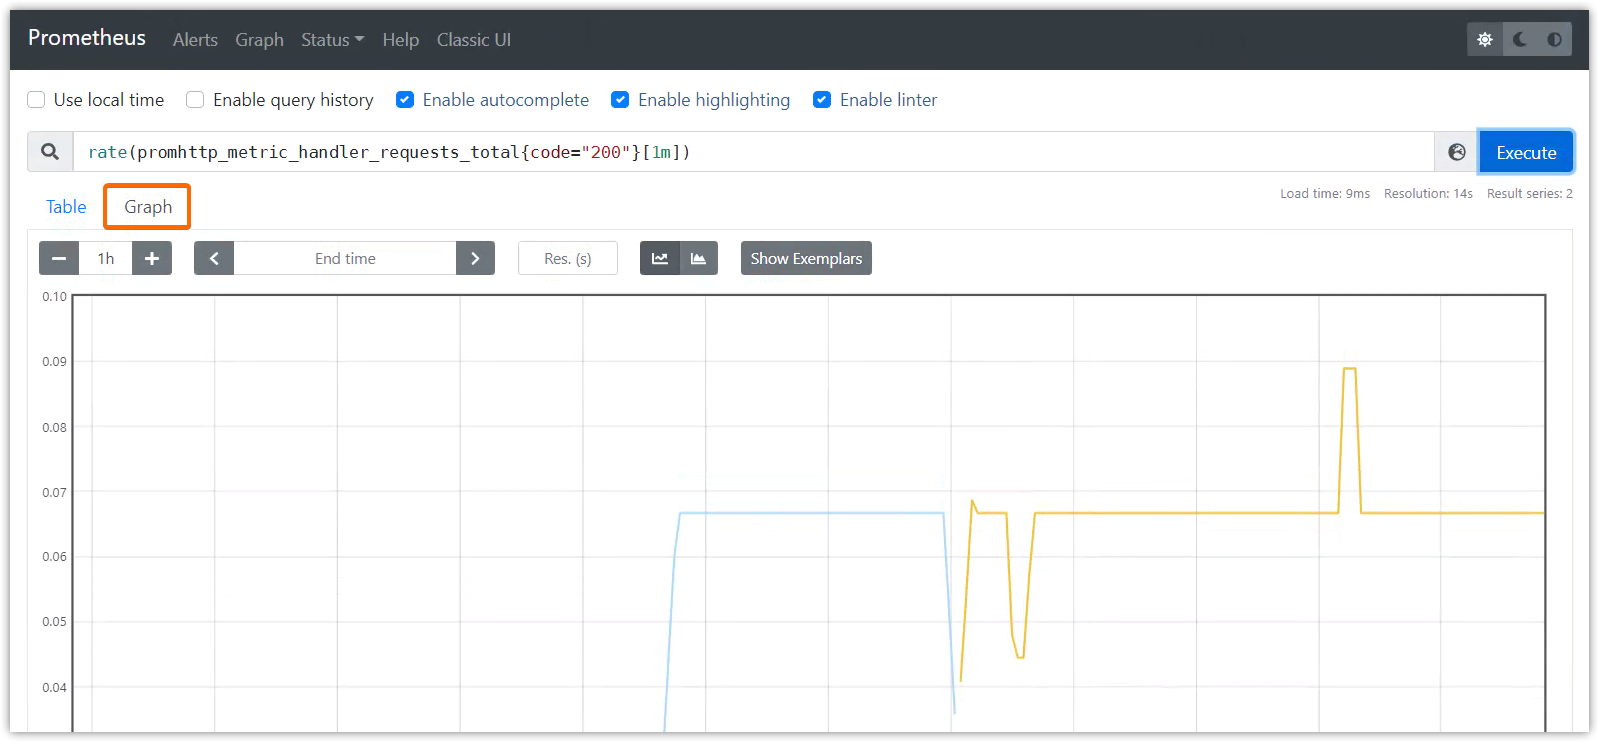
圖形展示
rate(promhttp_metric_handler_requests_total{code="200"}[1m])
監控其它目標
安裝並啟動node_exporter
# 安裝
tar -xzvf node_exporter-1.3.1.linux-amd64.tar.gz
mv node_exporter-1.3.1.linux-amd64/ node_exporter
cd node_exporter
# 啟動
nohup ./node_exporter --web.listen-address 192.168.175.102:8080 &
nohup ./node_exporter --web.listen-address 192.168.175.102:8081 &
nohup ./node_exporter --web.listen-address 192.168.175.102:8082 &
這時可以使用//192.168.175.102:8080/metrics、//192.168.175.102:8081/metrics、//192.168.175.102:8082/metrics訪問node_exporter的監控數據了。
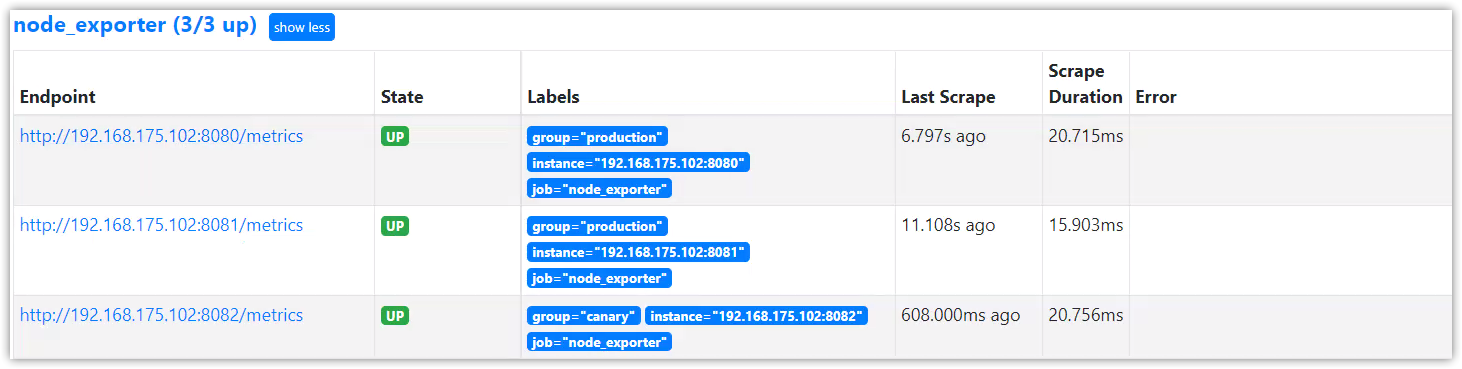
配置Prometheus監控目標node_exporter
在prometheus.yml文件中的scrape_configs配置域下添加以下的配置(注意格式):
- job_name: "node_exporter"
    static_configs:
      - targets: ['192.168.175.102:8080', '192.168.175.102:8081']
        labels:
          group: 'production'
      - targets: ['192.168.175.102:8082']
        labels:
          group: 'canary'
重啟 Prometheus 後,打開UI介面,便可以查詢node_exporter的相關指標數據,如node_cpu_seconds_total

安裝
linux安裝
tar -zxvf prometheus-2.33.1.linux-amd64.tar.gz -C /root/	# 上傳安裝包後解壓至root目錄
mv prometheus-2.33.1.linux-amd64 prometheus
cd prometheus/
目錄結構:
$ tree $PWD
/root/prometheus
├── console_libraries
│   ├── menu.lib
│   └── prom.lib
├── consoles
│   ├── index.html.example
│   ├── node-cpu.html
│   ├── node-disk.html
│   ├── node.html
│   ├── node-overview.html
│   ├── prometheus.html
│   └── prometheus-overview.html
├── LICENSE
├── NOTICE
├── prometheus
├── prometheus.yml
└── promtool

2 directories, 14 files
docker安裝
$ docker run -td -p 9090:9090 --name prometheus1 prom/prometheus
Dockerfile構建
Prometheus之Dockerfile編寫、鏡像構建、容器啟動 – wuenwuen – 部落格園 (cnblogs.com)
基礎配置(⭐)
Prometheus 通過命令行參數和配置文件進行配置,命令行主要用來配置不可變的系統參數(比如存儲位置、保存在磁碟或記憶體的數據量),配置文件主要用來定義 jobs 和 instance 的抓取規則,以及規則文件。
./prometheus -h 查看所有的命令行選項。
Prometheus可以在運行時重載配置,可以通過發送SIGHUP訊號給PS進程,或者發送POST請求給/-/reload端點(前提是啟用了--web.enable-lifecycle選項)。
./prometheus --config.file=prometheus.yml --web.enable-lifecycle
curl -X POST //192.168.175.102:9090/-/reload
如果新配置格式錯誤,則該配置不生效。
--config.file選項指定載入的yaml格式配置文件。
配置語法如下,[]方括弧表示該配置是可選的,[ - ... ]方括弧中有端橫線表示該配置是列表。對於非列表參數,其值被設置為默認值。
佔位符:
<boolean>: a boolean that can take the valuestrueorfalse<duration>: a duration matching the regular expression((([0-9]+)y)?(([0-9]+)w)?(([0-9]+)d)?(([0-9]+)h)?(([0-9]+)m)?(([0-9]+)s)?(([0-9]+)ms)?|0), e.g.1d,1h30m,5m,10s<filename>: a valid path in the current working directory<host>: a valid string consisting of a hostname or IP followed by an optional port number<int>: an integer value<labelname>: a string matching the regular expression[a-zA-Z_][a-zA-Z0-9_]*<labelvalue>: a string of unicode characters<path>: a valid URL path<scheme>: a string that can take the valueshttporhttps<secret>: a regular string that is a secret, such as a password<string>: a regular string<size>: a size in bytes, e.g.512MB. A unit is required. Supported units: B, KB, MB, GB, TB, PB, EB.<tmpl_string>: a string which is template-expanded before usage
配置文件格式
global部分是全局配置,全局有效,也是其它配置部分的默認值。
global:
  [ scrape_interval: <duration> | default = 1m ]

  [ scrape_timeout: <duration> | default = 10s ]

  [ evaluation_interval: <duration> | default = 1m ]

  external_labels:
    [ <labelname>: <labelvalue> ... ]

  [ query_log_file: <string> ]

rule_files:
  [ - <filepath_glob> ... ]				# 規則文件路徑列表,這些規則文件中定義了預計算規則和告警規則

scrape_configs:							# 監控目標,及數據抓取配置
  [ - <scrape_config> ... ]

alerting:
  alert_relabel_configs:
    [ - <relabel_config> ... ]
  alertmanagers:
    [ - <alertmanager_config> ... ]

remote_write:
  [ - <remote_write> ... ]

remote_read:
  [ - <remote_read> ... ]

storage:
  [ - <exemplars> ... ]
一個完整的配置示例:參考//github.com/prometheus/prometheus/blob/release-2.33/config/testdata/conf.good.yml
scrape_config配置區域
scrape_config配置指定了一系列的監控目標targets和描述如何抓取該目標數據的相關參數。一般情況下,一個數據抓取配置僅指定一個job任務。當然高級的配置中可能不一樣。
監控目標targets可以通過static_configs進行靜態配置,也可以通過file_sd_configs服務發現機制來動態發現。
relabel_configs配置允許在抓取目標數據之前,對target和他的labels進行修改。
job_name參數值必須是唯一的。
下面是scrape_config常用的配置,更多資訊請參考官網。
job_name: <job_name>

[ scrape_interval: <duration> | default = <global_config.scrape_interval> ]

[ scrape_timeout: <duration> | default = <global_config.scrape_timeout> ]

[ metrics_path: <path> | default = /metrics ]

[ scheme: <scheme> | default = http ]

file_sd_configs:						# 服務發現配置的文件列表,服務發現指的是發現抓取的目標
  [ - <file_sd_config> ... ]

static_configs:							# 打標籤的靜態配置的監控目標列表
  [ - <static_config> ... ]

relabel_configs:						# targer標籤重構配置列表
  [ - <relabel_config> ... ]

metric_relabel_configs:					# metric標籤重構列表
  [ - <relabel_config> ... ]

http_sd_configs:						# 服務發現配置的http列表
  [ - <http_sd_config> ... ]
上面的參數在scrape_config區域如何配置,請參考上面的示例文件。
static_configs配置域
ststic_config配置允許指定一個targets列表和一個label標籤集,它是在數據抓取配置中指定靜態目標的規範方法。
# The targets specified by the static config.
targets:
  [ - '<host>' ]

# Labels assigned to all metrics scraped from the targets.
labels:
  [ <labelname>: <labelvalue> ... ]
relabel_configs配置域
relabeling標籤重構可用來重寫目標抓取之前的label標籤集。
重構之前,除了配置的指定標籤之外,目標自帶的job標籤,其值為job_name的配置值,__address__標籤被設置為目標地址<host>:<port>。
重構之後,新標籤instance被默認設置為__address__的值,除非特別配置。
__scheme__和__metrics_path__標籤被設置為目標的協議和metrics路徑;__scrape_interval__標籤和__scrape_timeout__標籤被分別設置為配置的scrape_interval和scrape_timeout相同的值
此外,以__meta__為前綴的標籤也可以重構,它們由服務發現機制進行配置。
重構完成之後,__前綴的標籤將從標籤集中移除。
如果重構步驟需要暫時存儲標籤值(作為後續重構步驟的輸入),可以使用__tmp前綴的標籤名。該前綴不會被prometheus自身使用。
[ source_labels: '[' <labelname> [, ...] ']' ]		# 配置為現有標籤的列表

[ separator: <string> | default = ; ]				# 多個label值之間連接的分隔符

[ target_label: <labelname> ]						# 目標標籤

[ regex: <regex> | default = (.*) ]					# 從源標籤中使用該正則進行匹配或提取值

[ modulus: <int> ]

[ replacement: <string> | default = $1 ]			# 若上面的regex正則表達式匹配了,則將此處的配置值替換掉目標標籤的值;
													# 可使用正則捕獲組,默認為$1,即使用第一個捕獲組進行替換

[ action: <relabel_action> | default = replace ]	# 基於正則匹配執行的動作,默認為替換。(這個值尤其重要,它決定了上述各配置的具體行為)
separator: <string>指定分隔符,用於將source_labels配置的多個標籤值連接成新值;比如分隔符為;,標籤值分別為aaa和bbb,則使用分隔符連接後組成的新值為”aaa;bbb”
regex: <regex>是有效的正則表達式,需要它來對source_labels組合後的標籤值進行匹配,並提供給replacement進行replace, keep, drop, labelmap,labeldrop,labelkeep動作。使用.*<regex>.*來取消正則。
action: <relabel_action>決定標籤重構的動作:
replace:替換。regex對多個標籤值組合後的字元串進行匹配,然後將目標target_label的值替換為replacement的值。如果regex不匹配,則不替換。keep:當regex正則表達式不匹配組合後的標籤值時,丟棄整個監控目標。匹配時,保持原始標籤資訊不變。drop:當regex正則表達式匹配組合後的標籤值時,丟棄整個監控目標。不匹配時,保持原始標籤資訊不變。hashmod:將target_label設置為source_labels的散列模數labelmap: 使用regex去匹配所有的標籤名,然後使用匹配上的標籤名的值來替換replacement標籤名的值(如果replacement標籤名沒有,則新增)。labeldrop:使用regex去匹配所有的標籤名,然後從標籤集中刪除所有匹配的標籤。該值只能和regex參數結合使用,不能配置其它參數。labelkeep:使用regex匹配所有的標籤名,然後從標籤集中刪除所有不匹配的標籤。該值只能和regex參數結合使用,不能配置其它參數。
replacement: <string>預備替換target_label值的字元串,可以使用正則捕獲組進行反向引用。
這裡有些複雜,結合相關示例進行說明。
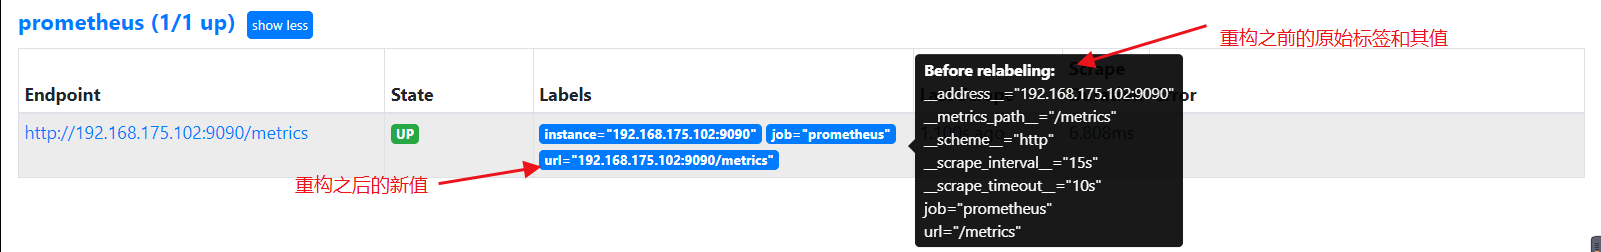
第一個示例,根據多個標籤的值,重構出目標標籤的新值,配置如下:
scrape_configs:
	- job_name: "prometheus"
	  static_configs:
      	- targets: ["192.168.175.102:9090"]
          labels:
            url: '/metrics'									# 構建一個標籤為url,值為/metrics
      relabel_configs:
      - source_labels: [__address__, __metrics_path__]
        target_label: url
        regex: (.*);(.*)
        replacement: $1$2
        action: replace
配置解讀:
source_labels: [__address__, __metrics_path__]
# __address__標籤的值為192.168.175.102:9090,__metrics_path__標籤的值為/metrics,兩個標籤的值使用分隔符(;號,由separator指定)組成新值,新值為字元串"192.168.175.102:9090;/metrics"

regex: (.*);(.*)
# regex與該新值做匹配,第一個捕獲組為"192.168.175.102:9090",第二個捕獲組為"/metrics"

action: replace
#  action的動作為replace,將目標標籤url的值替換為replacement的指定值

replacement: $1$2
# replacement使用正則的反向引用,使用捕獲組1和捕獲組2,$1$2則表示字元串"192.168.175.102:9090/metrics"

target_label: url
# 該url標籤的值使用replacement的值進行替換,url標籤的新值為"192.168.175.102:9090/metrics"
重載prometheus的配置:
curl -X POST 192.168.175.102:9090/-/reload
在UI中查看url標籤值,果然替換成了新值:
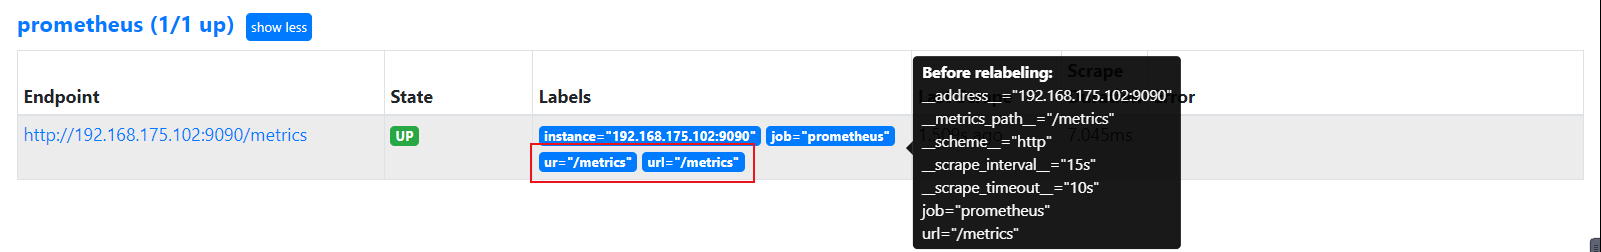
第二個示例,使用labelmap重構出一個新標籤,配置如下:
scrape_configs:
	- job_name: "prometheus"
	  static_configs:
      	- targets: ["192.168.175.102:9090"]
          labels:
            url: '/metrics'									# 構建一個標籤為url,值為/metrics
      relabel_configs:
      - regex: (ur)l
        replacement: $1
        action: labelmap
配置解讀:
# 標籤名有__address__、__metrics_path__、__scheme__、__、__scrape_interval__、__scrape_timeout__、job、url等

regex: (ur)l
# 正則表達式(ur)l將與上述標籤名進行匹配,匹配結果為url,捕獲組為ur;

replacement: $1
# replacement的值使用regex的第一個捕獲組,也即"ur"字元串

action: labelmap
# 使用regex匹配標籤url的值替換掉replacement指定的標籤ur的值。由於沒有ur標籤,所有會創建一個ur新標籤,其值為url的"/metrics"
重載prometheus的配置:
curl -X POST 192.168.175.102:9090/-/reload
在UI中查看新標籤和其值:
file_sd_configs配置域
基於文件的服務發現提供了一些通用的辦法去配置靜態目標和自定義的服務發現介面。
它讀取一系列包含了多個<static_config>配置的文件,同時通過磁碟監控來探測文件配置的變化。該文件可以寫成yaml或json格式,格式錯誤的配置組不生效。
該文件必須包含一系列靜態配置,使用以下格式:
YAML yaml - targets: [ - '<host>' ] labels: [ <labelname>: <labelvalue> ... ]
JSON json [ { "targets": [ "<host>", ... ], "labels": { "<labelname>": "<labelvalue>", ... } }, ... ]
文件內容將以指定的刷新時間被重新讀取,文件後綴必須為json、yaml或yml。
格式:
files:
  [ - <filename_pattern> ... ]				# 讀取的文件列表,後綴必須為json/yaml/yml,最後一個文件路徑可以使用通配符*,比如my/path/tg_*.json

[ refresh_interval: <duration> | default = 5m ]			# 重新載入的時間周期
示例:
- job_name: "node_exporter"
  static_configs:
    - targets: ['192.168.175.102:8080', '192.168.175.102:8081']
      labels:
        group: 'production'
    - targets: ['192.168.175.102:8082']
      labels:
        group: 'canary'
改造如下:
- job_name: "node_exporter"
  file_sd_configs:
    - files:
        - /root/prometheus/static_config/node_exporter.yml
      refresh_interval: 5m
/root/prometheus/static_config/node_exporter.yml配置如下:
- targets: ['192.168.175.102:8080', '192.168.175.102:8081']
  labels:
    group: 'production'
- targets: ['192.168.175.102:8082']
  labels:
    group: 'canary'
重載prometheus配置:
curl -X POST 192.168.175.102:9090/-/reload
rule_files配置區域
Prometheus支援預計算規則和告警規則,需要將這兩類規則寫入單獨的規則文件中,然後在rule_files配置中引入。
rule_files的配置格式:
rule_files:
  [ - <filepath_glob> ... ]				# 規則文件路徑列表,這些規則文件中定義了預計算規則和告警規則
promtool命令行工具可以用來執行規則文件的語法檢查:
promtool check rules /path/to/example.rules.yml # 語法正確退出碼為0,錯誤退出碼為1
通過預計算規則,可以預先計算經常使用的或運算昂貴的PromQL表達式,並將這些表達式的結果保存為一組新時間序列。查詢這些預計算結果通常比直接執行原始表達式快得多。對於每次刷新時都要重複查詢相同表達式的儀錶板來說很有幫助。
通過告警規則,可以基於PromQL表達式定義告警條件,Prometheus後端對這些告警規則進行周期性計算,當滿足觸發條件後則會觸發告警通知。當告警表達式在給定時間點產生一個或者多個向量元素,這個告警就會統計這些活躍的元素標籤集。
預計算規則和告警規則配置方式
預計算規則和告警規則都配置在規則文件的同一個規則組group中,一個組內的rules規則以指定的時間間隔按順序運行。
規則文件的groups配置語法:
groups:
  [ - <rule_group> ]
<rule_group>配置
rule_group中配置一個規則組,在該規則組內的rules下配置預計算規則或告警規則
name: <string>						# 規則組的名稱

[ interval: <duration> | default = global.evaluation_interval ]			# 組內規則的計算周期

[ limit: <int> | default = 0 ]		# 限制告警規則的告警數量、或限制預計算規則產生的時序數量

rules:
  [ - <rule> ... ]
示例:
groups:
- name: example
  rules:
  	[ - <rule> ... ]
<rule>配置
<rule>要麼定義預計算規則要麼定義告警規則,若同時定義了告警規則和預定義規則,則以列表的方式存放在rules下組成一個規則組。
預計算規則的定義語法
record: <string>						# 輸出的metrics時序名稱

expr: <string>							# 預計算的PromQL表達式。

labels:									# 存儲結果之前添加或重寫的標籤
  [ <labelname>: <labelvalue> ]
示例:
groups:
  - name: example
    rules:
    - record: job:http_inprogress_requests:sum
      expr: sum by (job) (http_inprogress_requests)
告警規則的定義語法
alert: <string>							# 告警名稱

expr: <string>							# 告警的PromQL表達式

[ for: <duration> | default = 0s ]		# 告警的等待時間,只有當expr達到條件並持續一段時間,才會發送告警。等待期間告警狀態為pending

labels:									# 為告警添加或重寫的標籤
  [ <labelname>: <tmpl_string> ]

annotations:							# 告警描述; 指定一組附加資訊,比如用於描述告警詳細資訊的文字等,這些內容在告警產生時會一同作為參數發送到Alertmanager
  [ <labelname>: <tmpl_string> ]
示例:
groups:
- name: example
  rules:
  - alert: HighRequestLatency
    expr: job:request_latency_seconds:mean5m{job="myjob"} > 0.5
    for: 10m
    labels:
      severity: page
    annotations:
      summary: High request latency
告警描述模板化
一般來說,在告警規則文件的annotations中使用summary描述告警的概要資訊,description用於描述告警的詳細資訊。同時Alertmanager的UI也會根據這兩個標籤值,顯示告警資訊。
通過模板化label和annotation中的值,可以提高告警資訊的可讀性。
模板定義格式如下:
# To insert a firing element's label values:
{{ $labels.<labelname> }}
# To insert the numeric expression value of the firing element:
{{ $value }}
$labels變數保存告警標籤的鍵值對;
$value變數保存當前PromQL表達式計算的樣本值;
通過$labels.<labelname>可以訪問當前告警實例中指定標籤的值。
示例:
groups:
- name: example
  rules:

  # Alert for any instance that is unreachable for >5 minutes.
  - alert: InstanceDown
    expr: up == 0
    for: 5m
    labels:
      severity: page
    annotations:
      summary: "Instance {{ $labels.instance }} down"
      description: "{{ $labels.instance }} of job {{ $labels.job }} has been down for more than 5 minutes."

  # Alert for any instance that has a median request latency >1s.
  - alert: APIHighRequestLatency
    expr: api_http_request_latencies_second{quantile="0.5"} > 1
    for: 10m
    annotations:
      summary: "High request latency on {{ $labels.instance }}"
      description: "{{ $labels.instance }} has a median request latency above 1s (current value: {{ $value }}s)"
查看
可以通過UI介面的Alerts菜單查看當前發送(firing)或掛起(pending)的告警資訊,以及所有的告警規則。
可以通過UI介面的Rules菜單查看所有規則組(包含預計算規則和告警規則)。
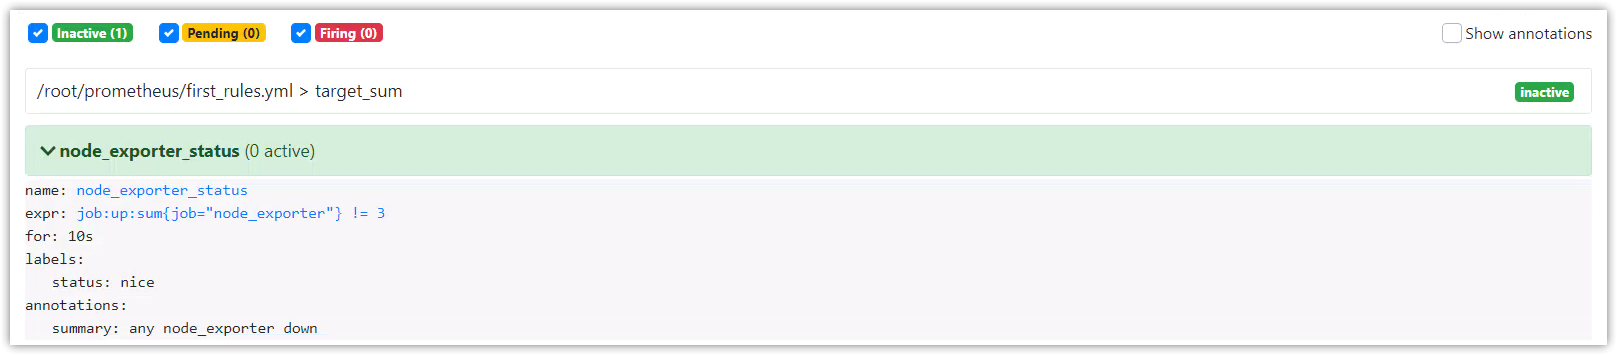
實例演示
prometheus.yml文件配置
rule_files:
   - /root/prometheus/first_rules.yml
first_rules.yml文件配置
groups:
  - name: target_sum
    rules:
    - record: job:up:sum
      expr: sum(up)by(job)
    - alert: node_exporter_status
      expr: job:up:sum{job="node_exporter"} != 3
      for: 3s
      labels:
        status: nice
      annotations:
        summary: any node_exporter down
重新載入:
$ curl -X POST //192.168.175.102:9090/-/reload
在Rules介面查看

在Alerts介面查看
停止一個node_exporter進程,觀察告警資訊
告警表達式的值為2,等待3秒後將觸發告警

告警活動狀態

Prometheus查詢(⭐)
PromQL(Prometheus Query Language)可以對時序進行選擇和聚合。
PromQL基礎
表達式語言數據類型
在PromQL中,任何表達式或者子表達式都可以歸為四種類型:
Instant vector:瞬時向量,具有相同時間戳的時序集合。Range vector:範圍向量,跨時間範圍的時序集合。Scalar:標量,簡單的浮點數。String:字元串,當前未使用。
根據使用場景(例如:圖表 或 表格)不同,在PromeQL中可使用的數據類型也不同。例如:瞬時向量類型是唯一可以直接在圖表中使用的。
Literals
字元串類型
字元串可以用單引號、雙引號或者反引號表示,PromQL遵循與Go相同的轉義規則。

標量:浮點數類型
scalar標量浮點數能可以被寫成整數或浮點數的格式
[-+]?(
      [0-9]*\.?[0-9]+([eE][-+]?[0-9]+)?
    | 0[xX][0-9a-fA-F]+
    | [nN][aA][nN]
    | [iI][nN][fF]
)
例如:
23
-2.43
3.4e-9
0x8f
-Inf
NaN
時序選擇器(Time series Selectors)
瞬時向量選擇器
瞬時向量選擇器可以選擇出時序集合,其中每個時序都具有一個當下時間戳的樣本值。
最簡單的格式為,只有配置一個指標名。這個瞬時向量的查詢結果將包含所有的時序元素。
prometheus_http_requests_total
標籤選擇器及其操作符
在指標名後面使用{}和標籤選擇器可以對這些時序數據做進一步的過濾:
prometheus_http_requests_total{code="200"}
標籤選擇器的操作符可以使用下面這個:
=: 精確地匹配標籤給定的值!=: 不等於給定的標籤值=~: 選擇匹配正則表達的標籤!~: 選擇不匹配正則表達式的標籤
prometheus_http_requests_total{code!~"200|500"}
如果將標籤值設為空,那麼標籤選擇器將篩選出所有沒有設置標籤的指標數據。否則查詢為空。
向量選擇器,必須指定一個指標名稱,或者一個無法匹配空串標籤的選擇器,如下
{job=~".*"} # 錯誤,因為.*正則可以匹配到空字元串
下面是正確的方式,因為無法匹配到空標籤值
{job=~".+"}              # Good!
{job=~".*",method="get"} # Good!
除了使用<metric name>{label=value}的形式以外,我們還可以使用內置的__name__標籤來指定監控指標名稱:
{__name__=~"http_request_total"} # 合法
{__name__=~"node_disk_bytes_read|node_disk_bytes_written"} # 合法
表達式http_requests_total等價於{__name__="http_requests_total"}。
其他的匹配器,如:= ( !=, =~, !~)都可以使用。下面的表達式選擇了度量指標名稱以job:開頭的時間序列數據:
指標名稱不能使用關鍵字 bool, on, ignoring, group_left 和 group_right。
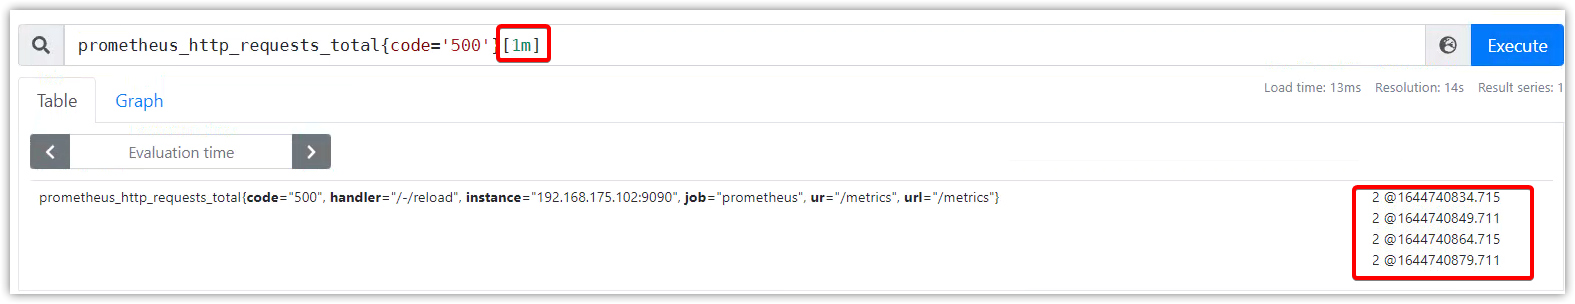
範圍向量選擇器
在[]中添加一個時間,就構成一個範圍向量選擇器。它會選擇出最近這段時間內的樣本值及其時間戳。
prometheus_http_requests_total{code='500'}[1m]
這將從起始時間(當前)查詢到1m前。
時間單位
ms– millisecondss– secondsm– minutesh– hoursd– days – assuming a day has always 24hw– weeks – assuming a week has always 7dy– years – assuming a year has always 365d
時間單位可以結合使用:
5h
1h30m
5m
10s
時間偏移:offset修飾符
offset修飾符,可以修改查詢起始時間。不使用,則默認為當前時間。
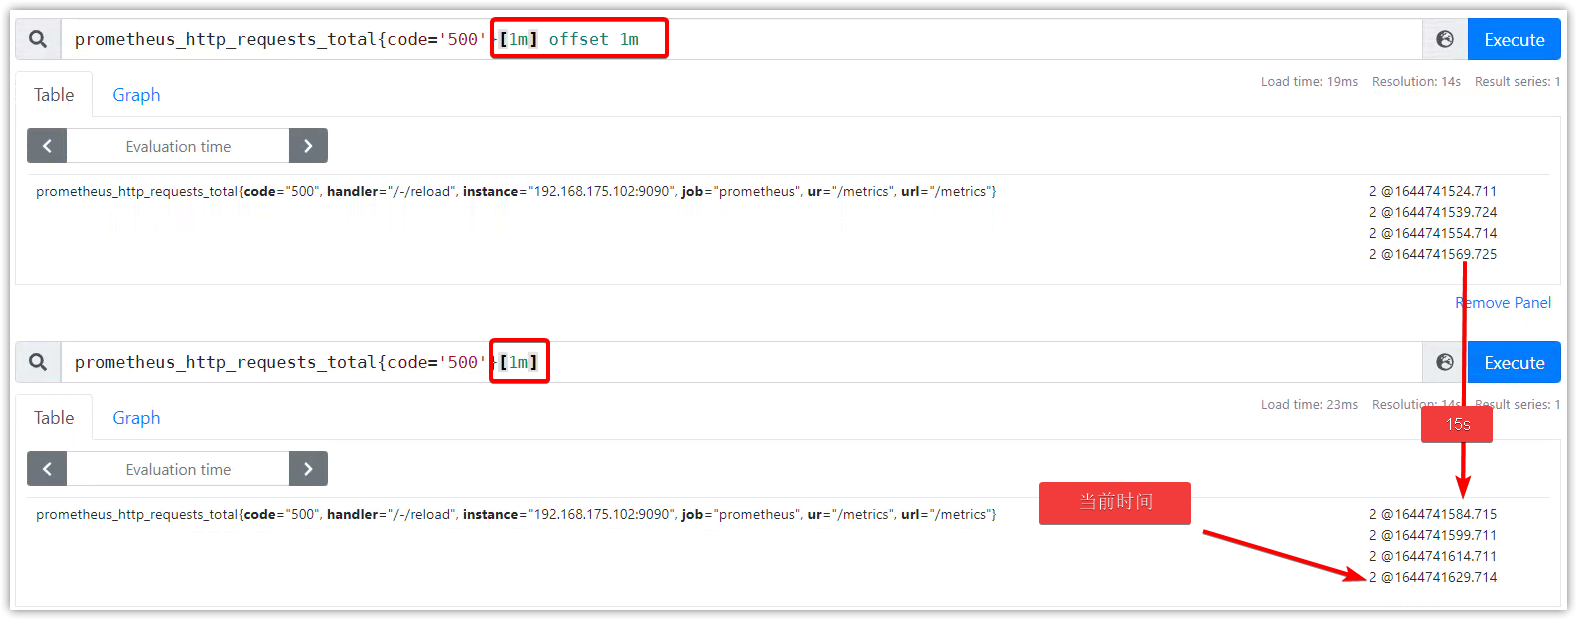
可以和時間範圍一起使用,也可以在瞬時向量上直接使用。
使用示例:
http_requests_total offset 5m
sum(http_requests_total{method="GET"} offset 5m) // GOOD.
sum(http_requests_total{method="GET"}) offset 5m // INVALID.	# 必須直接跟在選擇器後
rate(http_requests_total[5m] offset 1w)
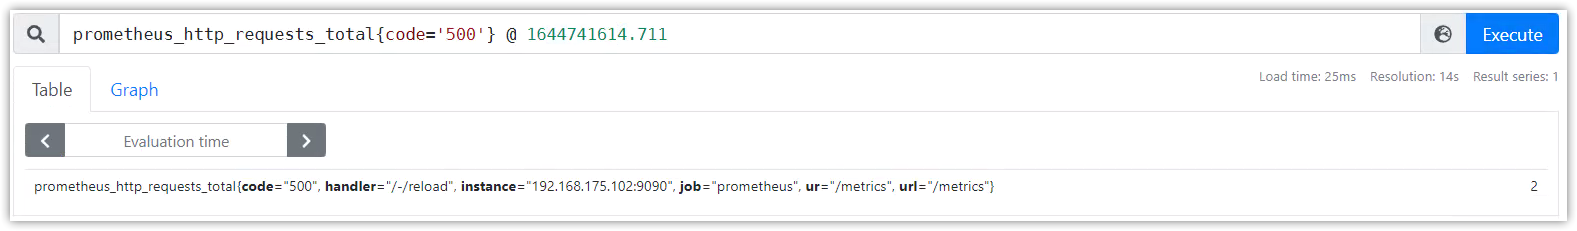
指定時間戳:@修飾符
@修飾符,可以指定查詢時間。時間戳為unix。
示例:
http_requests_total @ 1609746000
sum(http_requests_total{method="GET"} @ 1609746000) // GOOD.
sum(http_requests_total{method="GET"}) @ 1609746000 // INVALID.	# 必須直接跟在選擇器後
rate(http_requests_total[5m] @ 1609746000)
和offset修飾符結合使用,寫在前或後查詢結果一樣:
# offset after @
http_requests_total @ 1609746000 offset 5m
# offset before @
http_requests_total offset 5m @ 1609746000
另類的:
http_requests_total @ start()
rate(http_requests_total[5m] @ end())
注釋
PromQL使用#接注釋
prometheus_http_requests_total{code='200'} # test
查詢中的坑
-
插值和陳舊
-
避免慢查詢和高負載
操作符
PromQL支援基本的邏輯運算和算術運算。
二元操作符
算術操作符
+加法-減法*乘法/除法%模^冪等
二元算術運算符支援scalar/scalar(標量/標量)、vector/scalar(向量/標量)、和vector/vector(向量/向量)之間的操作。
在兩個標量之間進行運算,結果也是標量。
在向量和標量直接進行運算,操作符將作用在每個向量值上,最後得到一個新的向量。
在兩個向量之間進行運算,左邊的每個向量值將與右邊匹配的向量值進行運算,最後得到一個沒有指標名稱的新向量。
比較操作符
==等於!=不等於>大於<小於>=大於等於<=小於等於
比較二元操作符被應用於scalar/scalar(標量/標量)、vector/scalar(向量/標量),和vector/vector(向量/向量)。
比較操作符得到的結果是bool布爾類型值,返回1或者0。
-
兩個標量之間的比較運算,bool結果寫入到另一個結果標量中。
-
瞬時向量和標量之間的比較運算,操作符會應用到向量的每個值上。如果一個向量值與這個標量比較結果是
false,則這個向量元素被丟棄掉,如果是true, 則這個向量元素被保留在結果中。 -
兩個瞬時向量之間的比較運算,左邊每個向量值將與右邊向量值進行匹配,沒有匹配上的,或者計算結果為false的,都被丟棄,不在結果中顯示。否則將保留左邊的向量元素和向量值,並寫入到新的瞬時向量中。
邏輯/集合操作符
邏輯/集合二元操作符只能作用在瞬時向量
and交集or並集unless補集
vector1 and vector2 的邏輯/集合二元操作符,規則:vector1瞬時向量中的每個樣本數據與vector2向量中的所有樣本數據進行標籤匹配,不匹配的,全部丟棄。運算結果是保留左邊的度量指標名稱和值。
vector1 or vector2的邏輯/集合二元操作符,規則: 保留vector1向量中的每一個元素,對於vector2向量元素,則不匹配vector1向量的任何元素,則追加到結果元素中。
vector1 unless vector2的邏輯/集合二元操作符,又稱差積。規則:包含在vector1中的元素,但是該元素不在vector2向量所有元素列表中,則寫入到結果集中。
向量匹配
向量匹配,指的是右邊向量中的每一個元素,在左邊向量中也存在。匹配行為分為一對一和一對多。
一對一向量匹配
一對一,找到這個操作符的兩邊向量元素的相同元素。
默認情況下,操作符的格式是vector1 [operate] vector2。如果它們有相同的標籤和值,則表示相匹配。
ingoring關鍵字是指,向量匹配時,可以忽略指定標籤。
on關鍵字是指,在指定標籤上進行匹配。
匹配格式如下:
<vector expr> <bin-op> ignoring(<label list>) <vector expr>
<vector expr> <bin-op> on(<label list>) <vector expr>
示例:
PromQL1:prometheus_http_requests_total{code='200'}

PromQL2:prometheus_http_request_duration_seconds_count{}
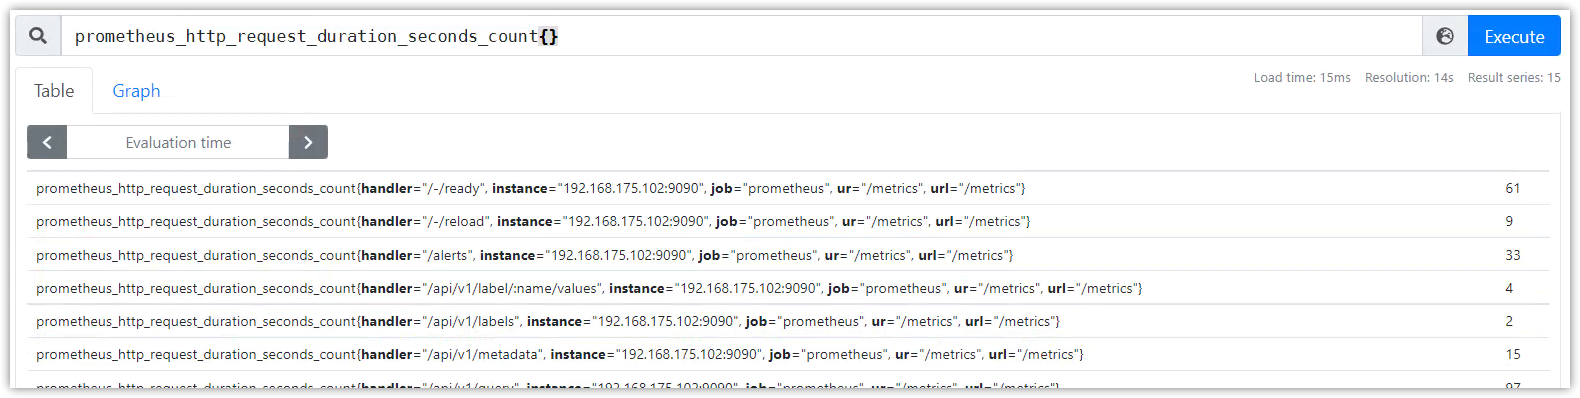
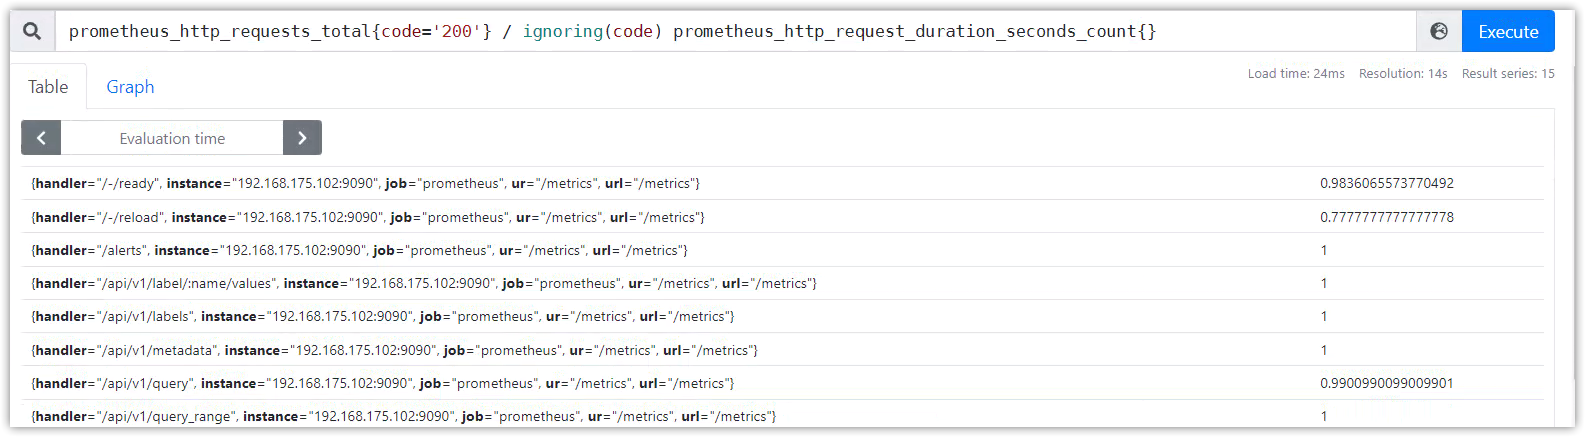
使用邏輯操作符計算:prometheus_http_requests_total{code='200'} >= ignoring(code) prometheus_http_request_duration_seconds_count{}

使用算術操作符計算:prometheus_http_requests_total{code='200'} >= ignoring(code) prometheus_http_request_duration_seconds_count{}
得到沒有指標名稱的新向量。
多對一和一對多匹配
多對一和一對多的匹配,是指向量元素中的一個樣本數據匹配標籤到了多個樣本數據標籤。
這裡必須直接指定兩個修飾符group_left或者group_right, 左或者右決定了哪邊的向量具有較高的子集。
匹配格式如下:
<vector expr> <bin-op> ignoring(<label list>) group_left(<label list>) <vector expr>
<vector expr> <bin-op> ignoring(<label list>) group_right(<label list>) <vector expr>
<vector expr> <bin-op> on(<label list>) group_left(<label list>) <vector expr>
<vector expr> <bin-op> on(<label list>) group_right(<label list>) <vector expr>
聚合操作符,及without和by
聚合操作符被用於聚合單個瞬時向量的所有時間序列列表,把聚合的結果值存入到新的向量中。可以通過without或者by子句來保留不同的標籤。
sum(在維度上求和)max(在維度上求最大值)min(在維度上求最小值)avg(在維度上求平均值)stddev(求標準差)stdvar(求方差)count(統計向量元素的個數)count_values(統計相同數據值的元素數量)bottomk(樣本值第k個最小值)topk(樣本值第k個最大值)quantile(統計分位數)
格式:
\<aggr-op\>([parameter,] \<vector expr\>) [without | by (\<label list\>)] [keep_common]
parameter只能用於count_values, quantile, topk和bottomk。
示例:
如果度量指標名稱http_requests_total包含由group, application, instance的標籤組成的時間序列數據,我們可以通過以下方式計算去除instance標籤的http請求總數:
sum(http_requests_total) without (instance)
如果我們對所有應用程式的http請求總數,我們可以簡單地寫下:
sum(http_requests_total)
統計每個編譯版本的二進位文件數量,我們可以如下寫:
count_values("version", build_version)
通過所有實例,獲取http請求第5個最大值,我們可以簡單地寫下:
topk(5, http_requests_total)
二元運算符優先順序
從高到低:
^*,/,%+,-==,!=,<=,<,>=,>and,unlessor
優先順序相同的運算符是左關聯。 例如,2 * ( 3 % 2)等效於(2 * 3) % 2。 但^是右關聯,所以2 ^ 3 ^ 2等效於2 ^ (3 ^ 2)。
函數
//fuckcloudnative.io/prometheus/3-prometheus/functions.html#increase
列舉一些常用的函數及示例:
changes()
返回區間向量中,時序值改變的次數
increase(v range-vector)
獲取區間向量中的第一個和最後一個樣本並返回其增長量,只能用於計算counter類型數據。
increase(prometheus_http_requests_total{handler="/metrics"}[5m])
irate(v range-vector)
獲取區間向量的瞬時增長率。通過區間向量中最後兩個兩本數據來計算區間向量的增長速率;
這種方式可以避免在時間窗口範圍內的「長尾問題」,並且體現出更好的靈敏度,通過irate函數繪製的圖標能夠更好的反應樣本數據的瞬時變化狀態。
irate(prometheus_http_requests_total{handler="/metrics"}[5m])
注意
當將
irate()函數與聚合運算符(例如sum())或隨時間聚合的函數(任何以_over_time結尾的函數)一起使用時,必須先執行 irate 函數,然後再進行聚合操作,否則當取樣目標重新啟動時 irate() 無法檢測到計數器是否被重置。
rate(v range-vector)
直接計算區間向量 v 在時間窗口內平均增長速率,只能用於計算counter類型數據,在長期趨勢分析或者告警中推薦使用這個函數。
rate(prometheus_http_requests_total{handler="/metrics"}[5m])
注意
當將
rate()函數與聚合運算符(例如sum())或隨時間聚合的函數(任何以_over_time結尾的函數)一起使用時,必須先執行 rate 函數,然後再進行聚合操作,否則當取樣目標重新啟動時 rate() 無法檢測到計數器是否被重置。
<aggregation>_over_time()
下面的函數列表允許傳入一個區間向量,它們會聚合每個時間序列的範圍,並返回一個瞬時向量。
avg_over_time(range-vector): 區間向量內每個度量指標的平均值min_over_time(range-vector): 區間向量內每個度量指標的最小值max_over_time(range-vector): 區間向量內每個度量指標的最大值sum_over_time(range-vector): 區間向量內每個度量指標的求和count_over_time(range-vector): 區間向量內每個度量指標的樣本數據個數quantile_over_time(scalar, range-vector): 區間向量內每個度量指標的樣本數據值分位數,φ-quantile (0 ≤ φ ≤ 1)stddev_over_time(range-vector): 區間向量內每個度量指標的總體標準差。stdvar_over_time(range-vector): 區間向量內每個度量指標的總體標準方差。last_over_time(range-vector): 區間向量內最近一個指標數據present_over_time(range-vector): 區間向量內第一個指標數據
label_join()
將瞬時向量中的原有標籤使用連接符組合成為新標籤。
格式:
label_join(v instant-vector, dst_label string, separator string, src_label_1 string, src_label_2 string, ...)
示例:
up{}
=>
up{group="canary", instance="192.168.175.102:8082", job="node_exporter"}
...
####
label_join(up{},'foo',';','job','instance')
=>
up{foo="node_exporter;192.168.175.102:8082", group="canary", instance="192.168.175.102:8082", job="node_exporter"}
...
# 組合成新標籤,鏈接符為';'
label_replace()
根據regex正則,將原有標籤的匹配部分寫入到新標籤中
格式:
label_replace(v instant-vector, dst_label string, replacement string, src_label string, regex string)
示例:
label_replace(up{}, "hosts", "$1", "instance", "(.*):.*")
=>
up{group="canary", hosts="192.168.175.102", instance="192.168.175.102:8082", job="node_exporter"}
sort(v instant-vector)
sort_desc(v instant-vector)
time()
timestamp(v instant-vector)
參考
官網://prometheus.io/docs/prometheus/latest/querying/functions/
查詢示例
HTTP API
數據格式:json
向量表達式查詢
即時查詢 – 瞬時向量
Restful API:
GET /api/v1/query
POST /api/v1/query
URL參數:
query=<string>: PromQL字元串time=<rfc3339 | uninx_timestamp>: 執行時間戳,可選項。默認使用伺服器時間timeout=<duration>: 執行超時時間設置,可選項。默認由-query.timeout標誌設置
可以使用GET請求訪問API數據介面,帶特殊符號的話,則需要對URL進行編碼,或者使用POST方式並且帶上頭部資訊Content-Type: application/x-www-form-urlencoded,見下方示例。
查詢結果的數據格式:
{
  "resultType": "matrix" | "vector" | "scalar" | "string",
  "result": <value>
}
發送Get請求:
# curl '//192.168.175.102:9090/api/v1/query?query=sum(up)&time=1644757519'
{
  "status": "success",
  "data": {
    "resultType": "vector",
    "result": [
      {
        "metric": {
          "__name__": "up",
          "group": "canary",
          "instance": "192.168.175.102:8082",
          "job": "node_exporter"
        },
        "value": [
          1644757519,
          "1"
        ]
      },
      ...
    ]
  }
}
一些特殊字元需要url編碼的情況,GET請求會報錯,需要使用POST請求,並帶上頭部資訊Content-Type: application/x-www-form-urlencoded:
$ curl '//192.168.175.102:9090/api/v1/query?query=up{job="prometheus"}'                                          {"status":"error","errorType":"bad_data","error":"invalid parameter \"query\": 1:6: parse error: unexpected \"=\""}
$
$ curl -H 'Content-Type:application/x-www-form-urlencoded' -d 'query=up{job="prometheus"}' //192.168.175.102:9090/api/v1/query
{
  "status": "success",
  "data": {
    "resultType": "vector",
    "result": [
      {
        "metric": {
          "__name__": "up",
          "instance": "192.168.175.102:9090",
          "job": "prometheus",
          "ur": "/metrics",
          "url": "/metrics"
        },
        "value": [
          1644757017.26,
          "1"
        ]
      }
    ]
  }
}
範圍查詢 – 範圍向量
Restful API:
GET /api/v1/query_range
POST /api/v1/query_range
URL參數:
query=<string>: PromQL字元串。start=<rfc3339 | unix_timestamp>: 開始時間戳,包含。end=<rfc3339 | unix_timestamp>: 結束時間戳,包含。step=<duration>: 查詢時間步長,範圍時間內每step秒執行一次。timeout=<duration>: 執行超時時間設置,可選項。默認由-query.timeout標誌設置
查詢方式:和即時查詢一樣多,可以使用GET請求,帶特殊符號需要使用POST方式並且帶上頭部資訊Content-Type: application/x-www-form-urlencoded。
查詢結果的數據格式:
{
  "resultType": "matrix",
  "result": <value>
}
示例:
$ curl -H "Content-Type:application/x-www-form-urlencoded" \
-d 'query=up{job="prometheus"}' \
-d 'start=1644837500' \
-d 'end=1644837800' \
-d 'step=5m' \
//192.168.175.102:9090/api/v1/query_range
{
  "status": "success",
  "data": {
    "resultType": "matrix",
    "result": [
      {
        "metric": {
          "__name__": "up",
          "instance": "192.168.175.102:9090",
          "job": "prometheus",
          "ur": "/metrics",
          "url": "/metrics"
        },
        "values": [
          [
            1644837500,
            "1"
          ],
          [
            1644837800,
            "1"
          ]
        ]
      }
    ]
  }
}
查詢結果的數據格式
瞬時查詢結果格式:
{
  "resultType": "matrix" | "vector" | "scalar" | "string",
  "result": <value>
}
<value>格式:
[
  {
    "metric": { "<label_name>": "<label_value>", ... },
    "value": [ <unix_time>, "<sample_value>" ]
  },
  ...
]
範圍查詢結果格式:
{
  "resultType": "matrix",
  "result": <value>
}
<value>格式:
[
  {
    "metric": { "<label_name>": "<label_value>", ... },
    "values": [ [ <unix_time>, "<sample_value>" ], ... ]
  },
  ...
]
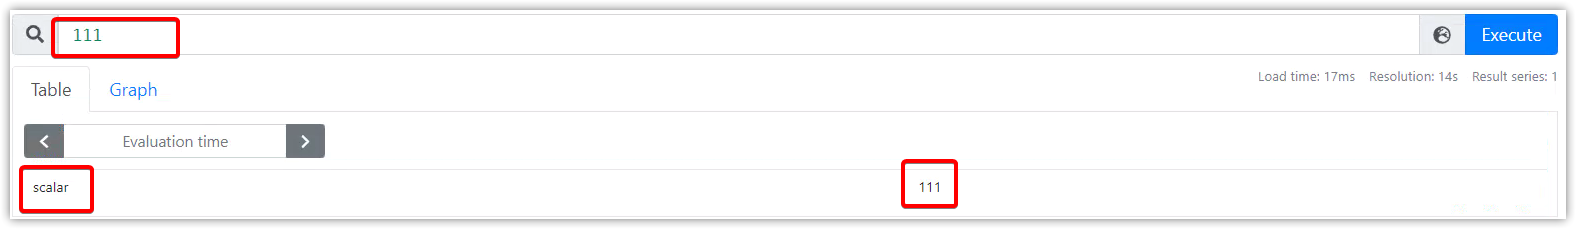
標量的<value>格式:
[ <unix_time>, "<scalar_value>" ]
例如:
{"status":"success","data":{"resultType":"scalar","result":[1644840866.871,"111"]}}
字元串的<value>格式:
[ <unix_time>, "<string_value>" ]
例如:
{"status":"success","data":{"resultType":"string","result":[1644840912.231,"aaa"]}}
元數據查詢
元數據即時序和其標籤(如果歷史數據沒有清理了,則也包含歷史時序和標籤)
查詢時序數據
Restful API:
GET /api/v1/series
POST /api/v1/series
URL參數:
match[]=<series_selector>: 選擇器是時序選擇器,可寫多個(&連接),最少提供一個參數。start=<rfc3339 | unix_timestamp>: 開始時間戳。end=<rfc3339 | unix_timestamp>: 結束時間戳。
查詢方式:可以使用GET請求,帶特殊符號需要使用POST方式並且帶上頭部資訊Content-Type: application/x-www-form-urlencoded。
查詢結果的數據格式:
{
   "status" : "success",
   "data" : [
      {
         "__name__" : "up",
         "job" : "prometheus",
         "instance" : "localhost:9090"
      },
      ...
   ]
}
示例:
$ curl -g '//localhost:9090/api/v1/series?' --data-urlencode 'match[]=up' --data-urlencode 'match[]=process_start_time_seconds{job="prometheus"}'
{
   "status" : "success",
   "data" : [
      {
         "__name__" : "up",
         "job" : "prometheus",
         "instance" : "localhost:9090"
      },
      {
         "__name__" : "up",
         "job" : "node",
         "instance" : "localhost:9091"
      },
      {
         "__name__" : "process_start_time_seconds",
         "job" : "prometheus",
         "instance" : "localhost:9090"
      }
   ]
}
查詢標籤名
Restful API:
GET /api/v1/labels
POST /api/v1/labels
URL參數:
match[]=<series_selector>: 時序選擇器,可寫多個(&連接),可選項。start=<rfc3339 | unix_timestamp>: 開始時間戳。end=<rfc3339 | unix_timestamp>: 結束時間戳。
查詢及數據格式:
$ curl 'localhost:9090/api/v1/labels'
{
    "status": "success",
    "data": [
        "__name__",
        "call",
        "code",
        "config",
        "dialer_name",
        "endpoint",
        "event",
        "goversion",
        "handler",
        "instance",
        "interval",
        "job",
        "le",
        "listener_name",
        "name",
        "quantile",
        "reason",
        "role",
        "scrape_job",
        "slice",
        "version"
    ]
}
查詢標籤值
Restful API:
GET /api/v1/label/<label_name>/values
URL參數:
match[]=<series_selector>: 時序選擇器,可寫多個(&連接),可選項。start=<rfc3339 | unix_timestamp>: 開始時間戳。end=<rfc3339 | unix_timestamp>: 結束時間戳。
查詢示例:
$ curl //localhost:9090/api/v1/label/job/values
{
   "status" : "success",
   "data" : [
      "node",
      "prometheus"
   ]
}
查詢targets
API:
GET /api/v1/targets					# 返回activeTargets和dropedTargets
GET /api/v1/targets?state=active	# state=active, state=dropped, state=any
URL參數:
state:state=active, state=dropped, state=any
默認會返回活躍的和丟棄的targets。加上state參數可以對activeTargets和dropedTargets進行過濾(state=active, state=dropped, state=any)。
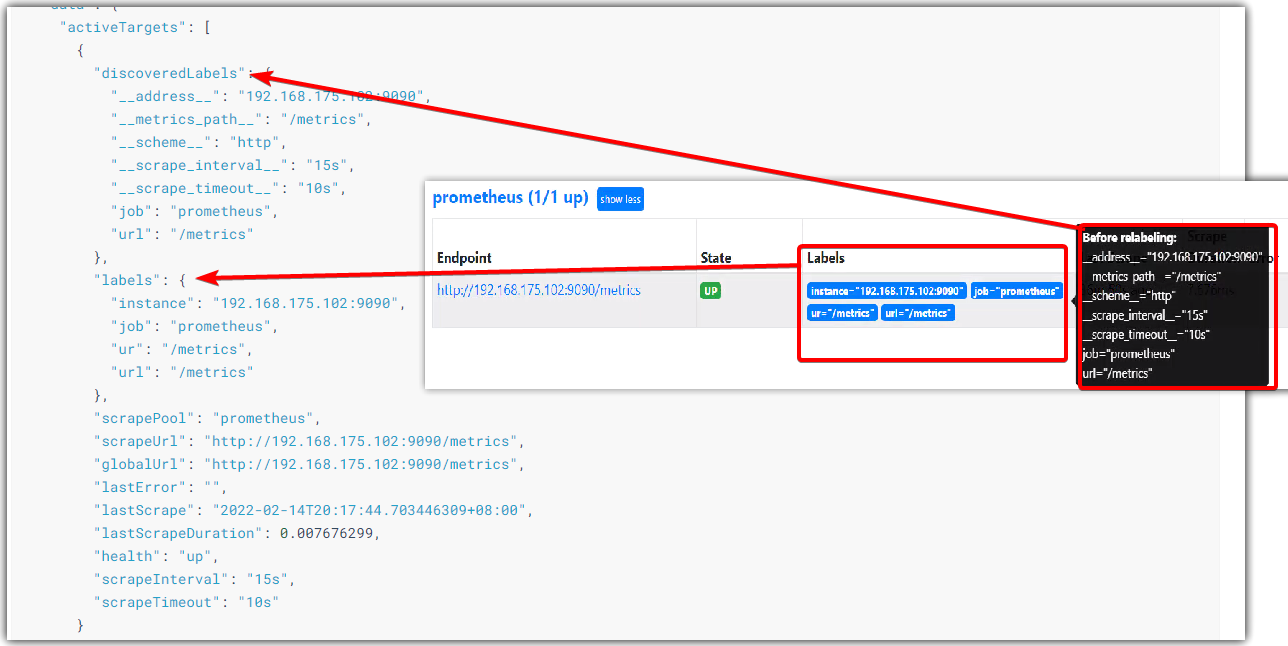
labels元素,代表標籤重構之後的標籤;
discoveredLabels元素,代表原始未修改的標籤;
$ curl //localhost:9090/api/v1/targets
{
  "status": "success",
  "data": {
    "activeTargets": [
      {
        "discoveredLabels": {
          "__address__": "192.168.175.102:9090",
          "__metrics_path__": "/metrics",
          "__scheme__": "http",
          "__scrape_interval__": "15s",
          "__scrape_timeout__": "10s",
          "job": "prometheus",
          "url": "/metrics"
        },
        "labels": {
          "instance": "192.168.175.102:9090",
          "job": "prometheus",
          "ur": "/metrics",
          "url": "/metrics"
        },
        "scrapePool": "prometheus",
        "scrapeUrl": "//192.168.175.102:9090/metrics",
        "globalUrl": "//192.168.175.102:9090/metrics",
        "lastError": "",
        "lastScrape": "2022-02-14T20:17:44.703446309+08:00",
        "lastScrapeDuration": 0.007676299,
        "health": "up",
        "scrapeInterval": "15s",
        "scrapeTimeout": "10s"
      }
    ],
    "droppedTargets": [
      {
        "discoveredLabels": {
          "__address__": "127.0.0.1:9100",
          "__metrics_path__": "/metrics",
          "__scheme__": "http",
          "__scrape_interval__": "1m",
          "__scrape_timeout__": "10s",
          "job": "node"
        }
      }
    ]
  }
}
Rules
返回當前告警規則和預計算規則的列表。另外,還返回每個告警規則的當前活躍告警(在alert元素中)。
API:
GET /api/v1/rules
url參數:
type=alert|record,返回告警規則或預計算規則
$ curl //localhost:9090/api/v1/rules

{
	"status": "success",
	"data": {
		"groups": [
			{
				"name": "target_sum",
				"file": "/root/prometheus/first_rules.yml",
				"rules": [
					{
						"name": "job:up:sum",
						"query": "sum by(job) (up)",
						"health": "ok",
						"evaluationTime": 0.000760367,
						"lastEvaluation": "2022-02-14T21:17:56.68729078+08:00",
						"type": "recording"
					},
					{
						"state": "firing",
						"name": "node_exporter_status",
						"query": "job:up:sum{job=\"node_exporter\"} != 3",
						"duration": 3,
						"labels": {
							"status": "nice"
						},
						"annotations": {
							"summary": "any node_exporter down.{{$labels.instance}}"
						},
						"alerts": [
							{
								"labels": {
									"alertname": "node_exporter_status",
									"job": "node_exporter",
									"status": "nice"
								},
								"annotations": {
									"summary": "any node_exporter down."
								},
								"state": "firing",
								"activeAt": "2022-02-14T13:17:41.683269601Z",
								"value": "2e+00"
							}
						],
						"health": "ok",
						"evaluationTime": 0.00073434,
						"lastEvaluation": "2022-02-14T21:17:56.688054823+08:00",
						"type": "alerting"
					}
				],
				"interval": 15,
				"limit": 0,
				"evaluationTime": 0.0015459,
				"lastEvaluation": "2022-02-14T21:17:56.687251569+08:00"
			}
		]
	}
}
Alerts
返回當前活躍的告警列表
API:
GET /api/v1/alerts
示例:
$ curl //localhost:9090/api/v1/alerts

{
	"status": "success",
	"data": {
		"alerts": [
			{
				"labels": {
					"alertname": "node_exporter_status",
					"job": "node_exporter",
					"status": "nice"
				},
				"annotations": {
					"summary": "any node_exporter down."
				},
				"state": "firing",
				"activeAt": "2022-02-14T13:17:41.683269601Z",
				"value": "2e+00"
			}
		]
	}
}
查詢target元數據
API:
GET /api/v1/targets/metadata
URL參數:
match_target=<label_selectors>:標籤選擇器,不加默認選擇所有targetmetric=<string>:metrics指標名稱,不加默認選擇所有指標limit=<number>:數量限制
$ curl -G //localhost:9091/api/v1/targets/metadata \
    --data-urlencode 'metric=go_goroutines' \
    --data-urlencode 'match_target={job="prometheus"}' \
    --data-urlencode 'limit=2'

$ curl -G //localhost:9091/api/v1/targets/metadata \
    --data-urlencode 'match_target={instance="127.0.0.1:9090"}'
查詢metric元數據
API:
GET /api/v1/metadata
URL參數:
limit=<number>:返回結果的最大數量metric=<string>:指定指標名稱
Alertmanagers
API:
GET /api/v1/alertmanagers
示例:
$ curl //localhost:9090/api/v1/alertmanagers
{
  "status": "success",
  "data": {
    "activeAlertmanagers": [
      {
        "url": "//127.0.0.1:9090/api/v1/alerts"
      }
    ],
    "droppedAlertmanagers": [
      {
        "url": "//127.0.0.1:9093/api/v1/alerts"
      }
    ]
  }
}
status
Config
API:
GET /api/v1/status/config
示例:
$ curl //localhost:9090/api/v1/status/config
{
  "status": "success",
  "data": {
    "yaml": "<content of the loaded config file in YAML>",
  }
}
Flags
API:
GET /api/v1/status/flags
示例:
$ curl //localhost:9090/api/v1/status/flags
{
  "status": "success",
  "data": {
    "alertmanager.notification-queue-capacity": "10000",
    "alertmanager.timeout": "10s",
    "log.level": "info",
    "query.lookback-delta": "5m",
    "query.max-concurrency": "20",
    ...
  }
}
Runtime Information
返回運行資訊:啟動時間、啟動路徑、chunk數量、時序數量、數據保存天數
API:
GET /api/v1/status/runtimeinfo
示例:
$ curl //localhost:9090/api/v1/status/runtimeinfo
{
	"status": "success",
	"data": {
		"startTime": "2022-02-14T08:00:38.922544422Z",				# 啟動時間
		"CWD": "/root/prometheus",									# 啟動路徑
		"reloadConfigSuccess": true,
		"lastConfigTime": "2022-02-14T08:00:38Z",
		"corruptionCount": 0,
		"goroutineCount": 39,
		"GOMAXPROCS": 2,
		"GOGC": "",
		"GODEBUG": "",
		"storageRetention": "15d"									# 數據保存天數
	}
}
Build Information
API:
GET /api/v1/status/buildinfo
示例:
$ curl //localhost:9090/api/v1/status/buildinfo
{
  "status": "success",
  "data": {
    "version": "2.13.1",
    "revision": "cb7cbad5f9a2823a622aaa668833ca04f50a0ea7",
    "branch": "master",
    "buildUser": "julius@desktop",
    "buildDate": "20191102-16:19:59",
    "goVersion": "go1.13.1"
  }
}
TSDB Stats
返回TSDB的統計資訊
API:
GE#T /api/v1/status/tsdb
示例:
WAL Replay Stats
API:
GET /api/v1/status/walreplay
示例:
$ curl //localhost:9090/api/v1/status/walreplay
{
  "status": "success",
  "data": {
    "min": 2,
    "max": 5,
    "current": 40,
    "state": "in progress"
  }
}
TSDB Admin APIs
管理資料庫的介面,必須先啟動--web.enable-admin-api命令行參數。
Snapshot – 快照
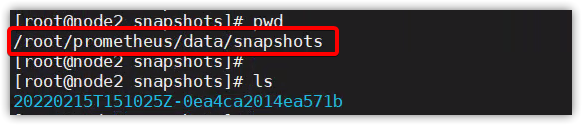
給當前所有數據創建一個快照,存儲在資料庫存儲目錄(默認data)的snapshots/<datetime>-<rand>目錄下。
POST /api/v1/admin/tsdb/snapshot
PUT /api/v1/admin/tsdb/snapshot
URL參數:
skip_head=<bool>:是否跳過head 塊中的數據,默認false,即不跳過
$ curl -XPOST //localhost:9090/api/v1/admin/tsdb/snapshot
{
  "status": "success",
  "data": {
    "name": "20171210T211224Z-2be650b6d019eb54"
  }
}

# 不跳過記憶體中的數據,即同時備份記憶體中的數據
curl -XPOST //127.0.0.1:9090/api/v1/admin/tsdb/snapshot?skip_head=false
# 跳過記憶體中的數據
curl -XPOST //127.0.0.1:9090/api/v1/admin/tsdb/snapshot?skip_head=true
快照將存在
刪除時序
該API將從資料庫中刪除選擇的時序,實際數據仍然存在磁碟上,並在未來的壓縮中進行清理,或者通過Tombstone進行清理。
如果成功,將返回204狀態碼。
API:
POST /api/v1/admin/tsdb/delete_series
PUT /api/v1/admin/tsdb/delete_series
URL參數:
match[]=<series_selector>: 時序選擇器,可寫多個(&連接),可選項。start=<rfc3339 | unix_timestamp>: 開始時間戳。end=<rfc3339 | unix_timestamp>: 結束時間戳。
示例:
curl -X POST \
  -g '//localhost:9090/api/v1/admin/tsdb/delete_series?match[]=up&match[]=process_start_time_seconds{job="prometheus"}'
Tombstone清理
CleanTombstones將從磁碟中移除已刪除數據,同時清理存在的tombstones。可以在刪除時序後用來釋放空間。
如果成功,將返回204狀態碼。
API:
POST /api/v1/admin/tsdb/clean_tombstones
PUT /api/v1/admin/tsdb/clean_tombstones
示例:
$ curl -XPOST //localhost:9090/api/v1/admin/tsdb/clean_tombstones
管理API
健康檢查
GET /-/healthy
就緒檢查
GET /-/ready
配置重載
PUT  /-/reload
POST /-/reload
必須開啟--web.enable-lifecycle命令行選項;
- 也可以通過發送
SIGHUP訊號來觸發配置重載
$  ps -ef | grep  prometheu[s] | gawk '{print $2}'
13715
$ kill -SIGHUP 13715
# 或者
$ kill -1 13715
Prometheus優雅停止
PUT  /-/quit
POST /-/quit
必須開啟--web.enable-lifecycle命令行選項;
- 也可以通過發送
SIGTERM訊號來觸發優雅停止
$  ps -ef | grep  prometheu[s] | gawk '{print $2}'
13715
$ kill -SIGTERM 13715
# 或者
$ kill -15 13715
# kill -9是強制停止
存儲
Prometheus支援本地存儲和遠程存儲。
本地存儲(TSDB)
存儲配置:
--storage.tsdb.path:數據存儲目錄。默認為 data/。--storage.tsdb.retention.time:數據過期清理時間,默認為 15 天。--storage.tsdb.wal-compression:此標誌啟用預寫日誌(WAL)的壓縮。根據您的數據,您可以預期 WAL 大小將減少一半,而額外的 CPU 負載卻很少。此標誌在 2.11.0 中引入,默認情況下在 2.20.0 中啟用。請注意,一旦啟用,將 Prometheus 降級到 2.11.0 以下的版本將需要刪除 WAL。
目錄結構:
prometheus按照block塊的方式來存儲數據,每2小時為一個時間單位。
data
├── 01FVSSJACPYRB38QPF8JR7056S				# 數據塊目錄,2小時
│   ├── chunks
│   │   └── 000001						   # 保存 timeseries 數據
│   ├── index							    #  索引文件,通過metric名和labels查找時序數據在chunk文件中的位置
│   ├── meta.json							# 配置文件,包含起止時間、包含哪些block
│   └── tombstones							# 刪除操作會首先記錄到這個文件
├── 01FVYQFWYBVT315GWTPXMEVAG5
│   ├── chunks
│   │   └── 000001
│   ├── index
│   ├── meta.json
│   └── tombstones
├── chunks_head
│   ├── 000016
│   └── 000017
├── lock
├── queries.active
└── wal
    ├── 00000015
    ├── 00000016
    ├── 00000017
    ├── 00000018
    └── checkpoint.00000014
        └── 00000000
數據存儲方式:
prometheus將採集到的樣本以時間序列的方式保存在記憶體(TSDB 時序資料庫)中,並定時保存到硬碟中。
默認存儲15天,超過15天以上的數據將會被刪除。若要永久存儲數據,有兩種方式,方式一:修改prometheus的配置參數「storage.tsdb.retention.time=10000d」;方式二:將數據引入存儲到Influcdb中。為保證數據安全性,這裡主要介紹的是promethues本地存儲備份數據的方法。
Prometheus按 2 小時一個 block 進行數據存儲,最新寫入的數據保存在記憶體 block 中,2 小時後自動寫入磁碟。
為防止程式異常導致數據丟失,採用了WAL(write-ahead-log)機制,即2小時內記錄的數據存儲在記憶體中的同時,還會記錄一份日誌,存儲在block下的wal目錄中。當程式再次啟動時,會將wal目錄中的數據寫入對應的block中,從而達到恢複數據的效果。
刪除數據時,刪除條目會記錄在tombstones 中,而不是立刻刪除。
數據備份
完全備份:
備份數據存儲目錄data,即可完全備份,不過這樣效率很低。
快照備份:
可以通過API的方式實現數據備份。
啟動Prometheus時需要加上--web.``enable``-admin-api 命令行選項
數據還原
利用api方式製作成snapshot後,還原時將snapshot中的文件覆蓋到data目錄下,重啟prometheus即可!
添加定時備份任務
$ crontable -l                              #注意時區,修改完時區後,需要重啟 crontab    systemctl  restart cron

0 3 * * 7 sudo /usr/bin/curl -XPOST -I //127.0.0.1:9090/api/v1/admin/tsdb/snapshot >> /home/bill/prometheusbackup.log