Spring Boot 2.x監控數據可視化(Actuator + Prometheus + Grafana手把手)
- 2019 年 11 月 11 日
- 筆記
TIPS
本文基於Spring Boot 2.1.4,理論支援Spring Boot 2.x所有版本
眾所周知,Spring Boot有個子項目Spring Boot Actuator,它為應用提供了強大的監控能力。從Spring Boot 2.0開始,Actuator將底層改為Micrometer,提供了更強、更靈活的監控能力。Micrometer是一個監控門面,可以類比成監控界的 Slf4j 。
藉助Micrometer,應用能夠對接各種監控系統,例如:
- AppOptics
- Atlas
- Datadog
- Dynatrace
- Elastic
- Ganglia
- Graphite
- Humio
- Influx
- JMX
- KairosDB
- New Relic
- Prometheus
- SignalFx
- Simple (in-memory)
- StatsD
- Wavefront
下面演示如何對接 Prometheus ,並使用 Grafana 實現數據的可視化。
TIPS
童鞋們對Prometheus或Grafana不熟悉也沒關係,本文是手把手文章,按步驟操作即可。
編碼
編寫程式碼
-
加依賴
<dependency> <groupId>org.springframework.boot</groupId> <artifactId>spring-boot-starter-actuator</artifactId></dependency><dependency> <groupId>io.micrometer</groupId> <artifactId>micrometer-registry-prometheus</artifactId></dependency>這裡,我們為應用引入了
micrometer-registry-prometheus,事實上,你想對接上文列表中的哪款監控系統,就寫啥。例如想對接Influx,則需添加依賴micrometer-registry-influx。 -
寫配置
server: port: 8080spring: application: name: prometheus-testmanagement: endpoints: web: exposure: include: 'prometheus' metrics: tags: application: ${spring.application.name}如配置所示,指定應用名為
prometheus-test,並將Actuator的/actuator/prometheus端點暴露出來;management.metrics.tags.application=prometheus-test作用是為指標設置一個名為application="prometheus-test"的Tag,Tag是Prometheus提供的一種能力,從而實現更加靈活的篩選。
測試
-
啟動應用
-
訪問
http://localhost:8080/actuator/prometheus可獲得類似如下的結果:# HELP jvm_memory_used_bytes The amount of used memory# TYPE jvm_memory_used_bytes gaugejvm_memory_used_bytes{application="prometheus-test",area="heap",id="PS Old Gen",} 2.1193976E7jvm_memory_used_bytes{application="prometheus-test",area="nonheap",id="Metaspace",} 3.8791688E7jvm_memory_used_bytes{application="prometheus-test",area="heap",id="PS Survivor Space",} 0.0jvm_memory_used_bytes{application="prometheus-test",area="nonheap",id="Compressed Class Space",} 5303976.0jvm_memory_used_bytes{application="prometheus-test",area="heap",id="PS Eden Space",} 8.2574816E7jvm_memory_used_bytes{application="prometheus-test",area="nonheap",id="Code Cache",} 8693824.0# HELP tomcat_global_received_bytes_total # TYPE tomcat_global_received_bytes_total countertomcat_global_received_bytes_total{application="prometheus-test",name="http-nio-8080",} 0.0# HELP jvm_threads_daemon_threads The current number of live daemon threads# TYPE jvm_threads_daemon_threads gaugejvm_threads_daemon_threads{application="prometheus-test",} 20.0# HELP tomcat_sessions_alive_max_seconds # TYPE tomcat_sessions_alive_max_seconds gaugetomcat_sessions_alive_max_seconds{application="prometheus-test",} 0.0# HELP jvm_buffer_memory_used_bytes An estimate of the memory that the Java virtual machine is using for this buffer pool# TYPE jvm_buffer_memory_used_bytes gaugejvm_buffer_memory_used_bytes{application="prometheus-test",id="mapped",} 0.0jvm_buffer_memory_used_bytes{application="prometheus-test",id="direct",} 90112.0# HELP jvm_threads_states_threads The current number of threads having NEW state# TYPE jvm_threads_states_threads gaugejvm_threads_states_threads{application="prometheus-test",state="runnable",} 9.0jvm_threads_states_threads{application="prometheus-test",state="new",} 0.0jvm_threads_states_threads{application="prometheus-test",state="terminated",} 0.0jvm_threads_states_threads{application="prometheus-test",state="blocked",} 0.0jvm_threads_states_threads{application="prometheus-test",state="waiting",} 12.0jvm_threads_states_threads{application="prometheus-test",state="timed-waiting",} 3.0# HELP process_cpu_usage The "recent cpu usage" for the Java Virtual Machine process# TYPE process_cpu_usage gaugeprocess_cpu_usage{application="prometheus-test",} 0.0030590633504868434# HELP logback_events_total Number of error level events that made it to the logs# TYPE logback_events_total counterlogback_events_total{application="prometheus-test",level="info",} 7.0logback_events_total{application="prometheus-test",level="warn",} 0.0logback_events_total{application="prometheus-test",level="trace",} 0.0logback_events_total{application="prometheus-test",level="debug",} 0.0logback_events_total{application="prometheus-test",level="error",} 0.0# HELP tomcat_global_sent_bytes_total # TYPE tomcat_global_sent_bytes_total countertomcat_global_sent_bytes_total{application="prometheus-test",name="http-nio-8080",} 195356.0# HELP process_files_max_files The maximum file descriptor count# TYPE process_files_max_files gaugeprocess_files_max_files{application="prometheus-test",} 10240.0# HELP tomcat_threads_busy_threads # TYPE tomcat_threads_busy_threads gaugetomcat_threads_busy_threads{application="prometheus-test",name="http-nio-8080",} 1.0# HELP process_files_open_files The open file descriptor count# TYPE process_files_open_files gaugeprocess_files_open_files{application="prometheus-test",} 101.0# HELP tomcat_sessions_active_current_sessions # TYPE tomcat_sessions_active_current_sessions gaugetomcat_sessions_active_current_sessions{application="prometheus-test",} 0.0# HELP jvm_classes_unloaded_classes_total The total number of classes unloaded since the Java virtual machine has started execution# TYPE jvm_classes_unloaded_classes_total counterjvm_classes_unloaded_classes_total{application="prometheus-test",} 2.0# HELP jvm_memory_committed_bytes The amount of memory in bytes that is committed for the Java virtual machine to use# TYPE jvm_memory_committed_bytes gaugejvm_memory_committed_bytes{application="prometheus-test",area="heap",id="PS Old Gen",} 1.5466496E8jvm_memory_committed_bytes{application="prometheus-test",area="nonheap",id="Metaspace",} 4.1418752E7jvm_memory_committed_bytes{application="prometheus-test",area="heap",id="PS Survivor Space",} 1.6252928E7jvm_memory_committed_bytes{application="prometheus-test",area="nonheap",id="Compressed Class Space",} 5767168.0jvm_memory_committed_bytes{application="prometheus-test",area="heap",id="PS Eden Space",} 1.73539328E8jvm_memory_committed_bytes{application="prometheus-test",area="nonheap",id="Code Cache",} 8716288.0# HELP http_server_requests_seconds # TYPE http_server_requests_seconds summaryhttp_server_requests_seconds_count{application="prometheus-test",exception="None",method="GET",outcome="SUCCESS",status="200",uri="/actuator/prometheus",} 16.0http_server_requests_seconds_sum{application="prometheus-test",exception="None",method="GET",outcome="SUCCESS",status="200",uri="/actuator/prometheus",} 0.326299973http_server_requests_seconds_count{application="prometheus-test",exception="None",method="GET",outcome="SUCCESS",status="200",uri="/**/favicon.ico",} 3.0http_server_requests_seconds_sum{application="prometheus-test",exception="None",method="GET",outcome="SUCCESS",status="200",uri="/**/favicon.ico",} 0.028434427# HELP http_server_requests_seconds_max # TYPE http_server_requests_seconds_max gaugehttp_server_requests_seconds_max{application="prometheus-test",exception="None",method="GET",outcome="SUCCESS",status="200",uri="/actuator/prometheus",} 0.120627904http_server_requests_seconds_max{application="prometheus-test",exception="None",method="GET",outcome="SUCCESS",status="200",uri="/**/favicon.ico",} 0.015596512# HELP tomcat_global_error_total # TYPE tomcat_global_error_total countertomcat_global_error_total{application="prometheus-test",name="http-nio-8080",} 0.0# HELP jvm_gc_max_data_size_bytes Max size of old generation memory pool# TYPE jvm_gc_max_data_size_bytes gaugejvm_gc_max_data_size_bytes{application="prometheus-test",} 2.863661056E9# HELP jvm_gc_live_data_size_bytes Size of old generation memory pool after a full GC# TYPE jvm_gc_live_data_size_bytes gaugejvm_gc_live_data_size_bytes{application="prometheus-test",} 2.1193976E7# HELP system_load_average_1m The sum of the number of runnable entities queued to available processors and the number of runnable entities running on the available processors averaged over a period of time# TYPE system_load_average_1m gaugesystem_load_average_1m{application="prometheus-test",} 3.9423828125# HELP process_uptime_seconds The uptime of the Java virtual machine# TYPE process_uptime_seconds gaugeprocess_uptime_seconds{application="prometheus-test",} 173.424# HELP tomcat_sessions_expired_sessions_total # TYPE tomcat_sessions_expired_sessions_total countertomcat_sessions_expired_sessions_total{application="prometheus-test",} 0.0# HELP jvm_gc_pause_seconds Time spent in GC pause# TYPE jvm_gc_pause_seconds summaryjvm_gc_pause_seconds_count{action="end of minor GC",application="prometheus-test",cause="Metadata GC Threshold",} 1.0jvm_gc_pause_seconds_sum{action="end of minor GC",application="prometheus-test",cause="Metadata GC Threshold",} 0.012jvm_gc_pause_seconds_count{action="end of major GC",application="prometheus-test",cause="Metadata GC Threshold",} 1.0jvm_gc_pause_seconds_sum{action="end of major GC",application="prometheus-test",cause="Metadata GC Threshold",} 0.045# HELP jvm_gc_pause_seconds_max Time spent in GC pause# TYPE jvm_gc_pause_seconds_max gaugejvm_gc_pause_seconds_max{action="end of minor GC",application="prometheus-test",cause="Metadata GC Threshold",} 0.012jvm_gc_pause_seconds_max{action="end of major GC",application="prometheus-test",cause="Metadata GC Threshold",} 0.045# HELP jvm_gc_memory_promoted_bytes_total Count of positive increases in the size of the old generation memory pool before GC to after GC# TYPE jvm_gc_memory_promoted_bytes_total counterjvm_gc_memory_promoted_bytes_total{application="prometheus-test",} 1.06878E7# HELP jvm_gc_memory_allocated_bytes_total Incremented for an increase in the size of the young generation memory pool after one GC to before the next# TYPE jvm_gc_memory_allocated_bytes_total counterjvm_gc_memory_allocated_bytes_total{application="prometheus-test",} 7.8713648E7# HELP tomcat_global_request_seconds # TYPE tomcat_global_request_seconds summarytomcat_global_request_seconds_count{application="prometheus-test",name="http-nio-8080",} 19.0tomcat_global_request_seconds_sum{application="prometheus-test",name="http-nio-8080",} 0.432# HELP jvm_threads_live_threads The current number of live threads including both daemon and non-daemon threads# TYPE jvm_threads_live_threads gaugejvm_threads_live_threads{application="prometheus-test",} 24.0# HELP jvm_buffer_count_buffers An estimate of the number of buffers in the pool# TYPE jvm_buffer_count_buffers gaugejvm_buffer_count_buffers{application="prometheus-test",id="mapped",} 0.0jvm_buffer_count_buffers{application="prometheus-test",id="direct",} 11.0# HELP process_start_time_seconds Start time of the process since unix epoch.# TYPE process_start_time_seconds gaugeprocess_start_time_seconds{application="prometheus-test",} 1.556017153576E9# HELP tomcat_threads_config_max_threads # TYPE tomcat_threads_config_max_threads gaugetomcat_threads_config_max_threads{application="prometheus-test",name="http-nio-8080",} 200.0# HELP system_cpu_count The number of processors available to the Java virtual machine# TYPE system_cpu_count gaugesystem_cpu_count{application="prometheus-test",} 8.0# HELP tomcat_threads_current_threads # TYPE tomcat_threads_current_threads gaugetomcat_threads_current_threads{application="prometheus-test",name="http-nio-8080",} 10.0# HELP jvm_memory_max_bytes The maximum amount of memory in bytes that can be used for memory management# TYPE jvm_memory_max_bytes gaugejvm_memory_max_bytes{application="prometheus-test",area="heap",id="PS Old Gen",} 2.863661056E9jvm_memory_max_bytes{application="prometheus-test",area="nonheap",id="Metaspace",} -1.0jvm_memory_max_bytes{application="prometheus-test",area="heap",id="PS Survivor Space",} 1.6252928E7jvm_memory_max_bytes{application="prometheus-test",area="nonheap",id="Compressed Class Space",} 1.073741824E9jvm_memory_max_bytes{application="prometheus-test",area="heap",id="PS Eden Space",} 1.395654656E9jvm_memory_max_bytes{application="prometheus-test",area="nonheap",id="Code Cache",} 2.5165824E8# HELP jvm_threads_peak_threads The peak live thread count since the Java virtual machine started or peak was reset# TYPE jvm_threads_peak_threads gaugejvm_threads_peak_threads{application="prometheus-test",} 29.0# HELP jvm_classes_loaded_classes The number of classes that are currently loaded in the Java virtual machine# TYPE jvm_classes_loaded_classes gaugejvm_classes_loaded_classes{application="prometheus-test",} 7936.0# HELP tomcat_sessions_active_max_sessions # TYPE tomcat_sessions_active_max_sessions gaugetomcat_sessions_active_max_sessions{application="prometheus-test",} 0.0# HELP tomcat_global_request_max_seconds # TYPE tomcat_global_request_max_seconds gaugetomcat_global_request_max_seconds{application="prometheus-test",name="http-nio-8080",} 0.161# HELP tomcat_sessions_created_sessions_total # TYPE tomcat_sessions_created_sessions_total countertomcat_sessions_created_sessions_total{application="prometheus-test",} 0.0# HELP tomcat_sessions_rejected_sessions_total # TYPE tomcat_sessions_rejected_sessions_total countertomcat_sessions_rejected_sessions_total{application="prometheus-test",} 0.0# HELP jvm_buffer_total_capacity_bytes An estimate of the total capacity of the buffers in this pool# TYPE jvm_buffer_total_capacity_bytes gaugejvm_buffer_total_capacity_bytes{application="prometheus-test",id="mapped",} 0.0jvm_buffer_total_capacity_bytes{application="prometheus-test",id="direct",} 90112.0# HELP system_cpu_usage The "recent cpu usage" for the whole system# TYPE system_cpu_usage gaugesystem_cpu_usage{application="prometheus-test",} 0.2523364485981308該端點返回的數據結構是Prometheus需要使用的。對照注釋,相信大家能看懂每一項的含義。例如:
# HELP jvm_memory_used_bytes The amount of used memory# TYPE jvm_memory_used_bytes gaugejvm_memory_used_bytes{application="prometheus-test",area="heap",id="PS Old Gen",} 2.1193976E7表示:
prometheus-test應用堆記憶體中的PS Old Gen區域佔用的空間是2.1193976E7位元組。
對接Prometheus
Prometheus是一款開源的監控 + 時序資料庫 + 報警軟體,由SoundCloud公司開發的。目前在CNCF基金會託管,並已成功孵化。
官方網站
安裝Prometheus
TIPS
簡單期間,本文使用Docker方式安裝,其他方式安裝請詳見 Prometheus安裝說明 。
-
準備配置文件,命名為
prometheus.ymlscrape_configs:# 任意寫,建議英文,不要包含特殊字元- job_name: 'spring' # 多久採集一次數據 scrape_interval: 15s # 採集時的超時時間 scrape_timeout: 10s # 採集的路徑是啥 metrics_path: '/actuator/prometheus' # 採集服務的地址,設置成上面Spring Boot應用所在伺服器的具體地址。 static_configs: - targets: ['30.1.229.89:8080']這樣配置後,Prometheus伺服器就會自動每隔15秒請求
http://30.1.229.89:8080/actuator/prometheus。更多配置項詳見 Prometheus Configuration官方文檔 -
在
prometheus.yml文件所在目錄執行如下命令,即可啟動Prometheusdocker run -d -p 9090:9090 -v $(pwd)/prometheus.yml:/etc/prometheus/prometheus.yml prom/prometheus --config.file=/etc/prometheus/prometheus.yml
測試
-
訪問
http://localhost:9090,可看到類似如下的介面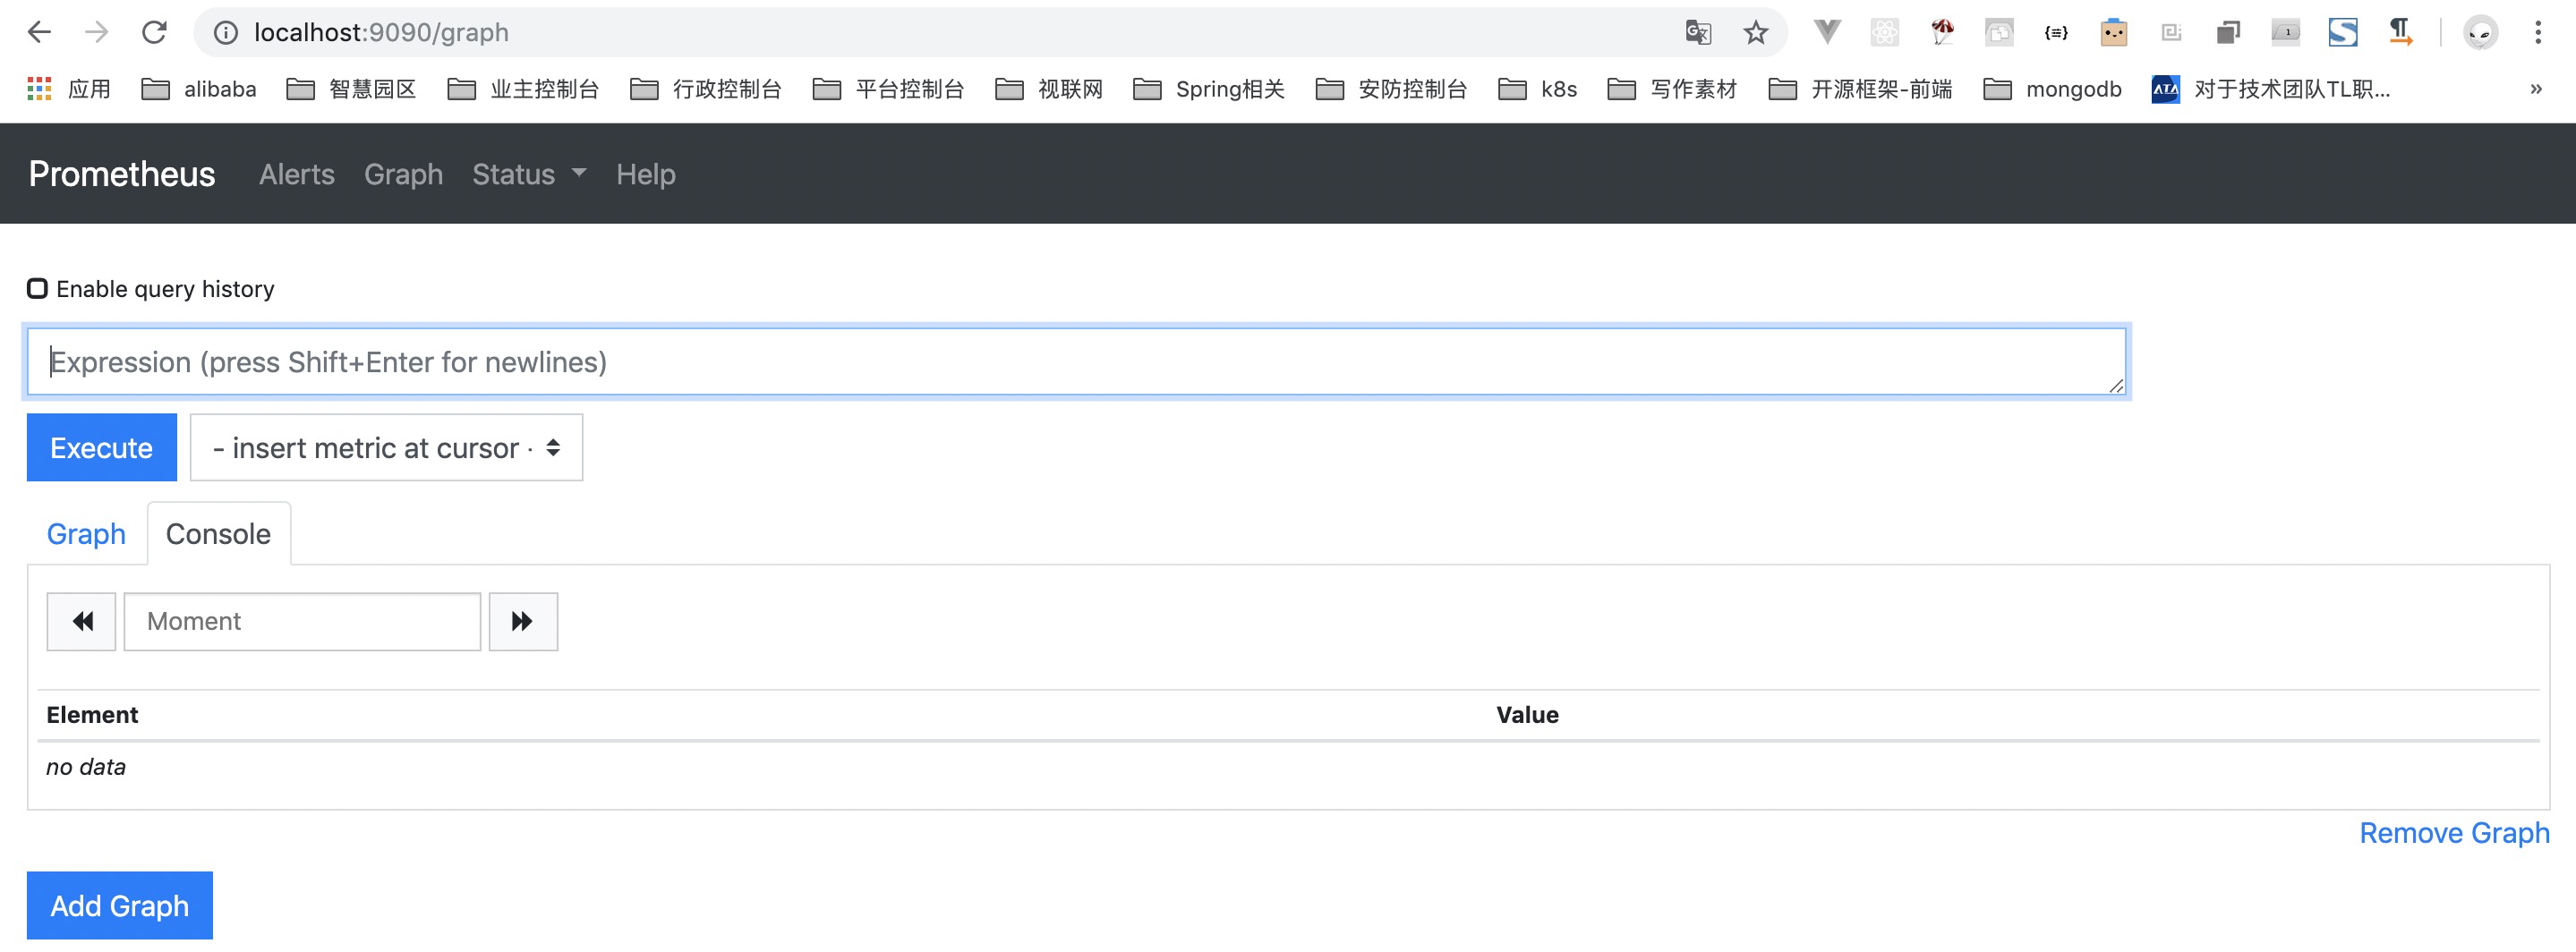
-
點擊
Insert metric at cursor,即可選擇監控指標;點擊Graph,即可讓指標以圖表方式展示;點擊Execute按鈕,即可看到類似下圖的結果: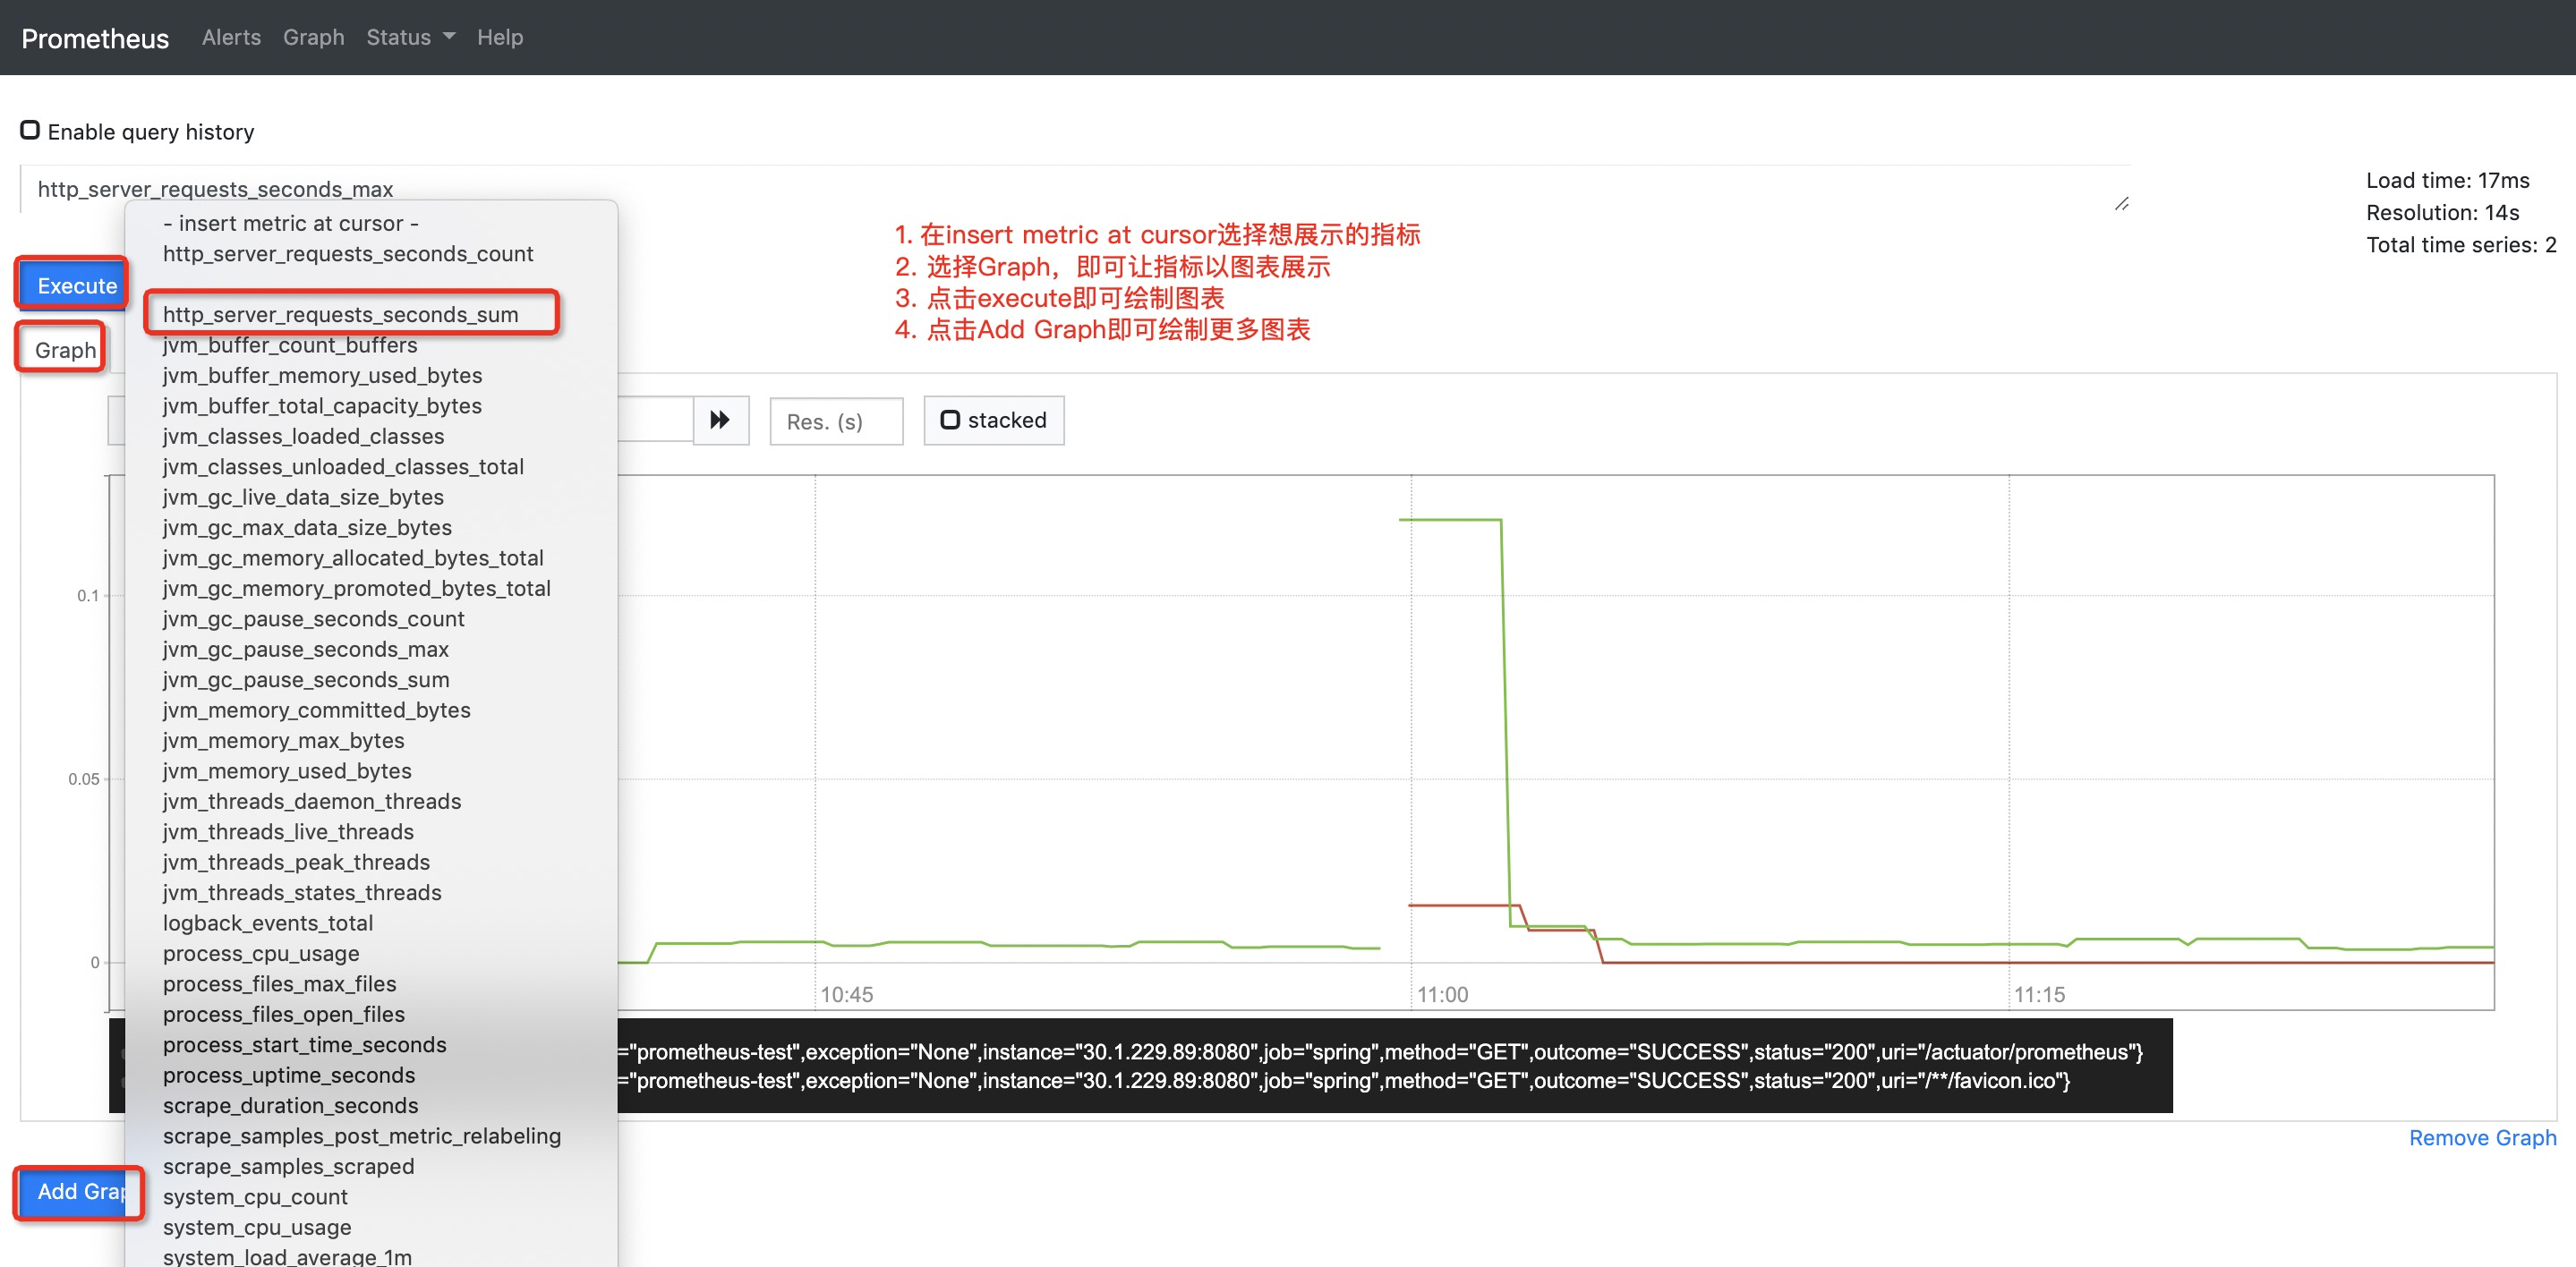
Grafana可視化
至此,已經用Prometheus實現了監控數據的可視化,然而使用體驗並不好。下面來用Grafana實現更友好、更貼近生產的監控可視化。
Grafana是一個開源的跨平台度量分析和可視化 + 告警工具。
官方網站
安裝Grafana
TIPS
簡單期間,本文使用Docker方式安裝,其他方式安裝請詳見 Grafana安裝說明 。
-
啟動
docker run -d -p 3000:3000 grafana/grafana
配置
-
登錄:訪問
http://localhost:3000/login,初始帳號/密碼為:admin/admin,登錄後,即可看到類似如下的介面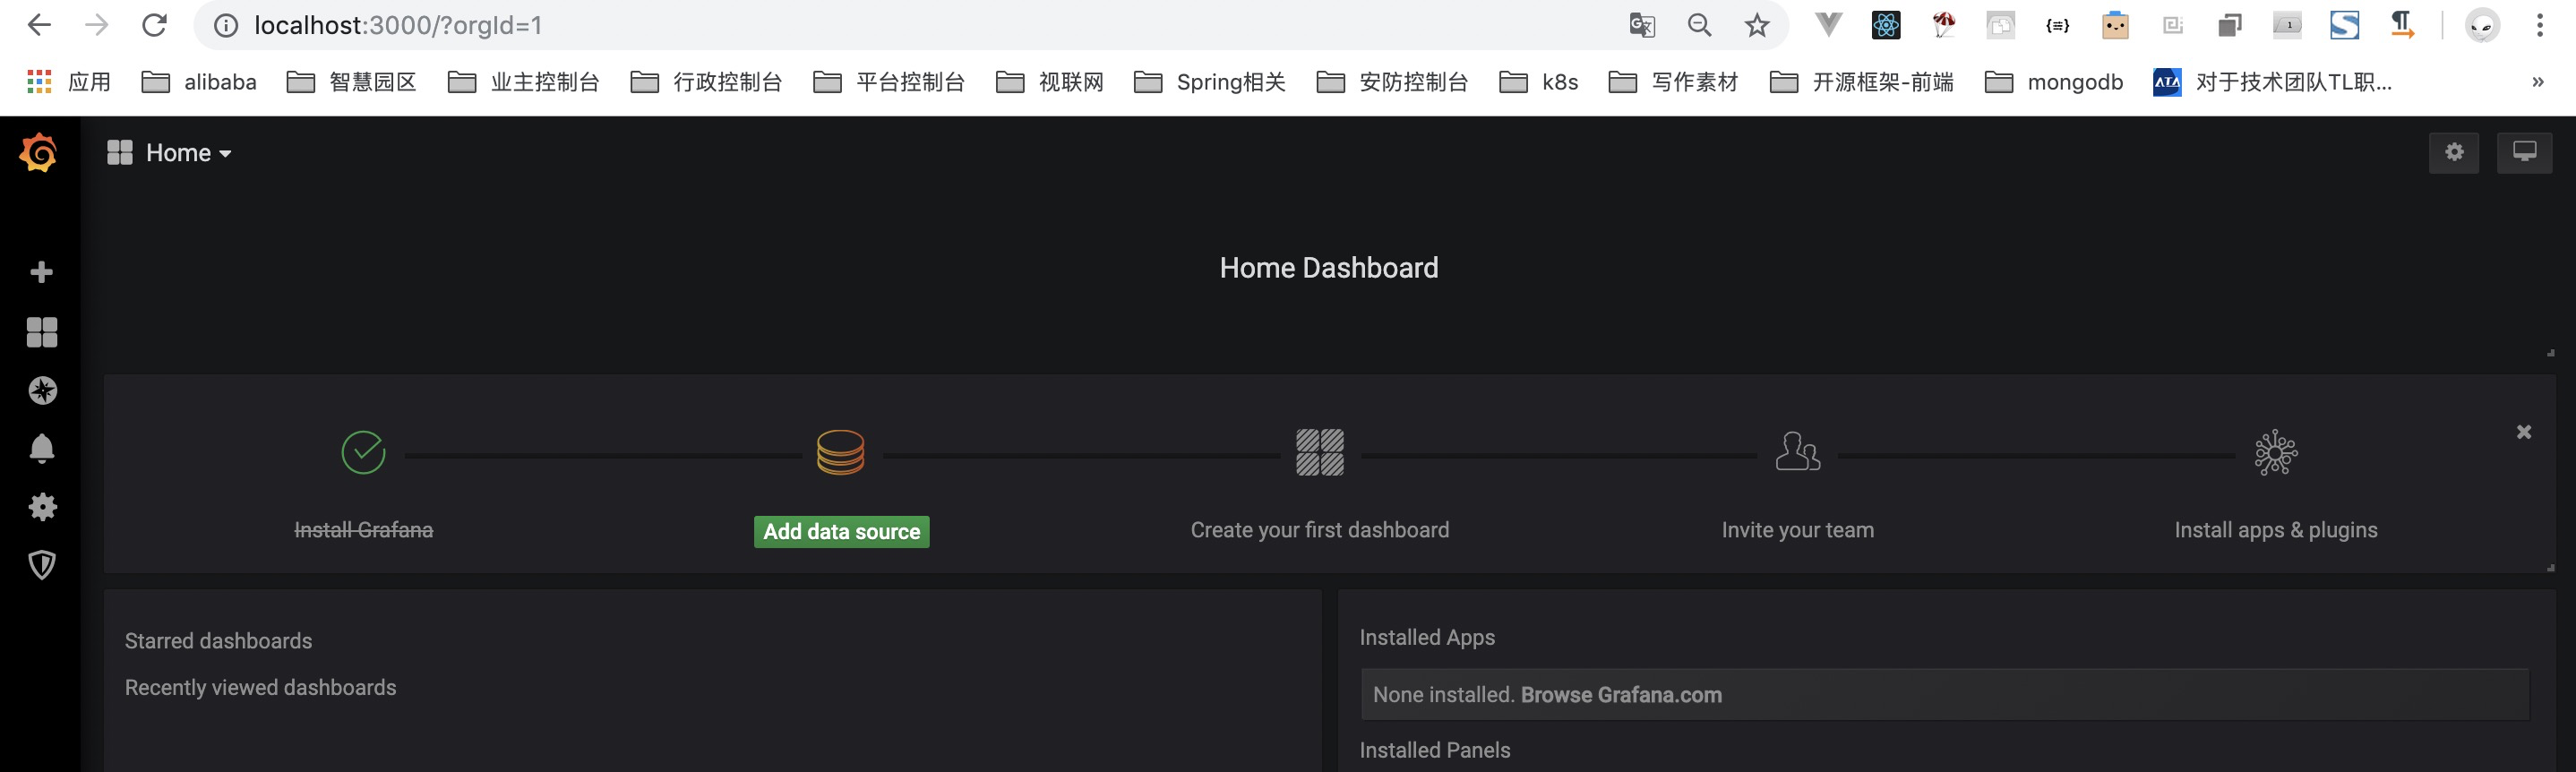
-
點擊
Add data source,即可看到類似如下的介面:
-
點擊Prometheus,即可看到類似如下介面:
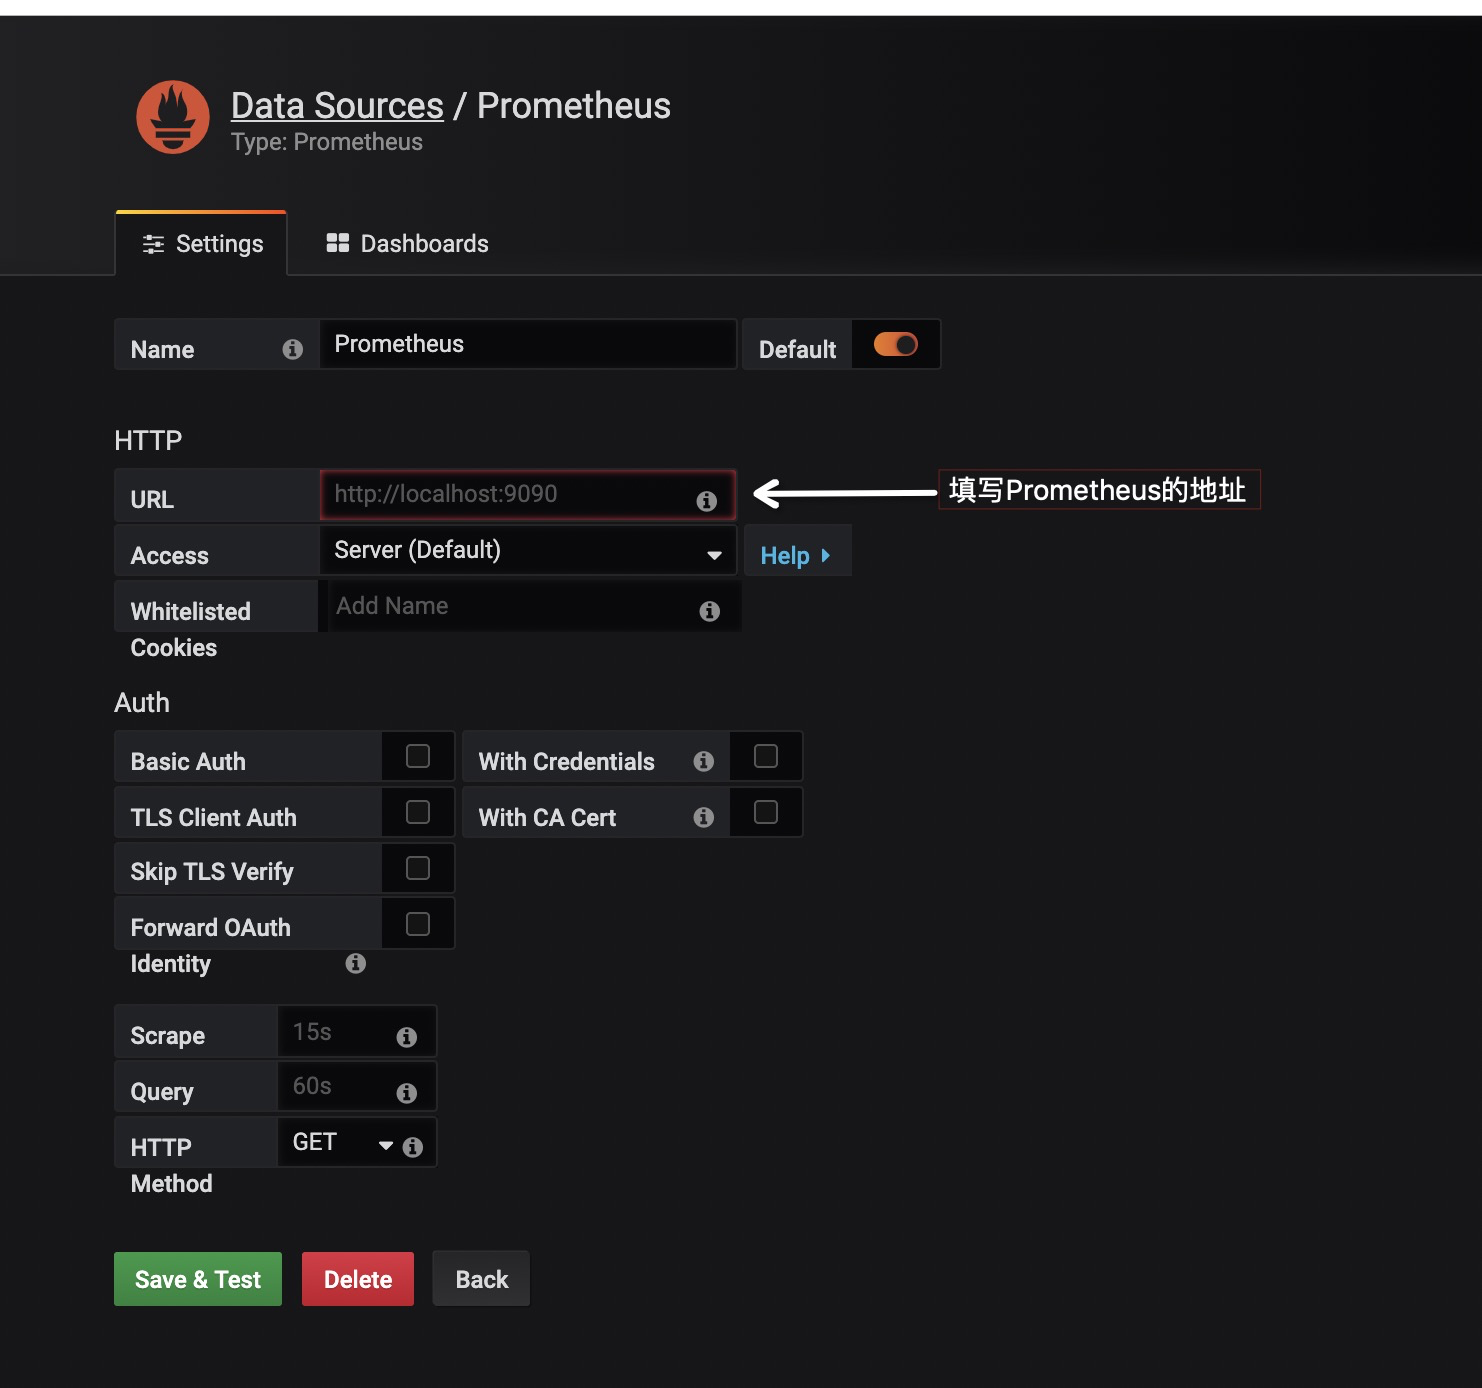
-
填寫Prometheus的首頁地址,並點擊
Save & Test
創建監控Dashboard
-
點擊導航欄上的
+按鈕,並點擊Dashboard,將會看到類似如下的介面: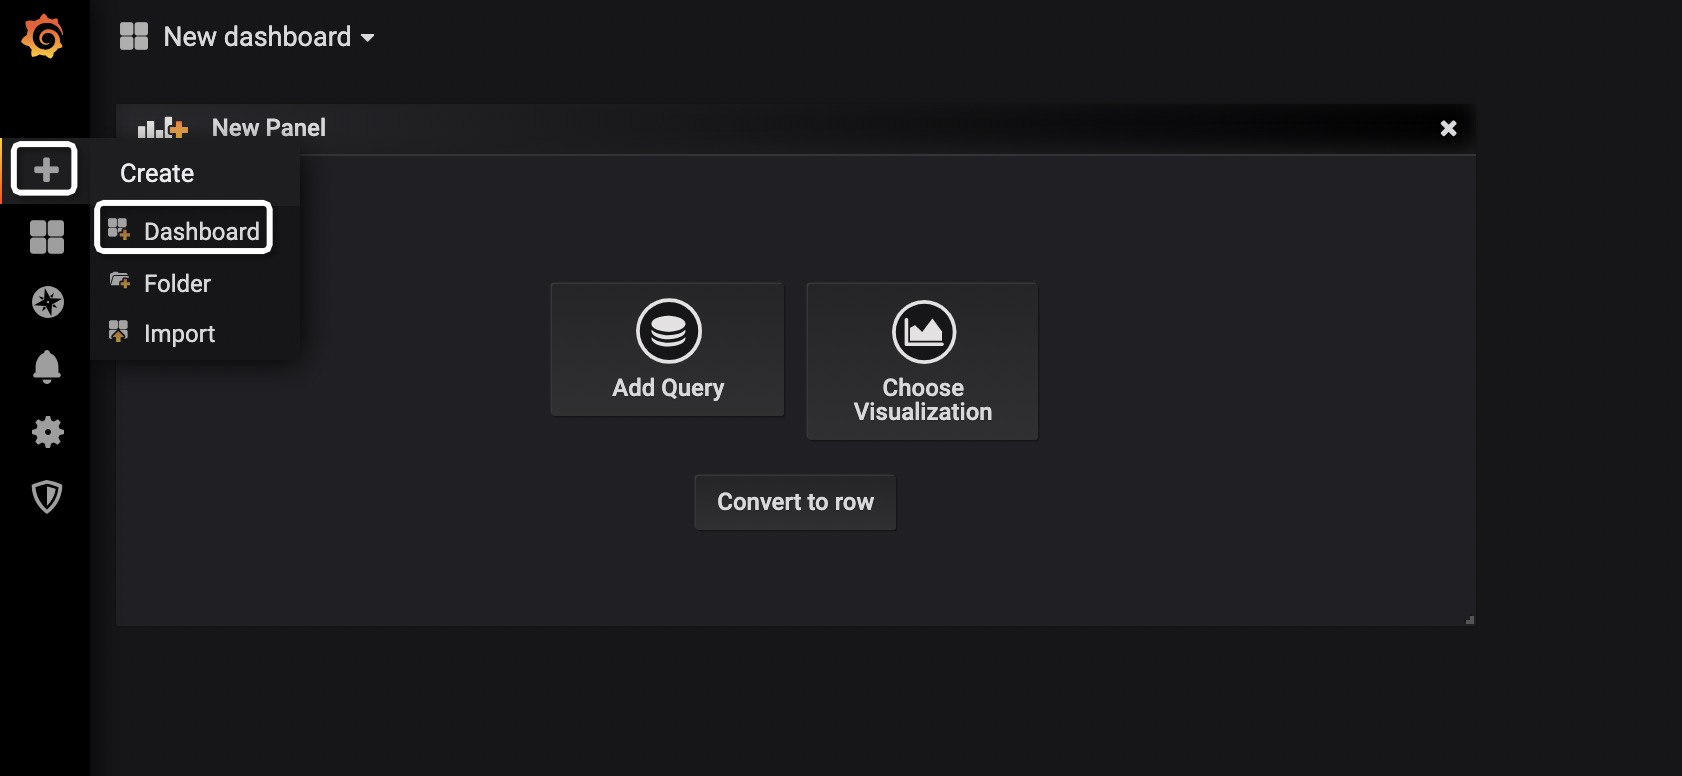
-
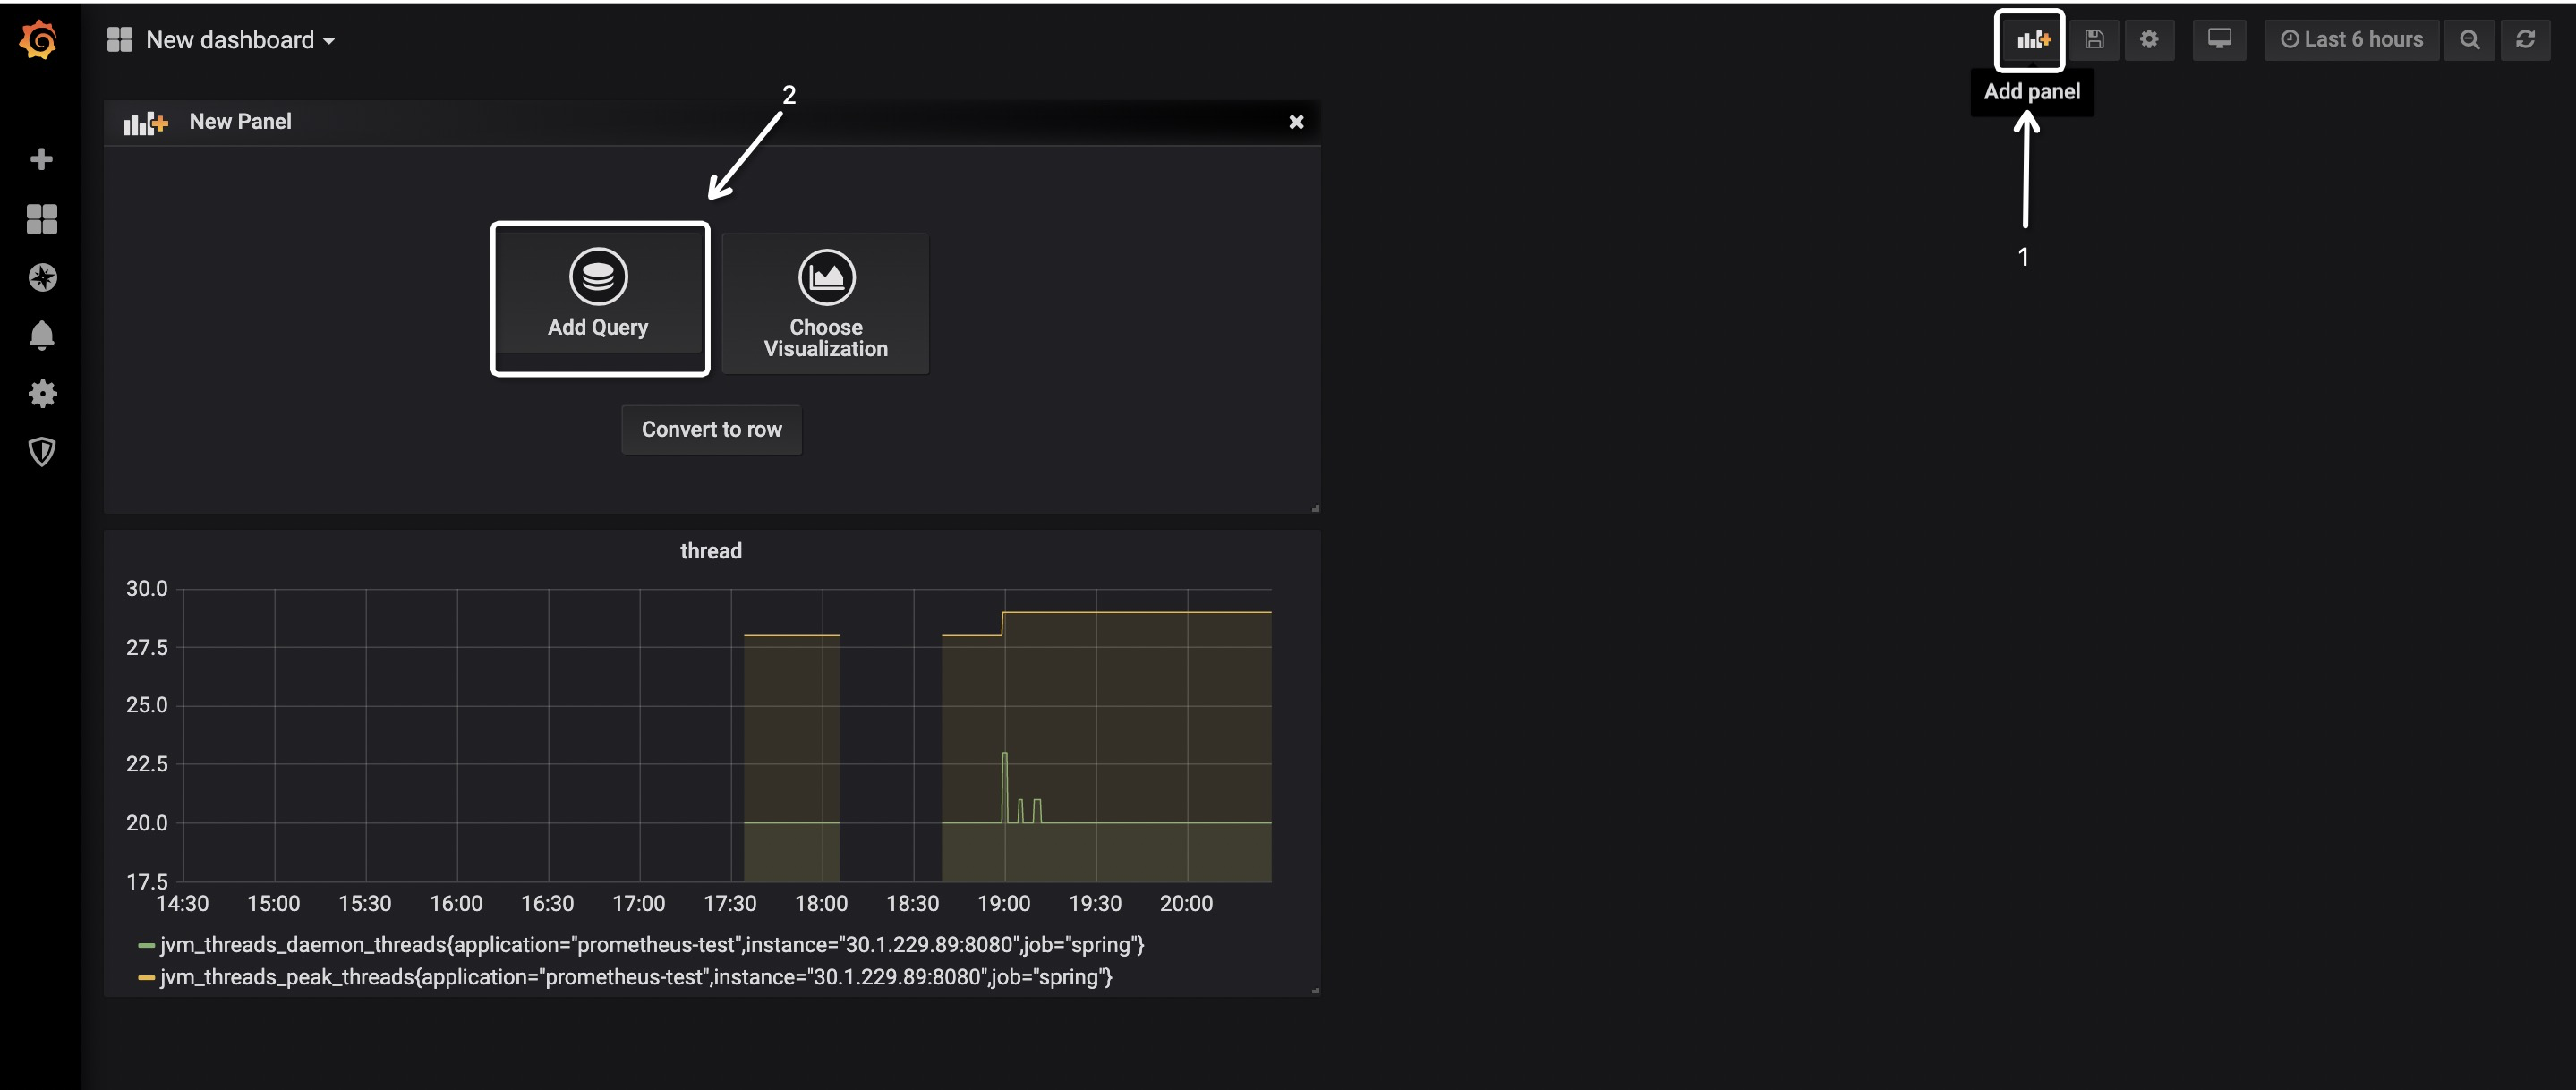
點擊
Add Query,即可看到類似如下的介面: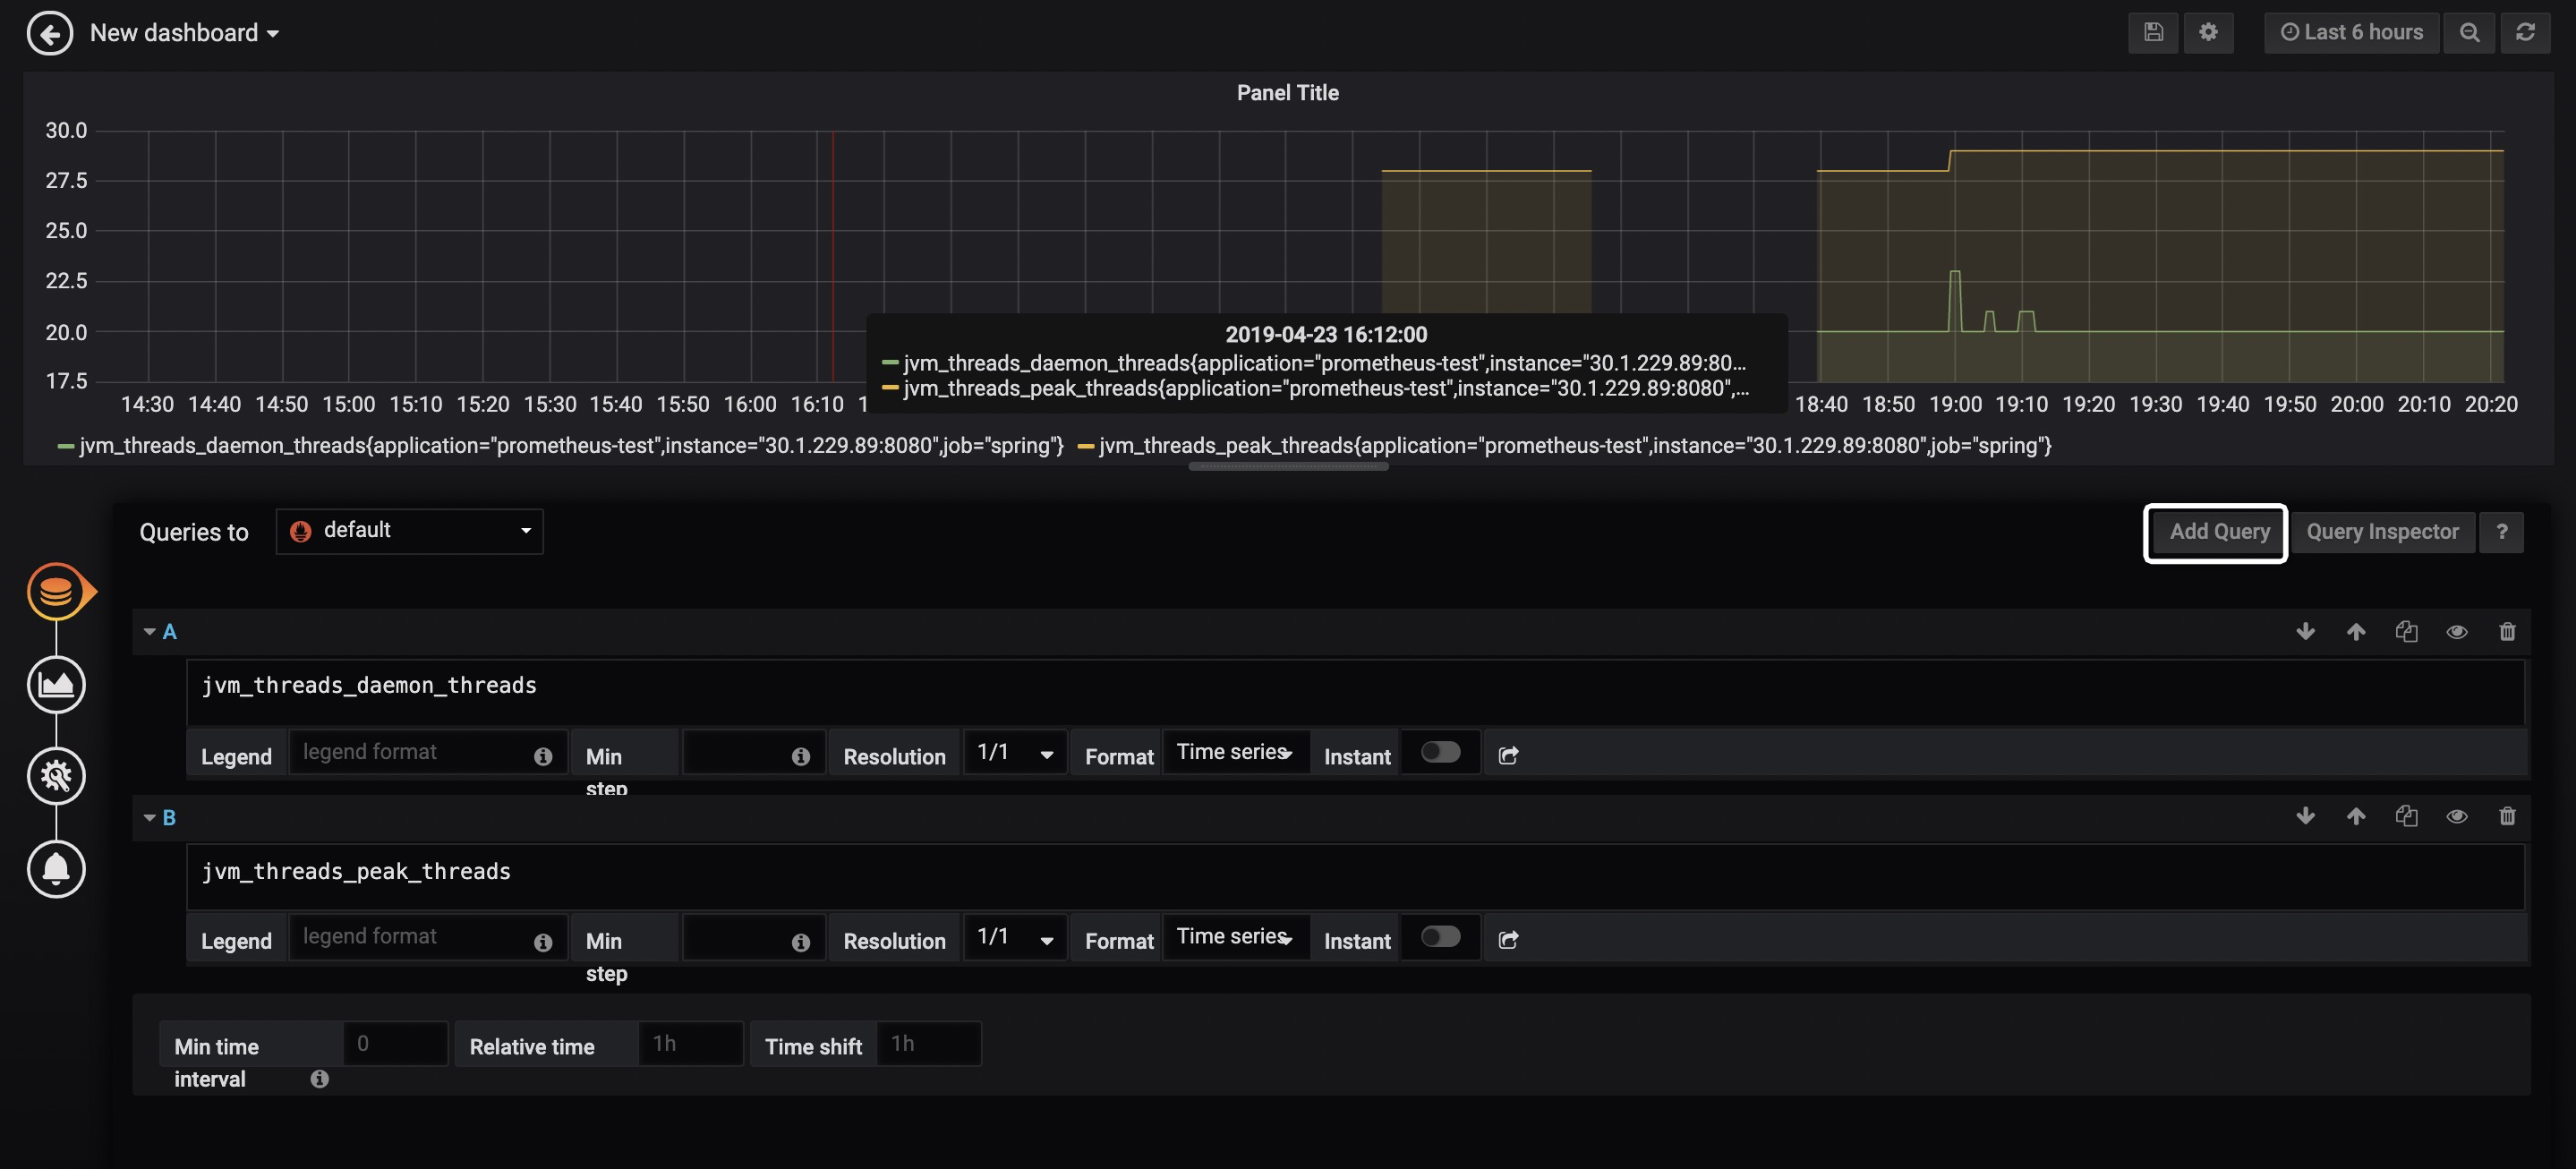
在白框標記的位置輸入指標,指標的取值詳見Spring Boot應用的
/actuator/prometheus端點,例如jvm_memory_used_bytes、jvm_threads_states_threads、jvm_threads_live_threads等,Grafana會給你較好的提示,並且支援較為複雜的計算,例如聚合、求和、平均等。如果想要繪製多個線條,可點擊Add Query按鈕,如上圖所示,筆者為圖表繪製了兩條線,分別代表daemon以及peak執行緒。 -
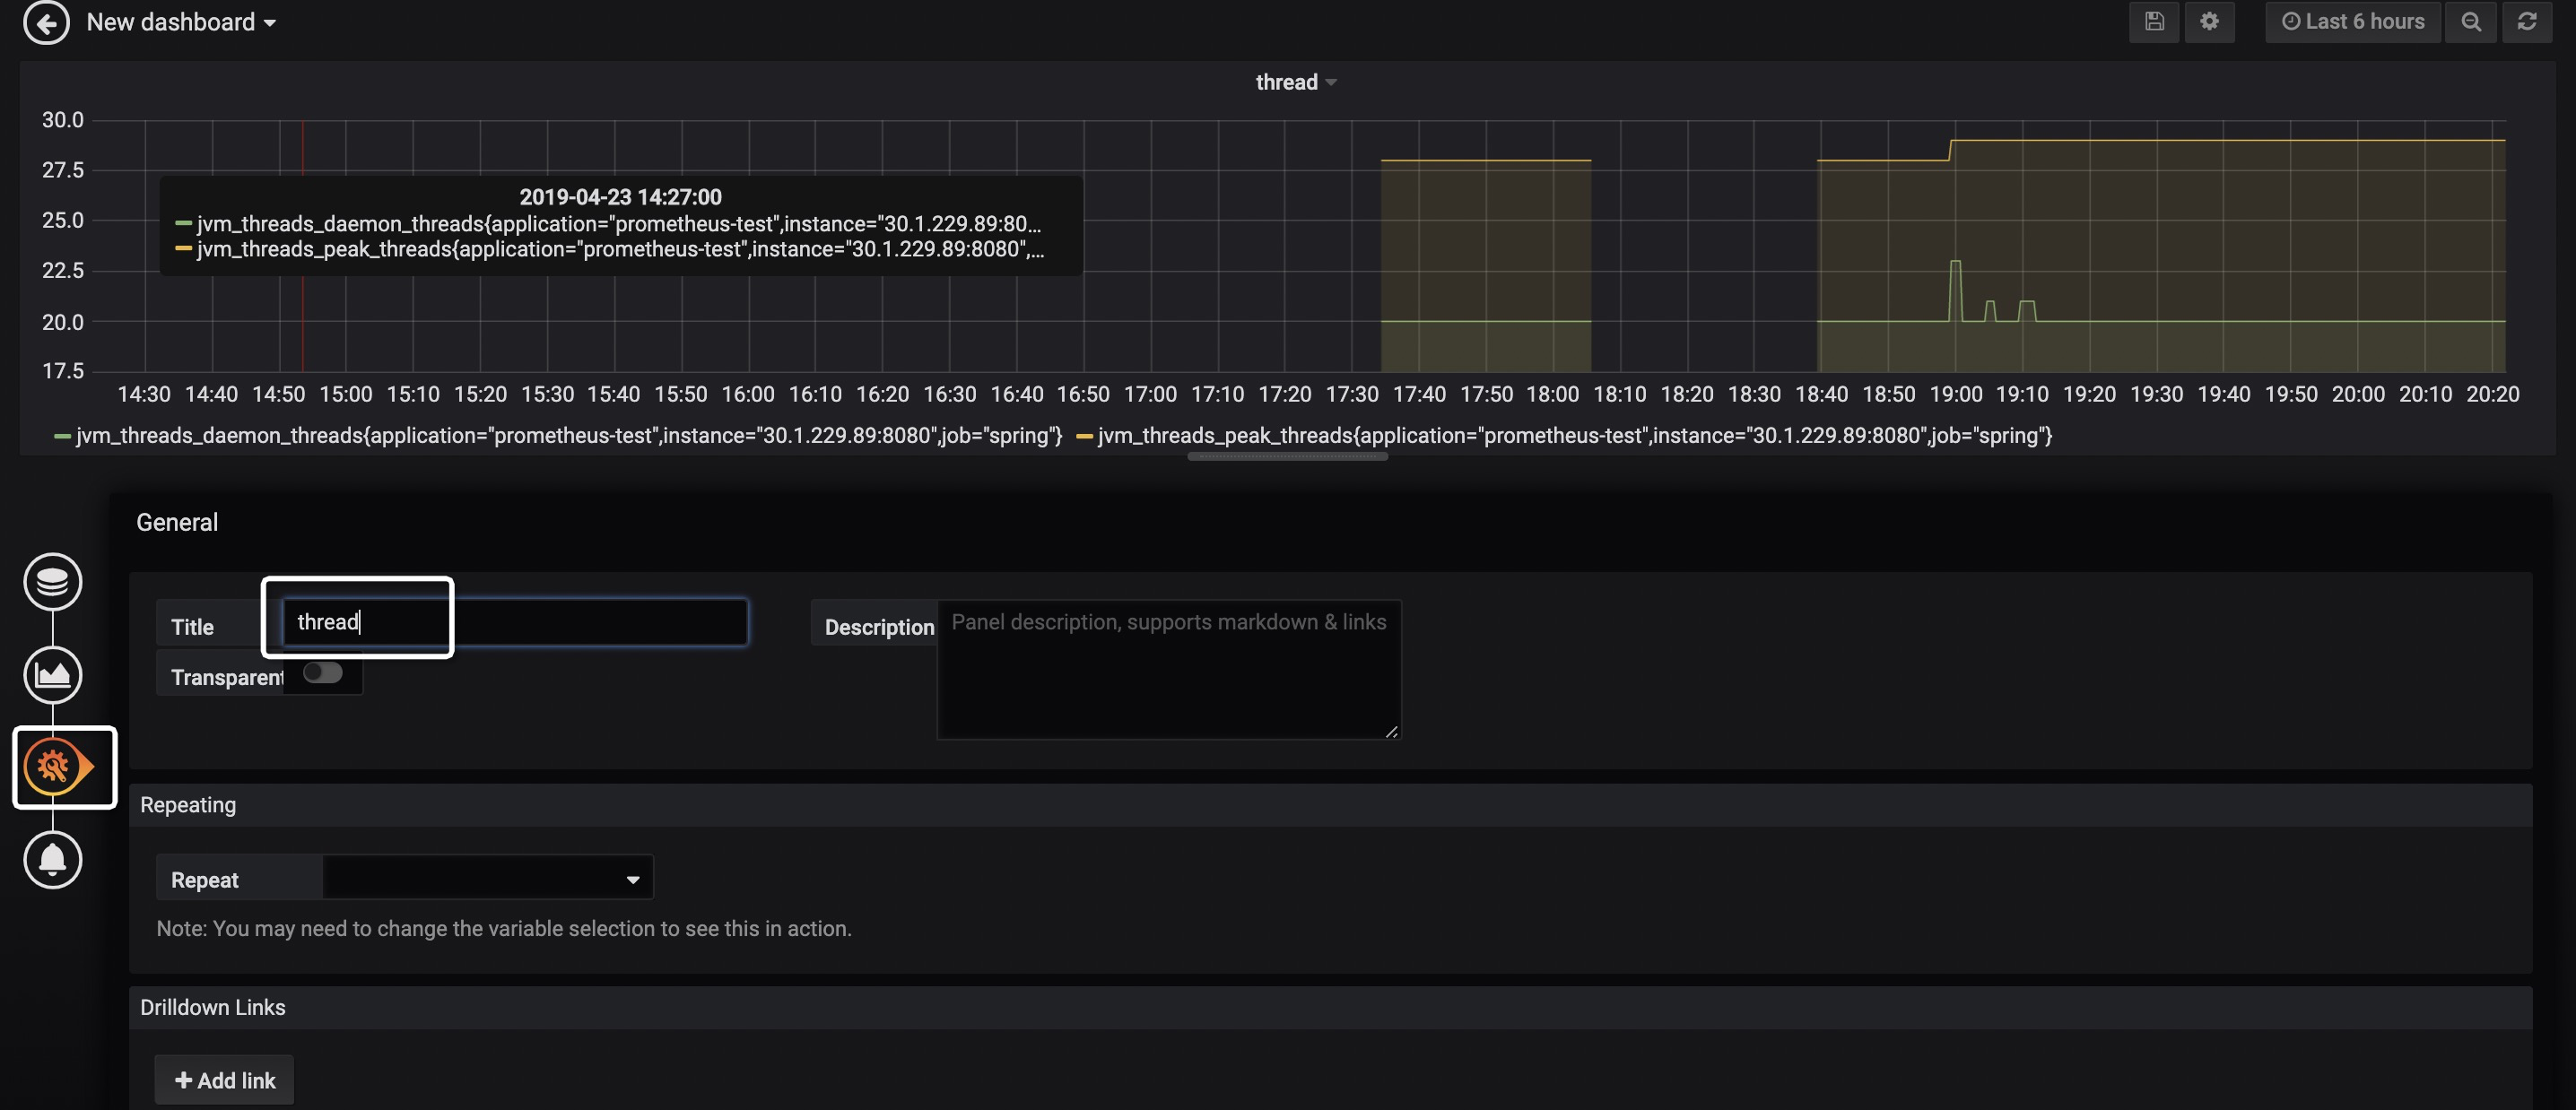
點擊下圖的按鈕,並填入Title,即可設置圖表標題。
-
按下圖步驟操作,即可為Dashboard添加新的圖表。
Dashboard市場
至此,已可用Grafana實現較為豐富的圖表展示——可將關心的監控指標放置到Dashboard上,並且非常靈活!然而,這個配置的操作雖然不難,但還是挺費時間的……
那麼是否有配置好的又強大、又通用、拿來即用的Dashboard呢?答案是肯定的!前往 Grafana Lab – Dashboards ,輸入關鍵詞即可搜索指定Dashboard。
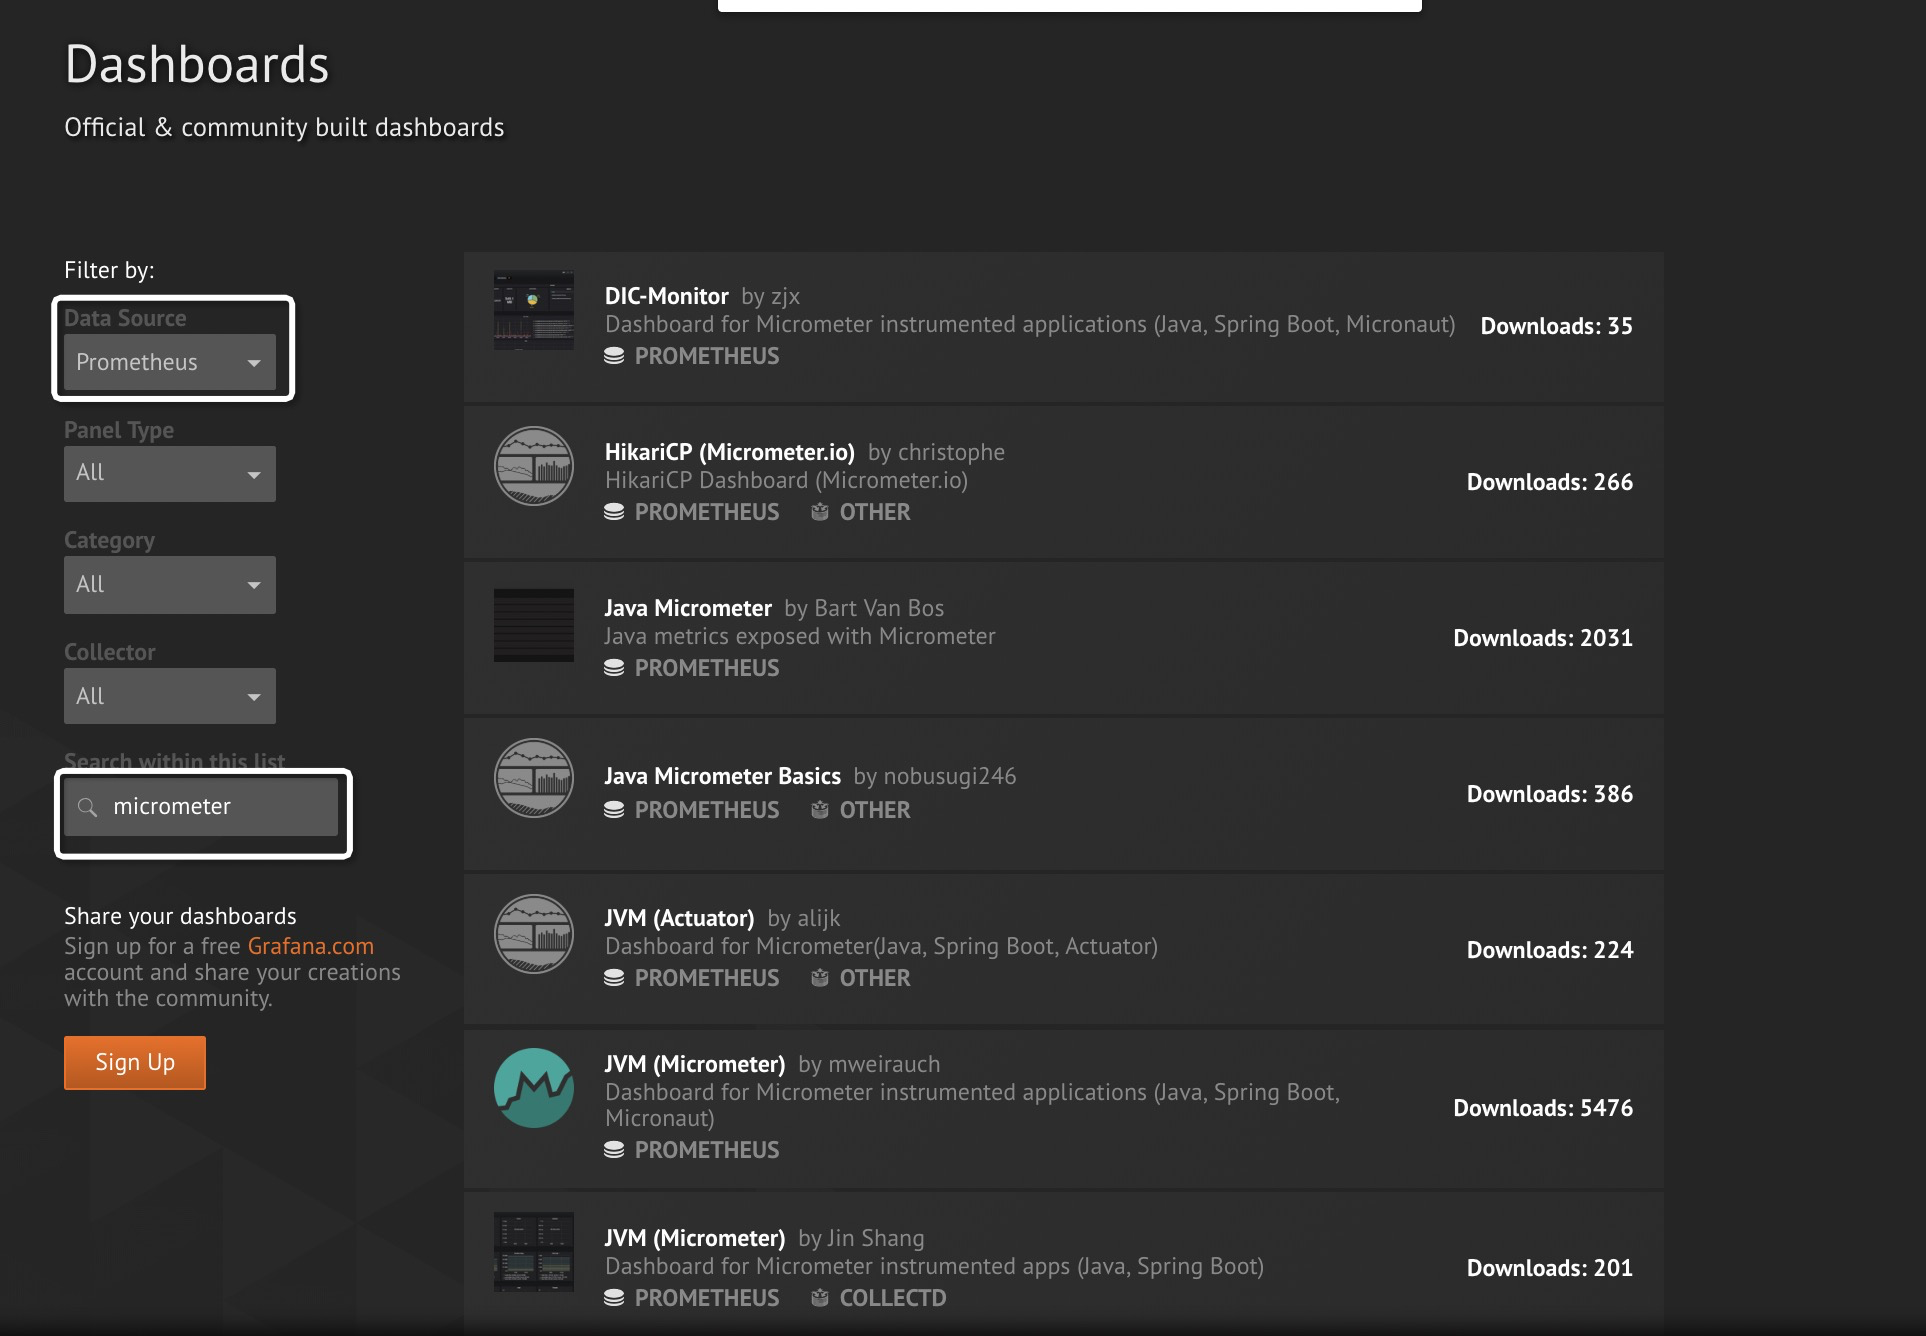
如上圖所示,可以找到若干款以 Prometheus 作為數據源,支援Micrometer的Dashboard!下面,來演示如何使用 JVM(Micrometer) 這個Dashboard。
其他Dashboard使用方式大同小異,建議使用前先點擊了解下詳情,一般Dashboard中都會有說明。
-
點擊
JVM(Micrometer)進入Dashboard詳情介紹頁,如下圖所示: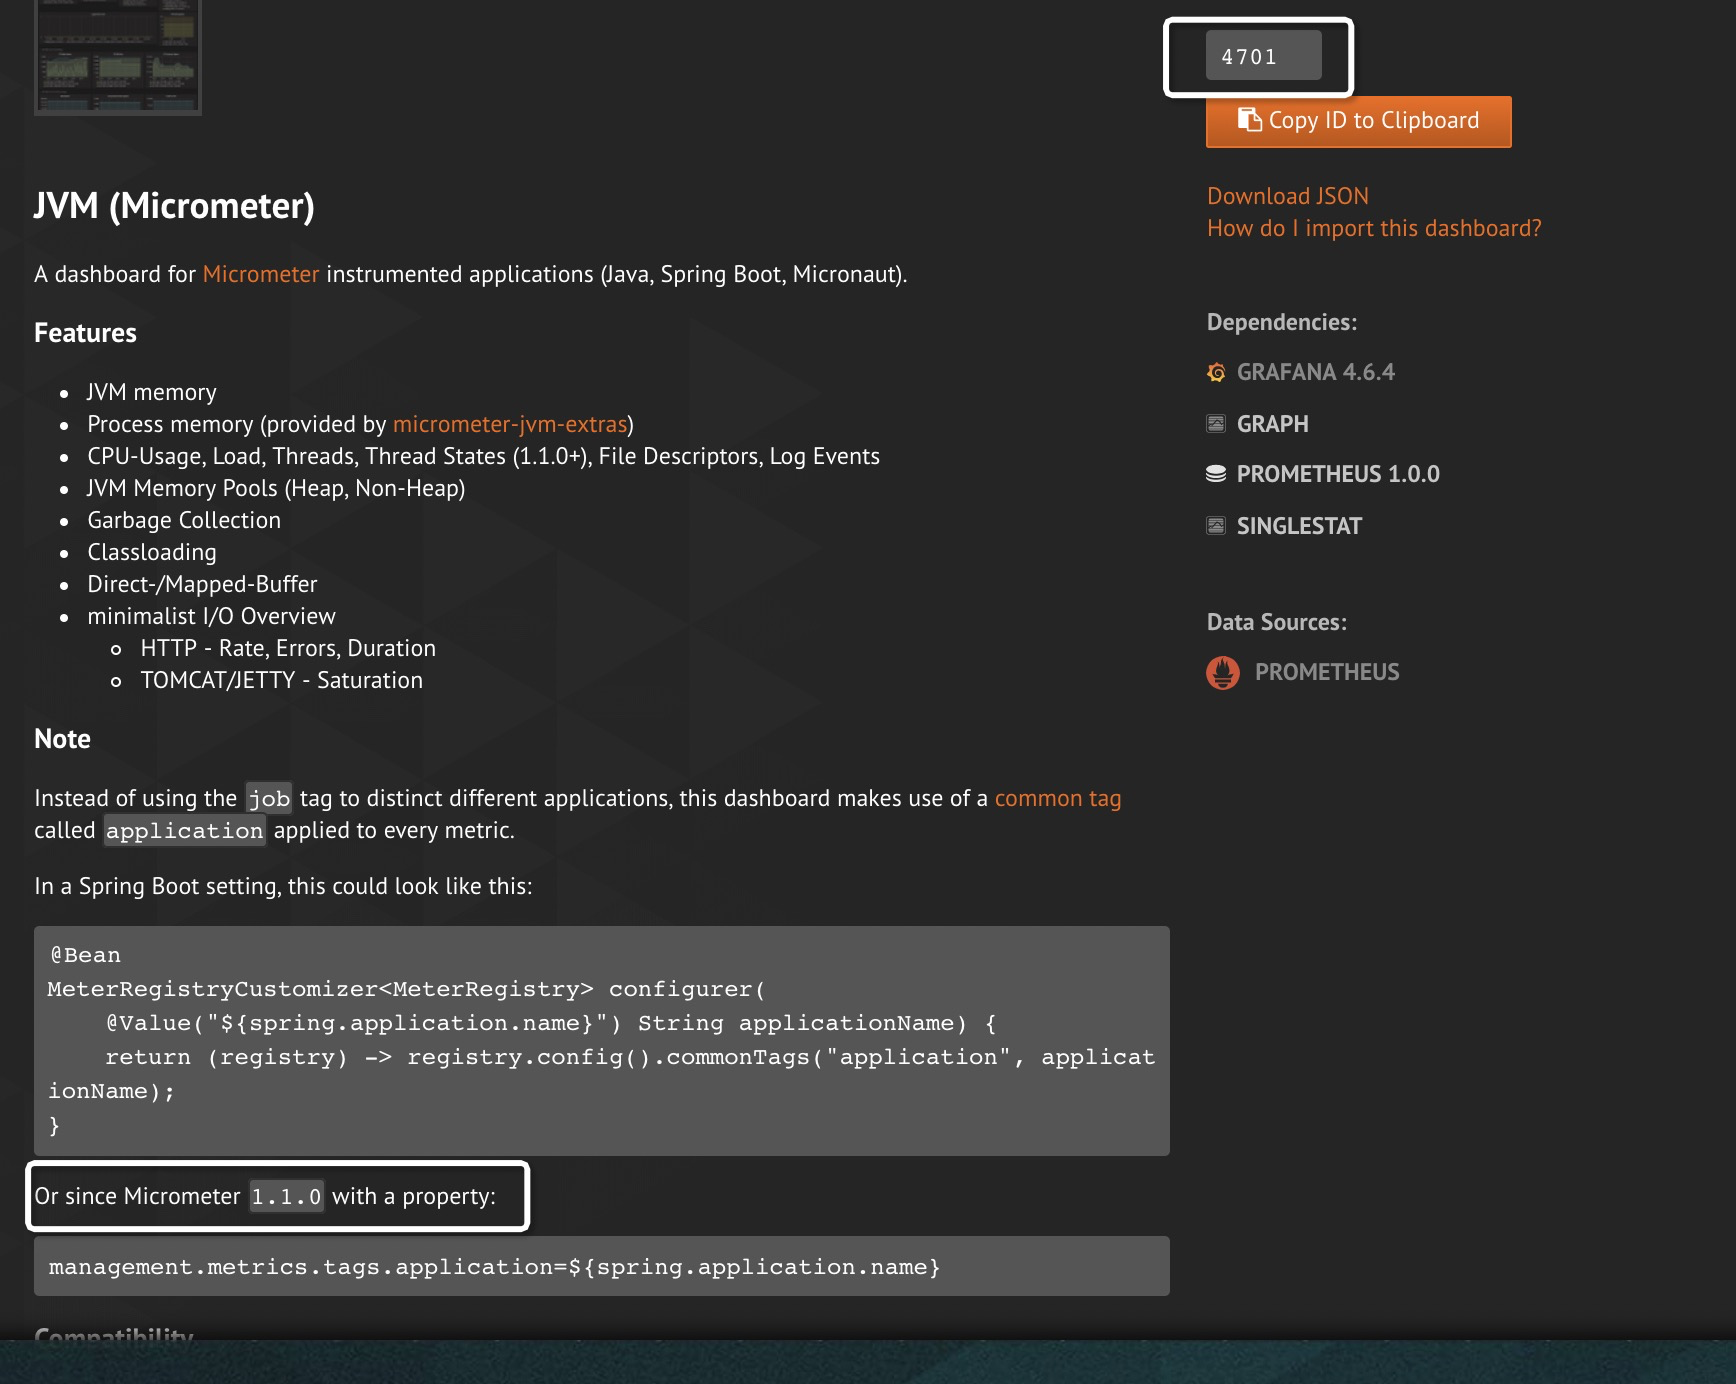
如圖已詳細描述了該Dashboard的特性、配置。其中的
management.metrics.tags.application,前面已經配置過了;本例也不打算演示Process memory特性,所以micrometer-jvm-extras怎麼用也不打算引入了(這是該Dashboard作者為Micrometer提供的增強包,有興趣的童鞋可自行點擊過去研究)。細心的童鞋會發現,該頁的右上角有個
4701這是一個非常重要的數字! -
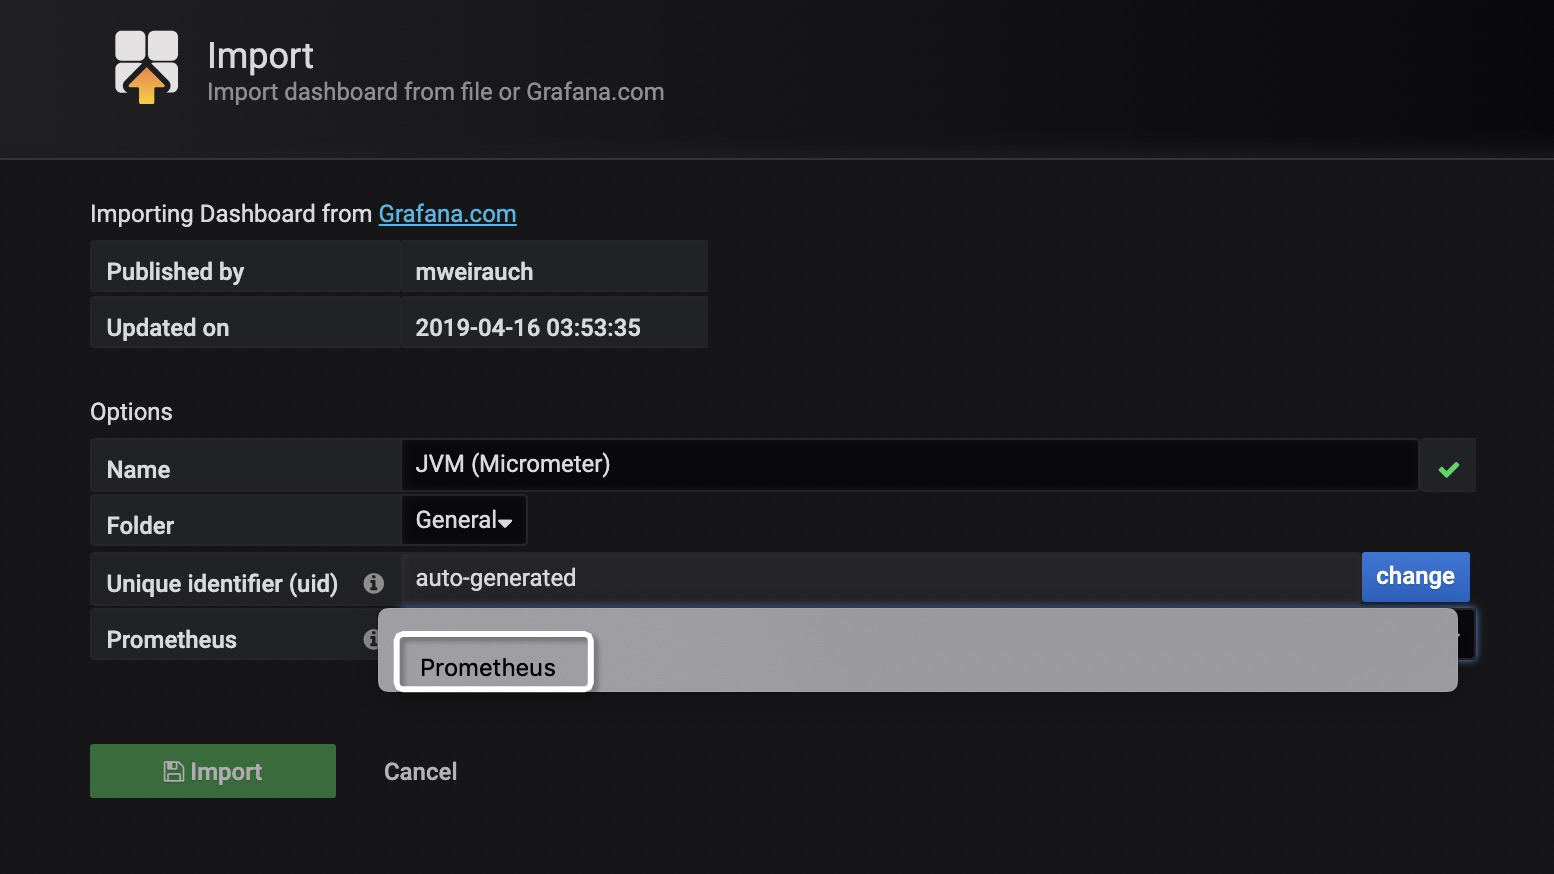
訪問
http://localhost:3000,按下圖步驟操作: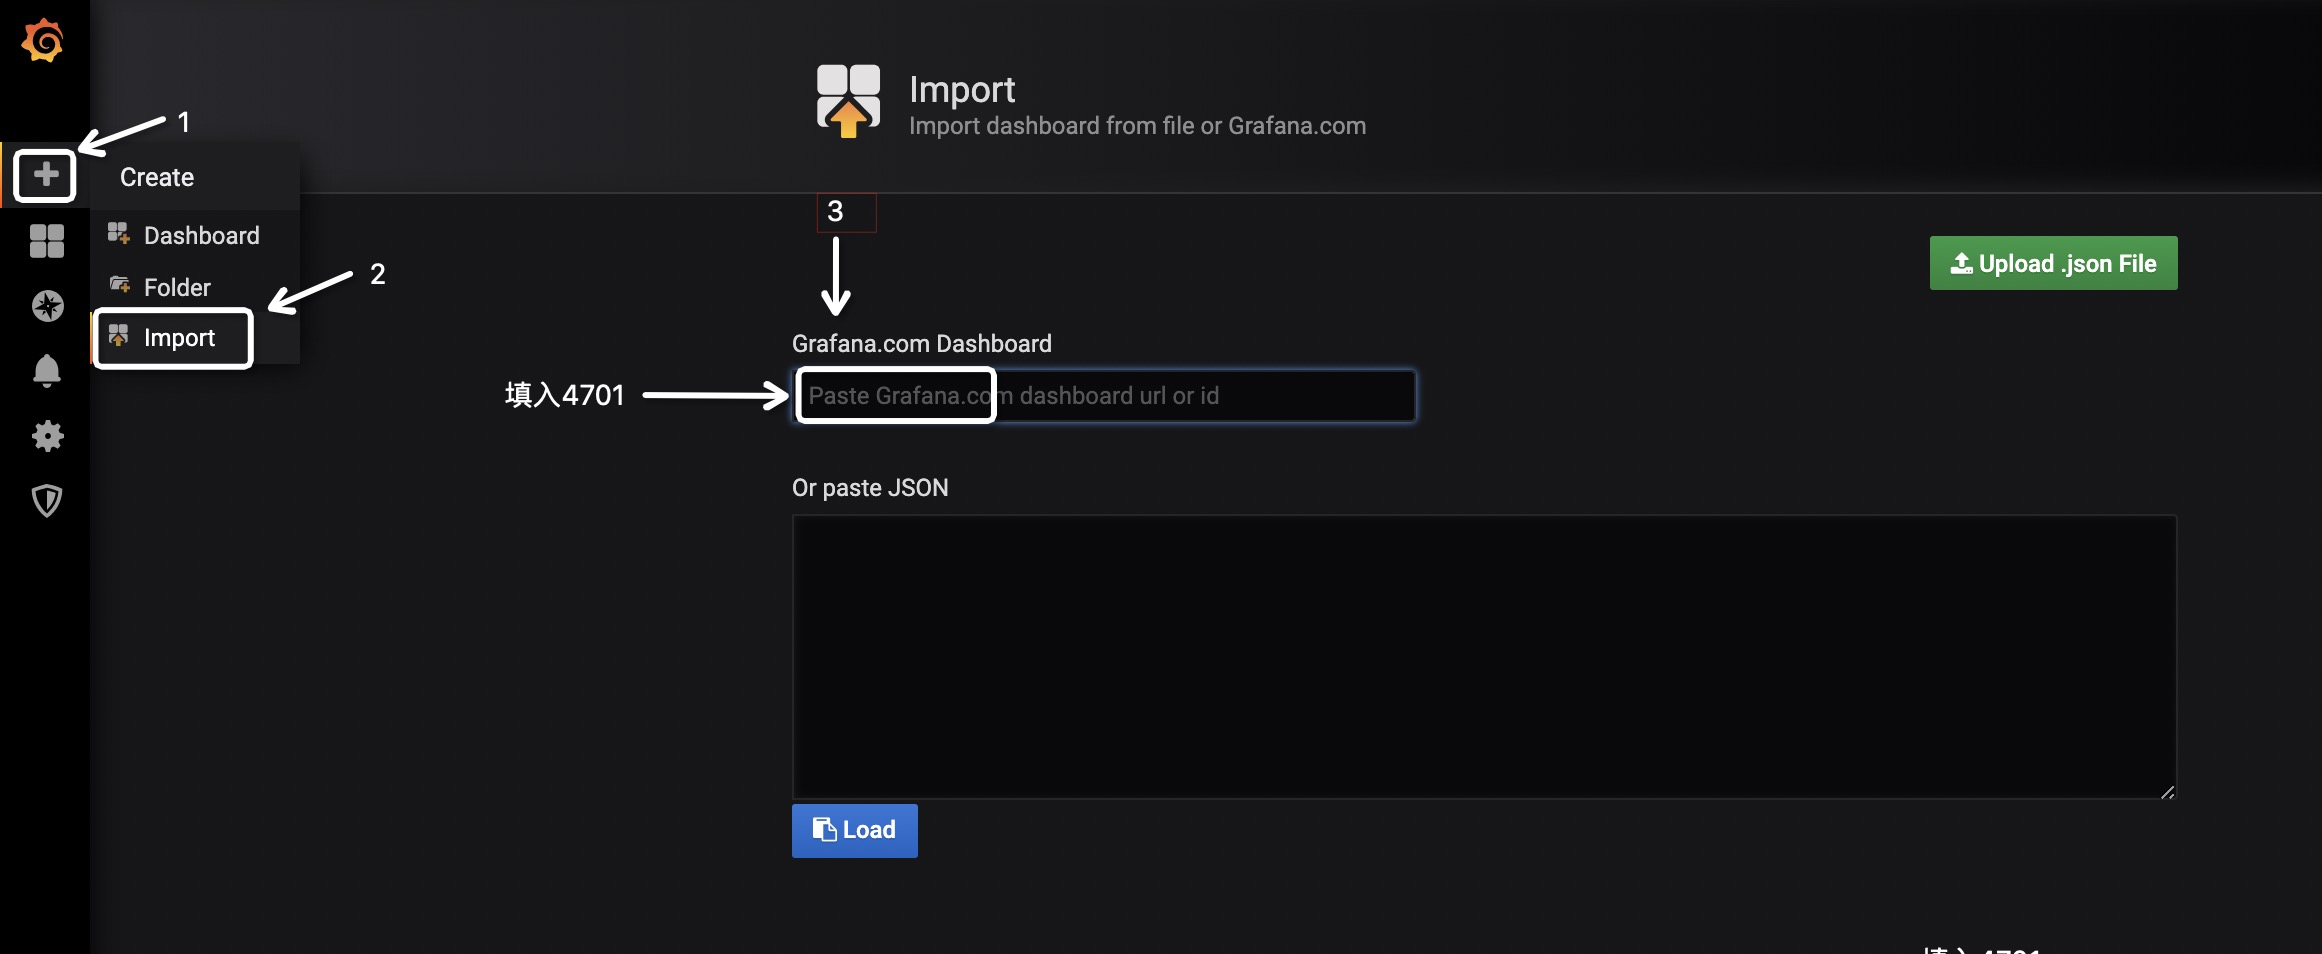
-
輸入後即可看到類似如下的介面,選擇數據源,並點擊Import。
-
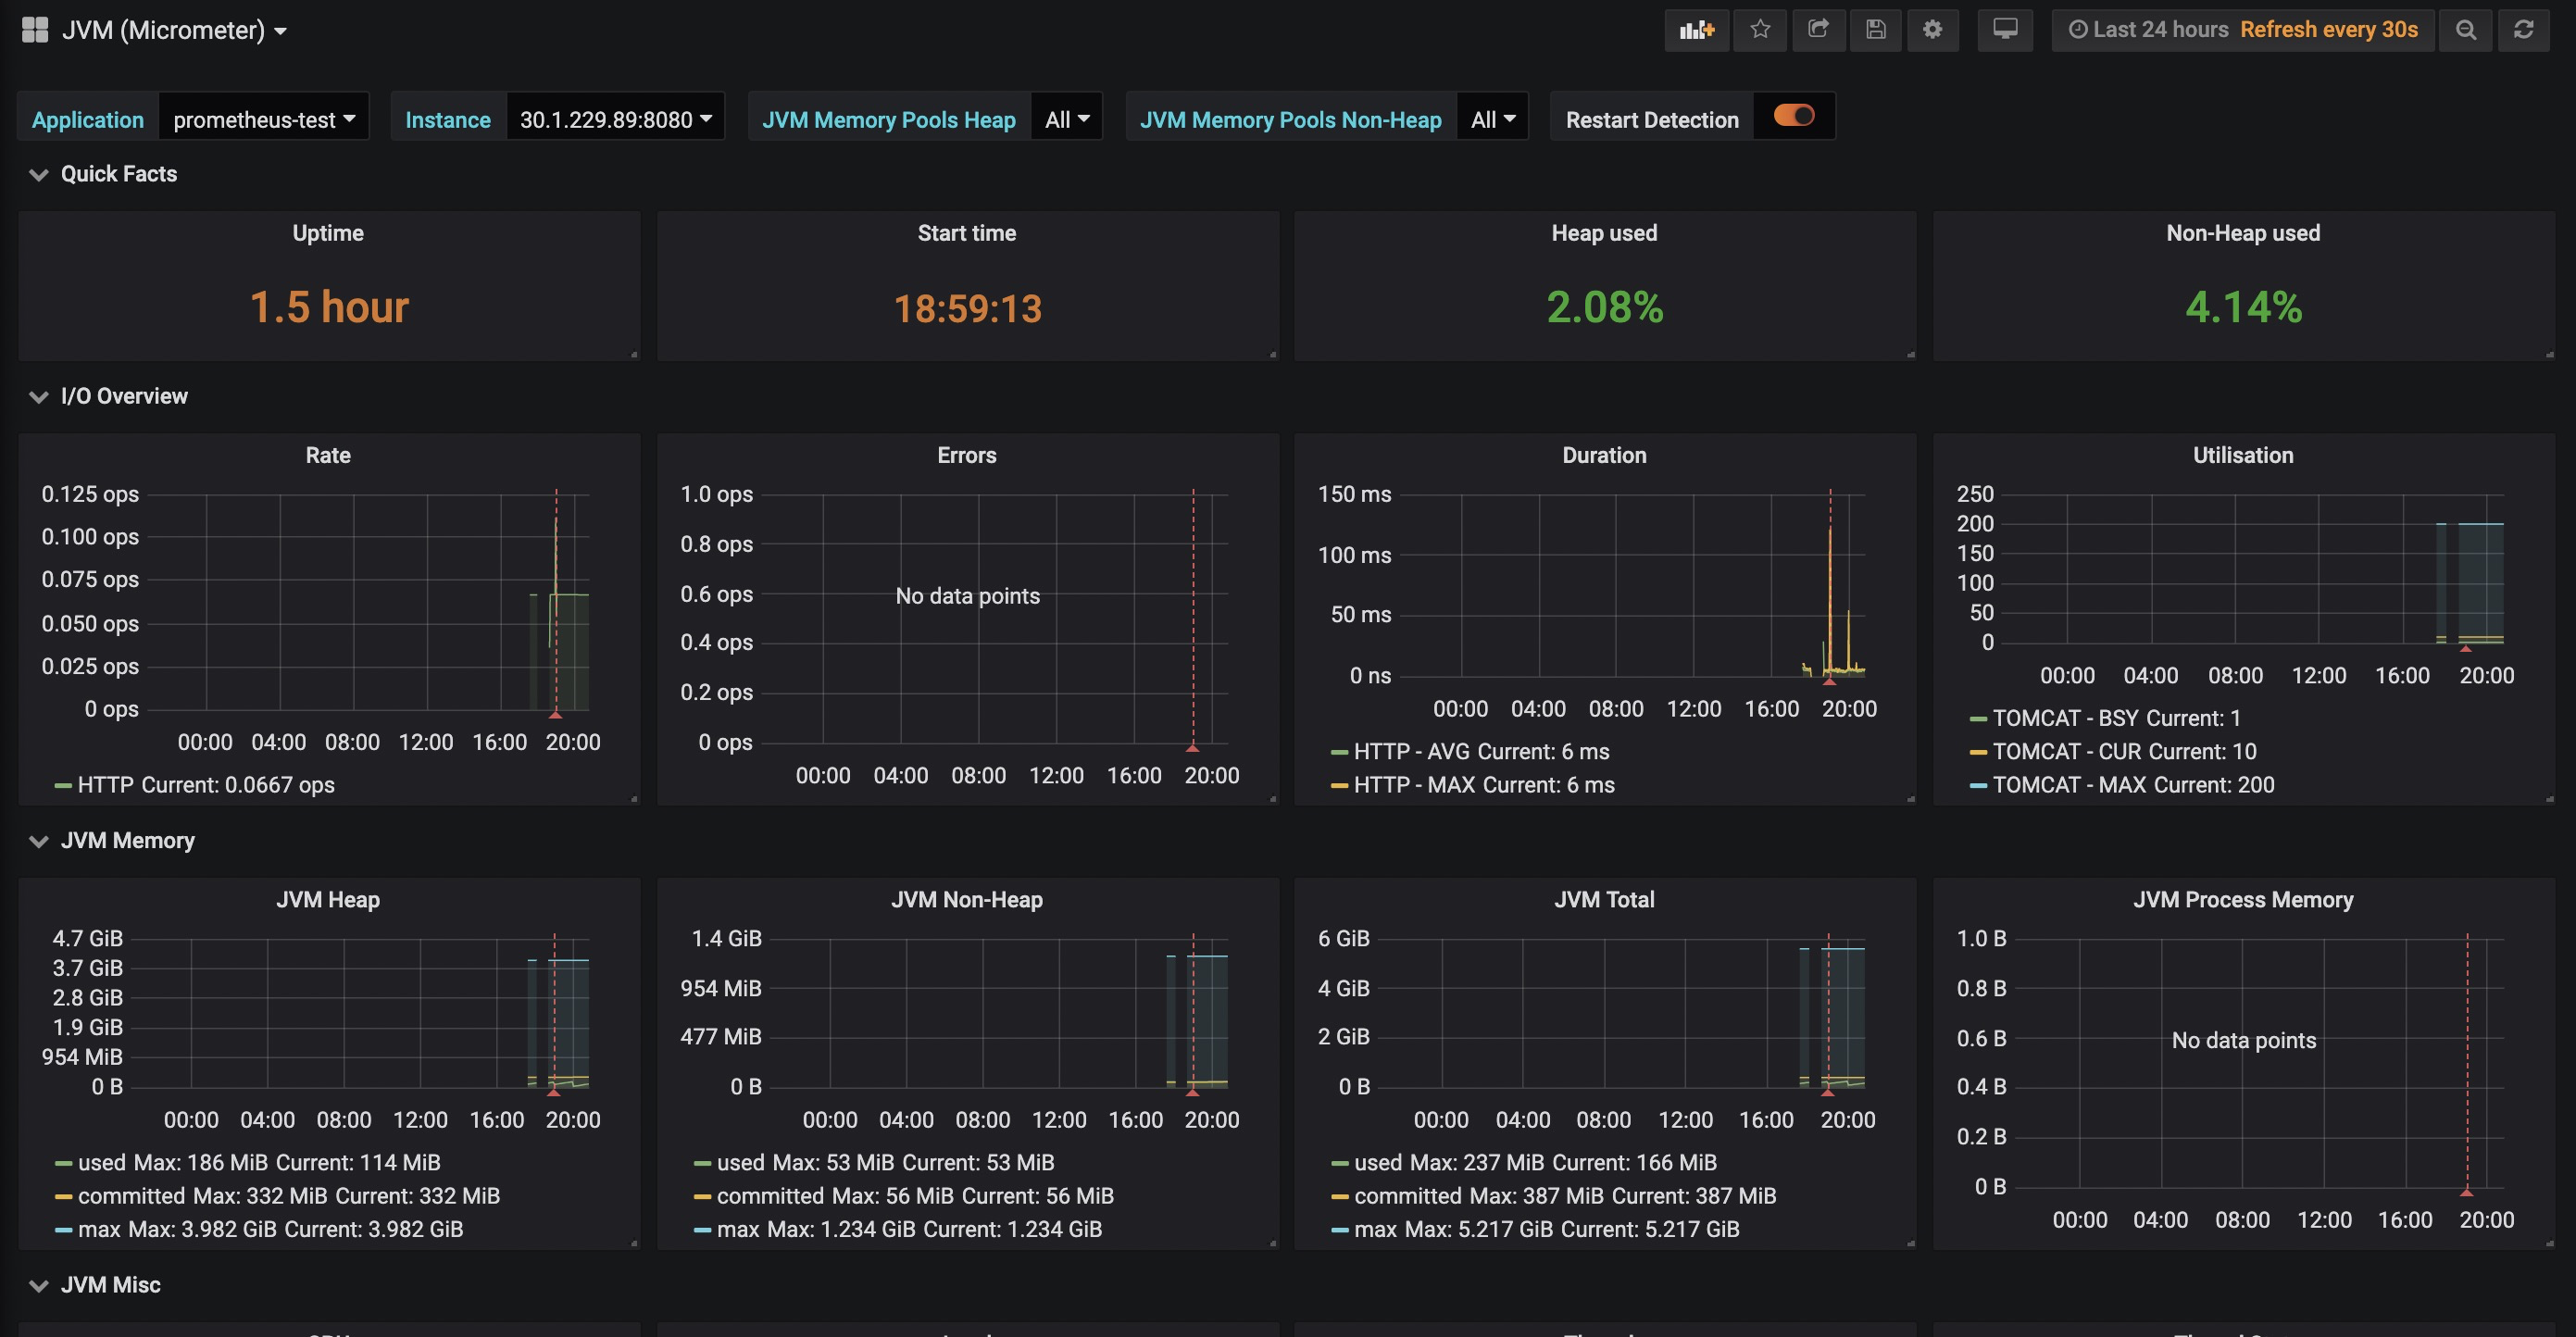
此時,即可看到類似如下的介面,如圖所示,我們常關心的指標該Dashboard均已支援!
比較好用的Dashboard
- JVM (Micrometer)
- JVM (Actuator)
- Spring Boot Statistics ,註:該Dashboard可能有Bug,筆者未能直接測試成功,做了一些改動後才能正常顯示。
以上三款是筆者親測較為全面、好用的Dashboard,僅供參考。
告警
Grafana支援的告警渠道非常豐富,例如郵件、釘釘、Slack、Webhook等,非常實用!比較簡單,各位看官自行研究下吧。
配套程式碼
其中 prometheus+grafana 目錄已提供Docker一鍵部署Prometheus + Grafana的Shell。