如何记录分析你的炼丹流程—可视化神器Wandb使用笔记【1】
- 2022 年 8 月 1 日
- 笔记
- Deep Learning, 深度学习
本节主要记录使用wandb记录训练曲线以及上传一些格式的数据将其展示在wandb中以便分析的方法,略过注册安装部分(可使用pip intall wandb安装,注册相关issue可上网搜索),文章着重于wandb的基本用法。
初始化
首先创建在wandb页面中中创建需要可视化的project,然后在代码里面只要指定好team和project,便可以把数据传输到对应的project下:

import wandb
# notes:一些文字描述实验发现或备注,也可以在wandb网页的individual experiment panel中添加
# dir:本地文件写入的路径,(环境变量WANDB_DIR或wandb.init的关键字参数dir)
run_dir = Path("../results") / all_args.project_name / all_args.experiment_name
if not run_dir.exists():
    os.makedirs(str(run_dir))
wandb.init(config=all_args,
               project=your_project_name,
               entity=your_team_name,
               notes=socket.gethostname(),
               name=all_args.experiment_name + "_" + str(all_args.seed),
               dir=run_dir,
               group=all_args.scenario_name,
               job_type="training",
               reinit=True)
基本使用
wandb的核心功能就是跟踪训练过程,展示训练流程以供我们观察展示和分析,该节以黄世宇的代码和示例图为例,说明wandb如何使用wandb.log()做到展示包括训练曲线、图片、matplotlib可视化结果、视频、表格、甚至html在内的不同结构的数据。(显示媒体文件时不需要在本地进行文件读写,可以直接用wandb的函数将展示对象处理为对应的格式就可以显示。)
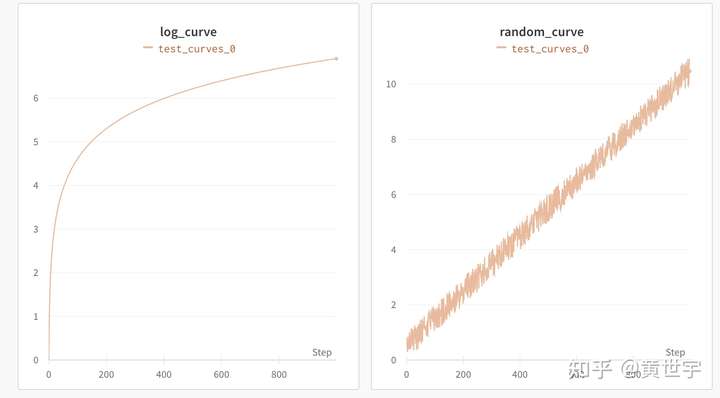
训练曲线展示
total_step_num = 1000
for step in range(total_step_num):
    wandb.log({'random_curve':step/100+random.random()},step=step)
    wandb.log({'log_curve': math.log(step+1)},step=step)
wandb.finish()
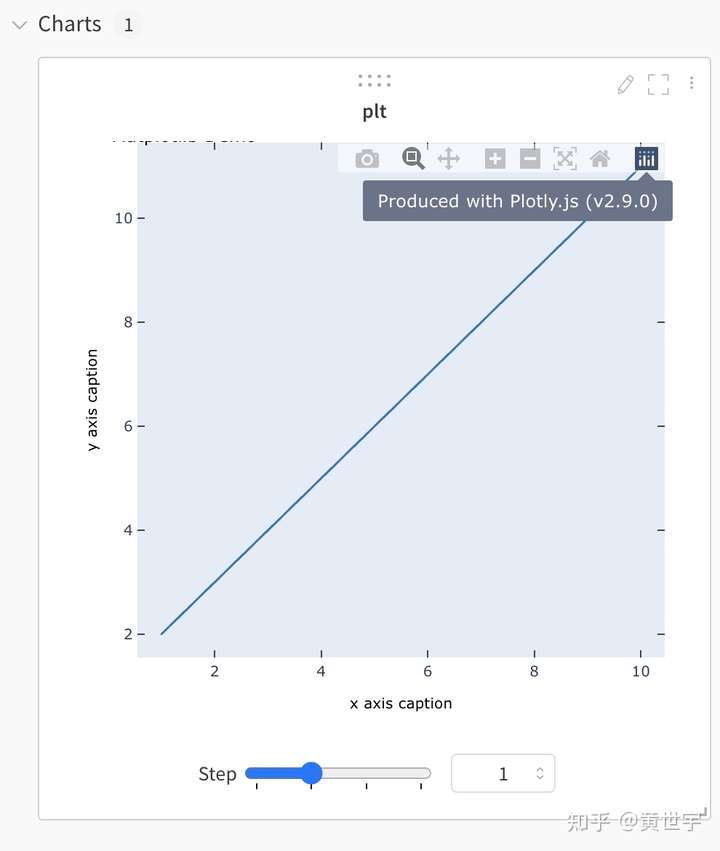
Matplotlib可视化展示
# figure就是一个图,axes表示图上的一个画图区域,一个图上可以有多个画图区域,即一个图上可以有多个子图
# 用函数gcf()与gca()分别得到当前的figure与axes。(get current figure, get current axes)
x = np.arange(1, 11)
for step in range(4):
    frames = []
    y = step * x + step
    plt.title("Matplotlib Demo")
    plt.xlabel("x axis caption")
    plt.ylabel("y axis caption")
    plt.plot(x, y)
    wandb.log({"plt":wandb.Plotly(plt.gcf())},step=step)
图片展示
env = gym.make("PongNoFrameskip-v4")
env.reset()
for step in range(4):
    frames = [] # 每个step输出一个由4张图片组成的列表
    for i in range(4):
        obs,r,done,_=env.step(env.action_space.sample())
        # wandb.Image将numpy arrays或PILImage的实例转化为PNG以供展示
        frames.append(wandb.Image(obs, caption="Pong"))
    wandb.log({"frames": frames},step=step)
    if done:
        env.reset()

视频展示
env = gym.make("PongNoFrameskip-v4")
for episode in range(3):
    env.reset()
    done = False
    frames = []
    while not done:
        for _ in range(4):
            obs,r,done,_=env.step(env.action_space.sample())
            if done:
                break
        frames.append(obs)
    sequence = np.stack(frames, -1).transpose(3,2,0,1) # time, channels, height, width
    print(sequence.shape)
    video = wandb.Video(sequence, fps=10, format="gif",caption="Pong")
    wandb.log({"video": video},step=episode)
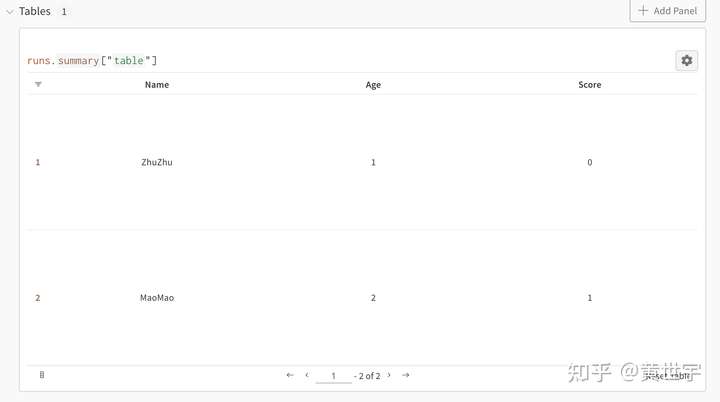
表格展示
columns = ["Name", "Age", "Score"]

data = [["ZhuZhu", 1, 0], ["MaoMao",2,1]]
table = wandb.Table(data=data, columns=columns)
wandb.log({"table": table})
wandb.finish()
展示html
html1 = wandb.Html('<a href="//tartrl.cn">TARTRL</a>')
html2 = wandb.Html(open('test.html'))
wandb.log({"html1": html1,"html2":html2})
wandb.finish()
参考
wandb使用教程(一):基础用法 – 知乎 (zhihu.com)