美賽速成(附代碼)
算法模型詳細:
一、層次分析法:
用於解決對要考慮帶有不同屬性的各個決定因素的決策問題。
如:有三個景點:桂林、蘇杭、北戴河
有五個因素:景色、費用、居住、飲食、旅途
要做出決策去哪個地方?

算法求解步驟:
1.求成對比較矩陣
(1)先求5個因素之間的成對比較矩陣
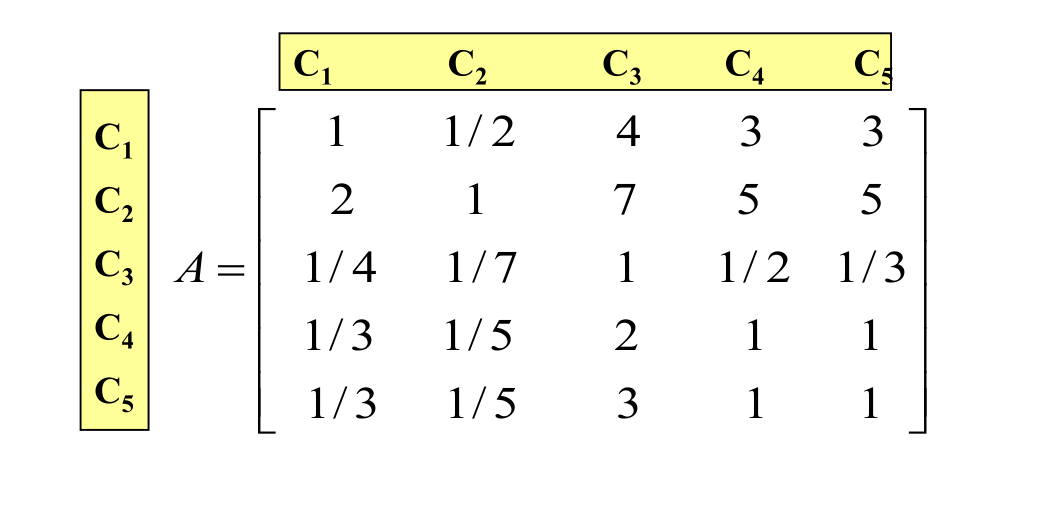
c1~c5表示5個因素,cij表示ci對cj的重要程度是多少?
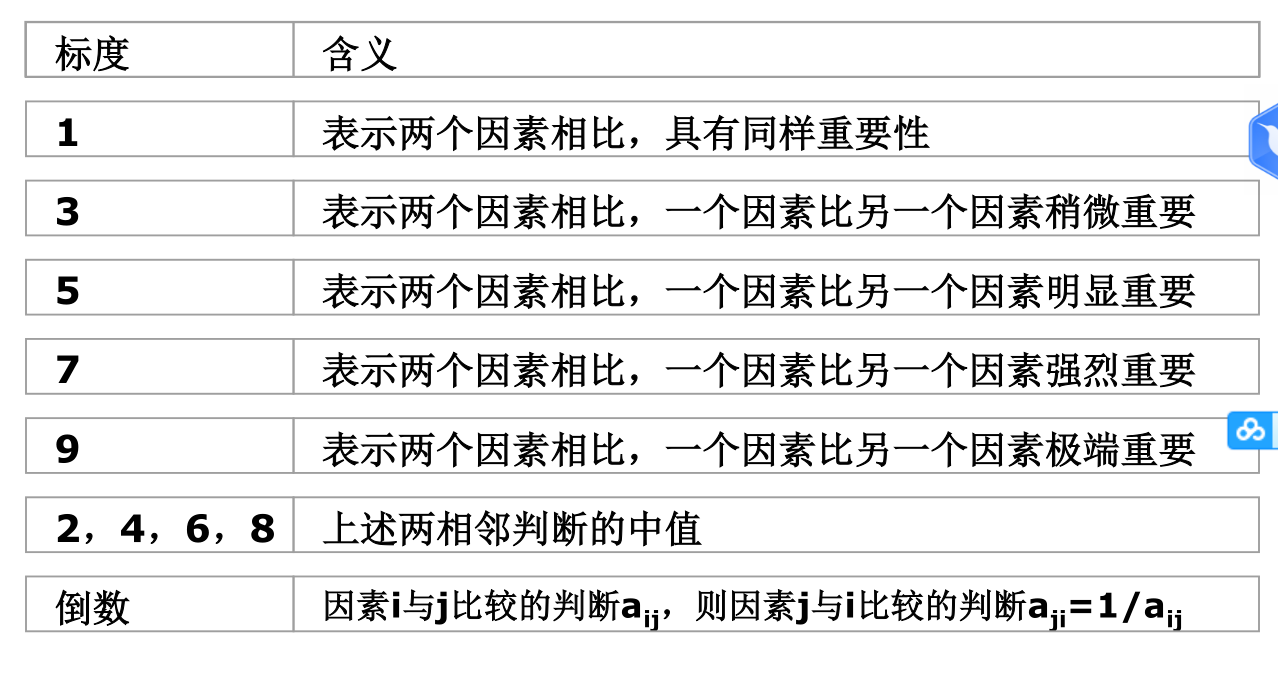
如:cij=3就是ci比cj稍微重要
(2)再求3個景點分別對於5個因素的5個成對比較矩陣
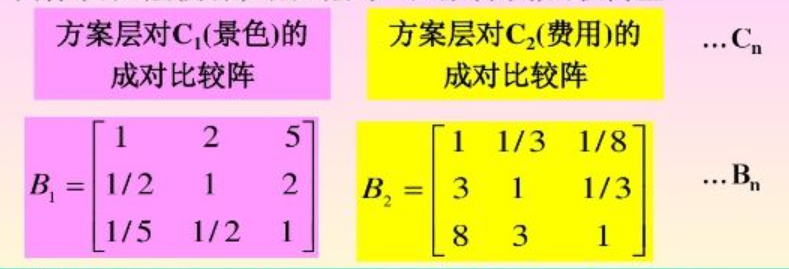
如:在因素1中,b12=3就是對於因素1(景色)來說景點1(桂林)比景點2(蘇杭)稍微好
2.分別對求出的成對比較矩陣進行求各自的權重
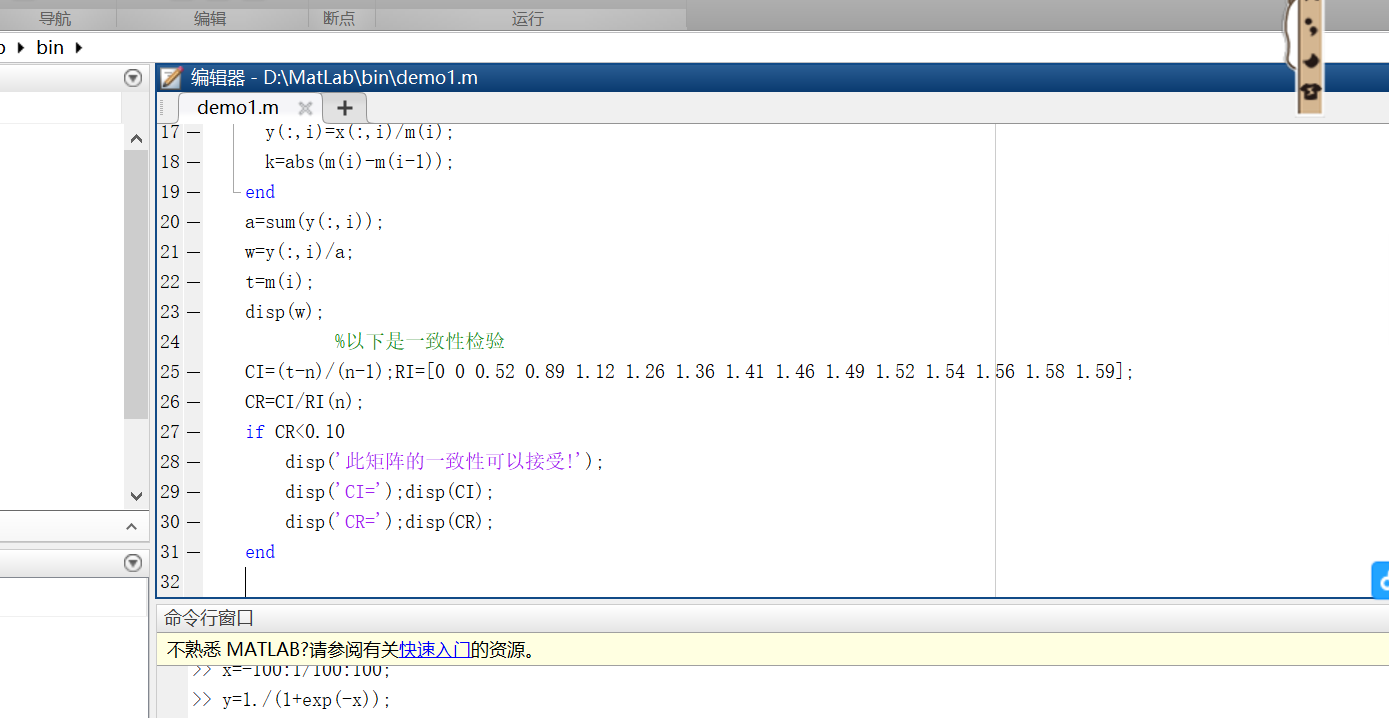
Matlab代碼:
disp('請輸入判斷矩陣A(n階)');
A=input('A=');
[n,n]=size(A);
x=ones(n,100);
y=ones(n,100);
m=zeros(1,100);
m(1)=max(x(:,1));
y(:,1)=x(:,1);
x(:,2)=A*y(:,1);
m(2)=max(x(:,2));
y(:,2)=x(:,2)/m(2);
p=0.0001;i=2;k=abs(m(2)-m(1));
while  k>p
  i=i+1;
  x(:,i)=A*y(:,i-1);
  m(i)=max(x(:,i));
  y(:,i)=x(:,i)/m(i);
  k=abs(m(i)-m(i-1));
end
a=sum(y(:,i));
w=y(:,i)/a;
t=m(i);
disp(w);
         %以下是一致性檢驗
CI=(t-n)/(n-1);RI=[0 0 0.52 0.89 1.12 1.26 1.36 1.41 1.46 1.49 1.52 1.54 1.56 1.58 1.59];
CR=CI/RI(n);
if CR<0.10
    disp('此矩陣的一致性可以接受!');
    disp('CI=');disp(CI);
    disp('CR=');disp(CR);
end
運行代碼時,將成對比較矩陣輸入即可
最後輸出各自的權重:
操作步驟:
(1)新建一個腳本文件,賦值代碼到文件里,保存成.mat文件
(2)在命令行中輸入腳本名,回車運行

(3)輸入矩陣,回車運行,得到5行數值,即對應5個因素各自的權重
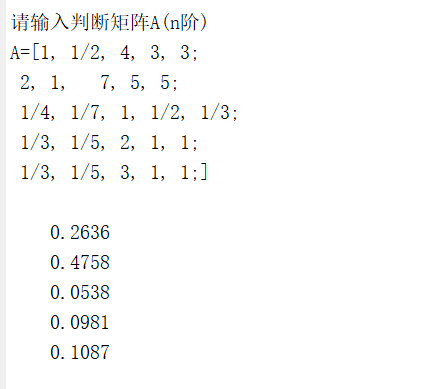
根據上述步驟求出以下的權重:
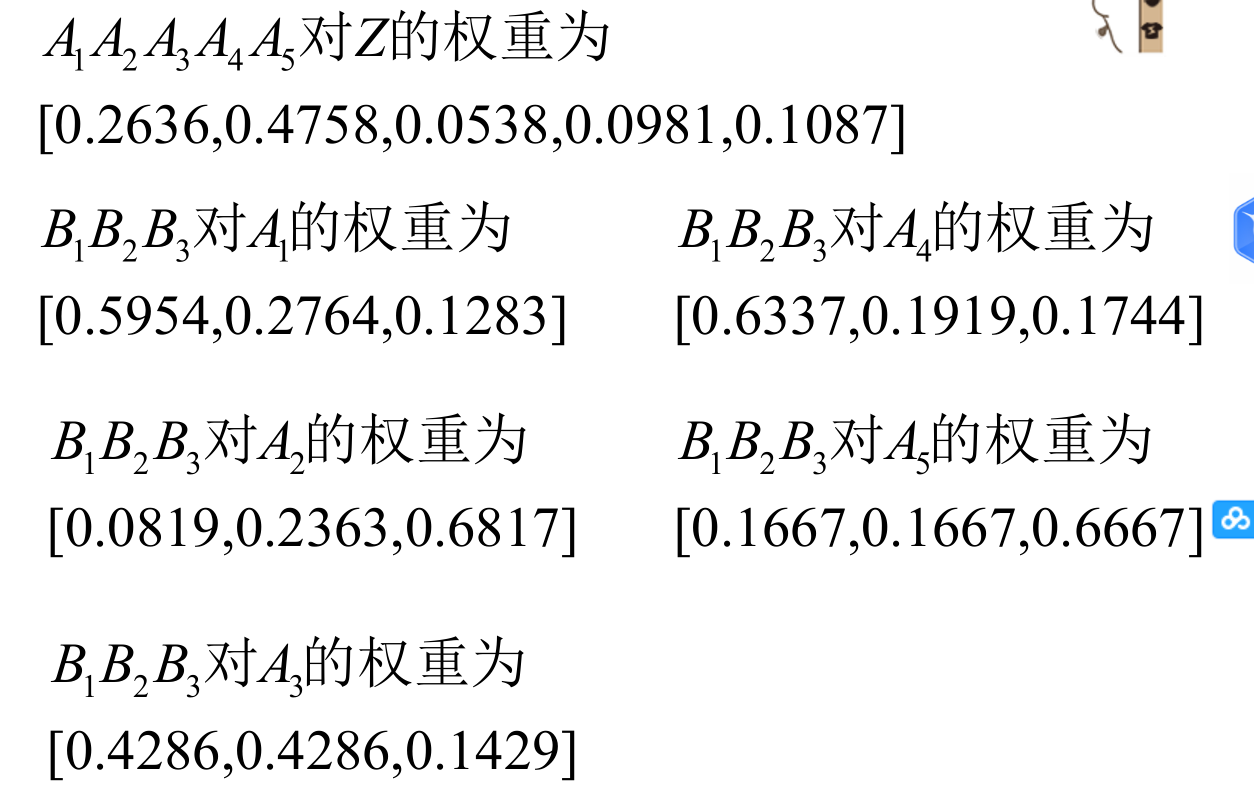
3.根據上面求出的權重求3個景點對於總目標的權值
設B1、B2、B3對A1的權值為D1,對A2的權值為D2,…
如:D1A1+D2A2+…+D5*A5就是景點1對總目標的權值
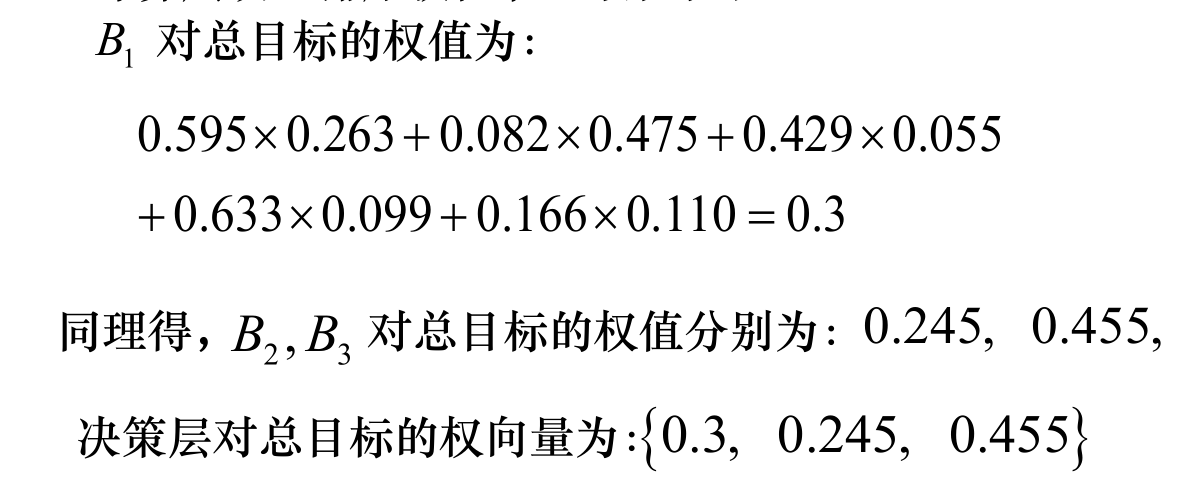
求出3個景點對總目標的權值後,最大權值的方案就是最優方案
所以選景點3
二、多屬性決策模型
是利用已有的決策信息通過一定的方式對一組(有限個) 備選方案進行排序或擇優。
在介紹多屬性決策模型之間,我們先來介紹一下歸一化:
歸一化:
若有一組數據[a1,a2,a3,a4]
如果這些數據是有益的(如:收入、盈利等),則歸一化之後的數據為[a1/max(a),a2/max(a),a3/max(a),a4/max(a4)]
如果這些數據是有害的(如:虧損、丟失等),則歸一化之後的數據為[min(a)/a1,min(a)/a2,min(a)/a3,min(a)/a4]
下面開始介紹多屬性決策模型:
1.先用已有數據進行實例化
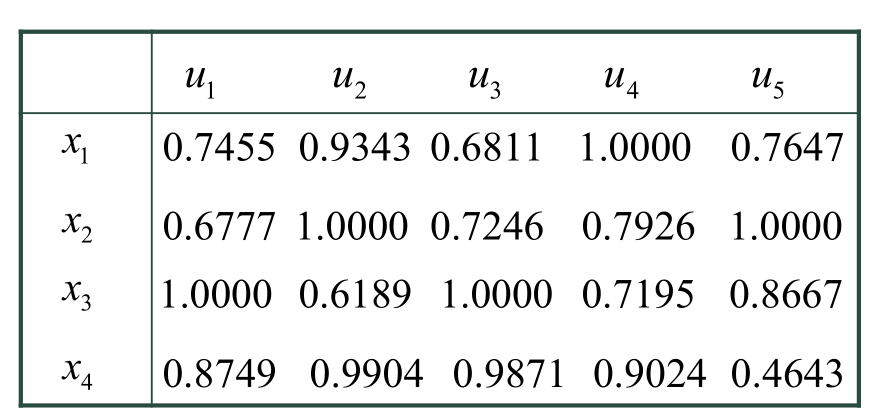
例如:投資銀行擬對某市4家企業(方案) 進行投資,抽取下列5項指標(屬性)進行評估:
—產值(萬元);
—投資成本(萬元);
—銷售額(萬元);
—國家收益比重;
—環境圬染程度。
用給定的數據實例化:
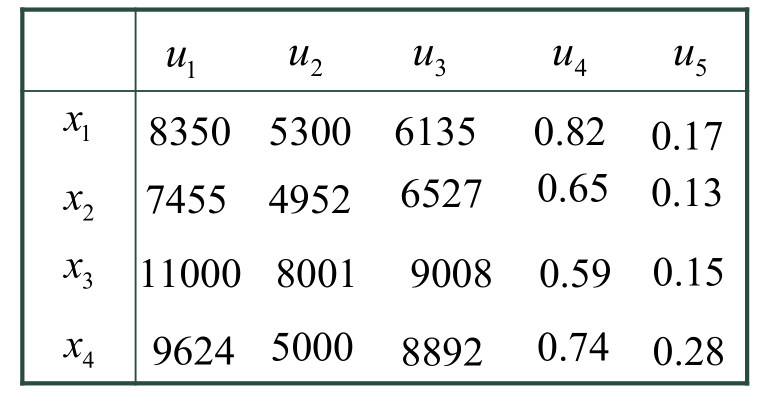
x1x4:4所公司,u1u5:5個因素
表示每所公司對每個因素的實際值
2.將上面得到的值進行歸一化
3.用層次分析法中的方法求5個因素組成的成對分析矩陣
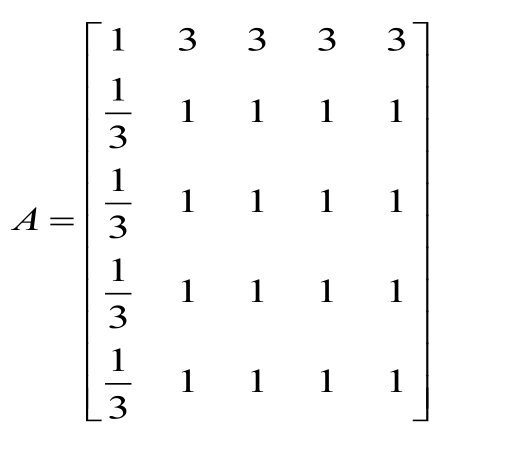
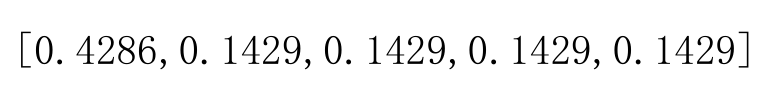
4.求出成對分析矩陣的各個因素的權值
5.求待決策量對總目標的權值
具體方法就不說了,大家看圖吧,waa就是最後的權重
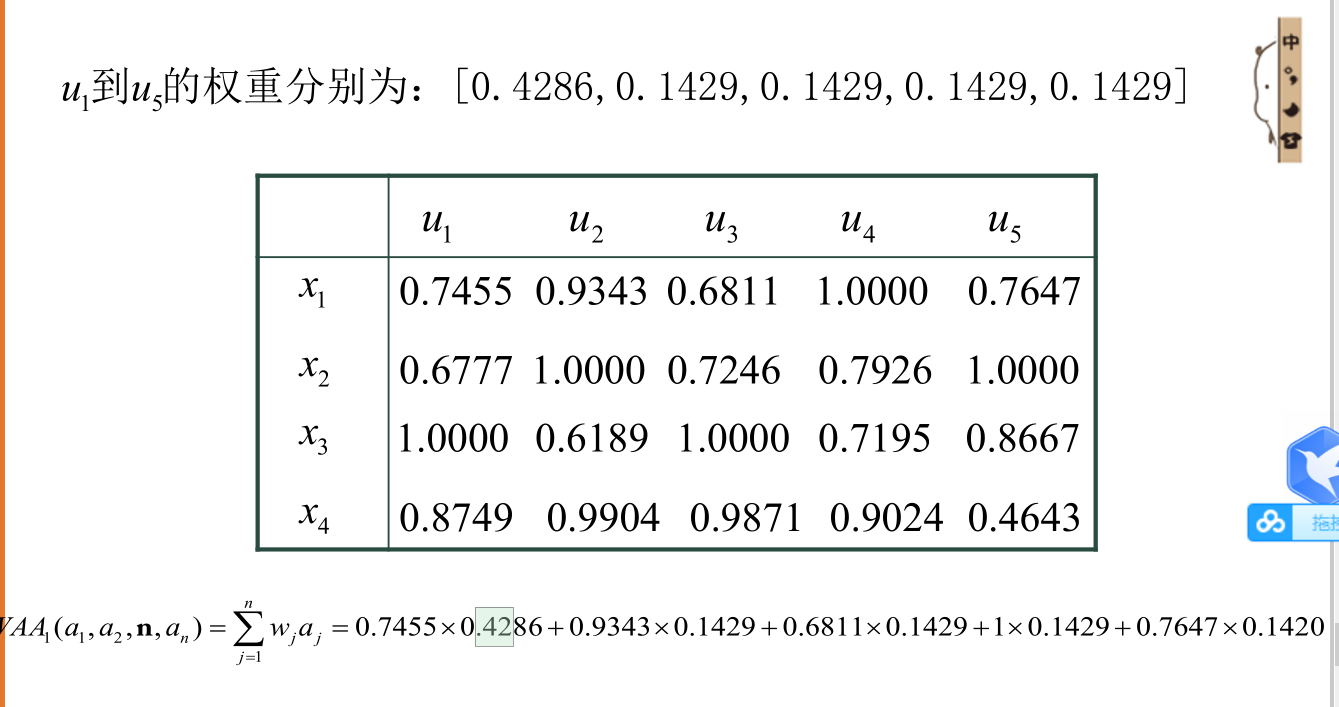
求出4個企業的權值
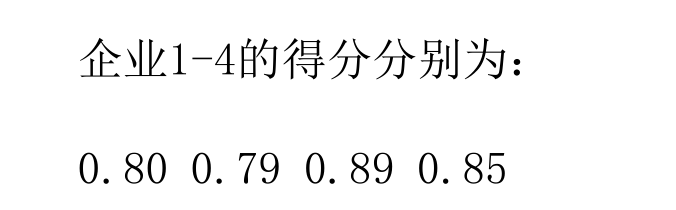
所以選企業3
三、灰色預測模型
這個就是一個曲線擬合再預測的模型
這個原理就不說了,直接上代碼吧
function []=greymodel(y)
% 本程序主要用來計算根據灰色理論建立的模型的預測值。
% 應用的數學模型是 GM(1,1)。
% 原始數據的處理方法是一次累加法。
y=input('請輸入數據 ');
n=length(y);
yy=ones(n,1);
yy(1)=y(1);
for i=2:n
    yy(i)=yy(i-1)+y(i);
end
B=ones(n-1,2);
for i=1:(n-1)
    B(i,1)=-(yy(i)+yy(i+1))/2;
    B(i,2)=1;
end
BT=B';
for j=1:n-1
    YN(j)=y(j+1);
end
YN=YN';
A=inv(BT*B)*BT*YN;
a=A(1);
u=A(2);
t=u/a;
i=1:n+2;
yys(i+1)=(y(1)-t).*exp(-a.*i)+t;
yys(1)=y(1);
for j=n+2:-1:2
    ys(j)=yys(j)-yys(j-1);
end
x=1:n;
xs=2:n+2;
yn=ys(2:n+2);
plot(x,y,'^r',xs,yn,'*-b');
det=0;

sum1=0;
sumpe=0;
for i=1:n
    sumpe=sumpe+y(i);
end
pe=sumpe/n;
for i=1:n;
    sum1=sum1+(y(i)-pe).^2;
end
s1=sqrt(sum1/n);
sumce=0;
for i=2:n
    sumce=sumce+(y(i)-yn(i));
end
ce=sumce/(n-1);
sum2=0;
for i=2:n;
    sum2=sum2+(y(i)-yn(i)-ce).^2;
end
s2=sqrt(sum2/(n-1));
c=(s2)/(s1);
disp(['後驗差比值為:',num2str(c)]);
if c<0.35
    disp('系統預測精度好')
else if c<0.5
        disp('系統預測精度合格')
    else if c<0.65
            disp('系統預測精度勉強')
        else
            disp('系統預測精度不合格')
        end
    end
end

disp(['下個擬合值為 ',num2str(ys(n+1))]);
disp(['再下個擬合值為',num2str(ys(n+2))]);
直接輸入一個矩陣,如:[1,2,3,4,5,6]
程序直接輸入一個擬合好的圖,還有下一個和再下一個的擬合值
四、dijkstra
這個相信大家都比較熟悉,就是一個求起點與終點距離最近的算法
原理也不說了,直接上代碼:
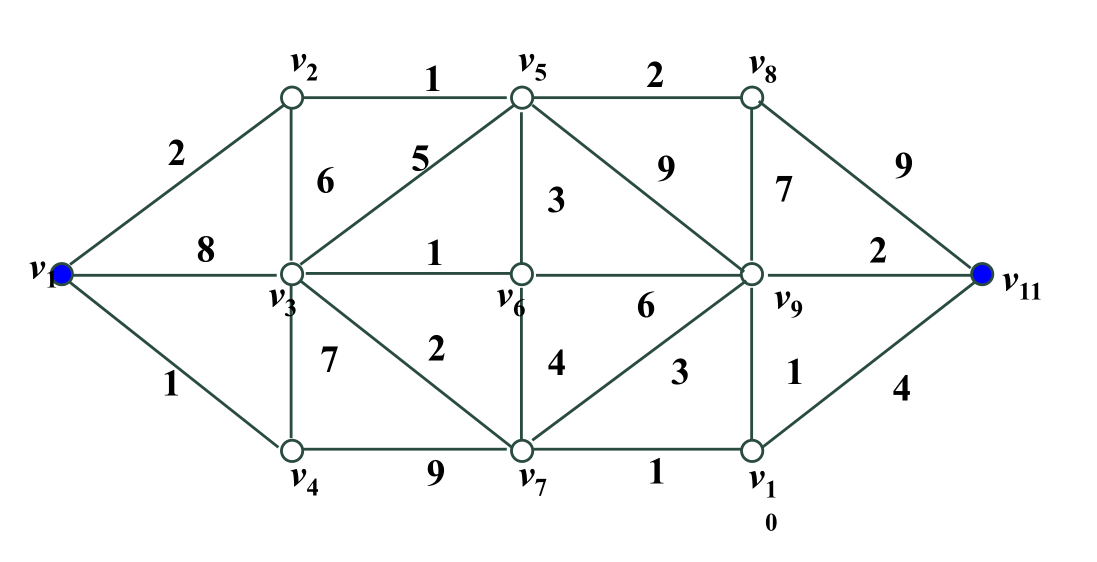
tulun1.m
weight=    [0     2     8     1   Inf   Inf   Inf   Inf   Inf   Inf   Inf;
            2     0     6   Inf     1   Inf   Inf   Inf   Inf   Inf   Inf;
            8     6     0     7     5     1     2   Inf   Inf   Inf   Inf;
            1   Inf     7     0   Inf   Inf     9   Inf   Inf   Inf   Inf;
          Inf     1     5   Inf     0     3   Inf     2     9   Inf   Inf;
          Inf   Inf     1   Inf     3     0     4   Inf     6   Inf   Inf;
          Inf   Inf     2     9   Inf     4     0   Inf     3     1   Inf;
          Inf   Inf   Inf   Inf     2   Inf   Inf     0     7   Inf     9;
          Inf   Inf   Inf   Inf     9     6     3     7     0     1     2;
          Inf   Inf   Inf   Inf   Inf   Inf     1   Inf     1     0     4;
          Inf   Inf   Inf   Inf   Inf   Inf   Inf     9     2     4     0;];
[dis, path]=dijkstra(weight,1, 11)


dijkstra.m
function [min,path]=dijkstra(w,start,terminal)
n=size(w,1); label(start)=0; f(start)=start;
for i=1:n
   if i~=start
       label(i)=inf;
end, end
s(1)=start; u=start;
while length(s)<n
   for i=1:n
      ins=0;
      for j=1:length(s)
         if i==s(j)
            ins=1;
         end,
      end
      if ins==0
         v=i;
         if label(v)>(label(u)+w(u,v))
            label(v)=(label(u)+w(u,v));
         f(v)=u;
         end,
      end,
   end
v1=0;
   k=inf;
   for i=1:n
         ins=0;
         for j=1:length(s)
            if i==s(j)
               ins=1;
            end,
         end
         if ins==0
            v=i;
            if k>label(v)
               k=label(v);  v1=v;
            end,
         end,
   end
   s(length(s)+1)=v1;
   u=v1;
end
min=label(terminal); path(1)=terminal;
i=1;
while path(i)~=start
      path(i+1)=f(path(i));
      i=i+1 ;
end
path(i)=start;
L=length(path);
path=path(L:-1:1);
注意幾個不同的代碼塊要寫在不同的腳本中
輸入時直接輸入矩陣:
D=
[0 2 8 1 Inf Inf Inf Inf Inf Inf Inf;
2 0 6 Inf 1 Inf Inf Inf Inf Inf Inf;
8 6 0 7 5 1 2 Inf Inf Inf Inf;
1 Inf 7 0 Inf Inf 9 Inf Inf Inf Inf;
Inf 1 5 Inf 0 3 Inf 2 9 Inf Inf;
Inf Inf 1 Inf 3 0 4 Inf 6 Inf Inf;
Inf Inf 2 9 Inf 4 0 Inf 3 1 Inf;
Inf Inf Inf Inf 2 Inf Inf 0 7 Inf 9;
Inf Inf Inf Inf 9 6 3 7 0 1 2;
Inf Inf Inf Inf Inf Inf 1 Inf 1 0 4;
Inf Inf Inf Inf Inf Inf Inf 9 2 4 0;]
Dij不等於Inf時,Dij裏面的值就是i到j的距離
五、模擬退火算法
求TSP問題:
旅行商問題,即TSP 問題(Travelling SalesmanProblem )又譯為旅行推銷員問題、貨郎擔問題,是數學領域中著名問題之一。假設有一個旅行商人要拜訪n 個城市,他必須選擇所要走的路徑,路徑的限制是每個城市只能拜訪一次,而且最後要回到原來出發的城市。路徑的選擇目標是要求得的路徑路程為所有路徑之中的最小值。迄今為止,這類問題中沒有一個找到有效算法。傾向於接受NP 完全問題(NP-Complet 或NPC )和NP 難題(NP-Hard 或NPH )不存在有效算法這一猜想,認為這類問題的大型實例不能用精確算法求解,必須尋求這類問題的有效的近似算法。
直接上代碼:
swap.m
function [ newpath , position ] = swap( oldpath , number )
% 對 oldpath 進 行 互 換 操 作
% number 為 產 生 的 新 路 徑 的 個 數
% position 為 對 應 newpath 互 換 的 位 置
m = length( oldpath ) ; % 城 市 的 個 數
newpath = zeros( number , m ) ;
position = sort( randi( m , number , 2 ) , 2 ); % 隨 機 產 生 交 換 的 位 置
for i = 1 : number
newpath( i , : ) = oldpath ;
% 交 換 路 徑 中 選 中 的 城 市
newpath( i , position( i , 1 ) ) = oldpath( position( i , 2 ) ) ;
newpath( i , position( i , 2 ) ) = oldpath( position( i , 1 ) ) ;
end
pathfare.m
function [ objval ] = pathfare( fare , path )
% 計 算 路 徑 path 的 代 價 objval
% path 為 1 到 n 的 排 列 ,代 表 城 市 的 訪 問 順 序 ;
% fare 為 代 價 矩 陣 , 且 為 方 陣 。
[ m , n ] = size( path ) ;
objval = zeros( 1 , m ) ;
for i = 1 : m
for j = 2 : n
objval( i ) = objval( i ) + fare( path( i , j - 1 ) , path( i , j ) ) ;
end
objval( i ) = objval( i ) + fare( path( i , n ) , path( i , 1 ) ) ;
end
distance.m
function [ fare ] = distance( coord )
% 根 據 各 城 市 的 距 離 坐 標 求 相 互 之 間 的 距 離
% fare 為 各 城 市 的 距 離 , coord 為 各 城 市 的 坐 標
[ v , m ] = size( coord ) ; % m 為 城 市 的 個 數
fare = zeros( m ) ;
for i = 1 : m % 外 層 為 行
for j = i : m % 內 層 為 列
fare( i , j ) = ( sum( ( coord( : , i ) - coord( : , j ) ) .^ 2 ) ) ^ 0.5 ;
fare( j , i ) = fare( i , j ) ; % 距 離 矩 陣 對 稱
end
end
myplot.m
function [ ] = myplot( path , coord , pathfar )
% 做 出 路 徑 的 圖 形
% path 為 要 做 圖 的 路 徑 ,coord 為 各 個 城 市 的 坐 標
% pathfar 為 路 徑 path 對 應 的 費 用
len = length( path ) ;
clf ;
hold on ;
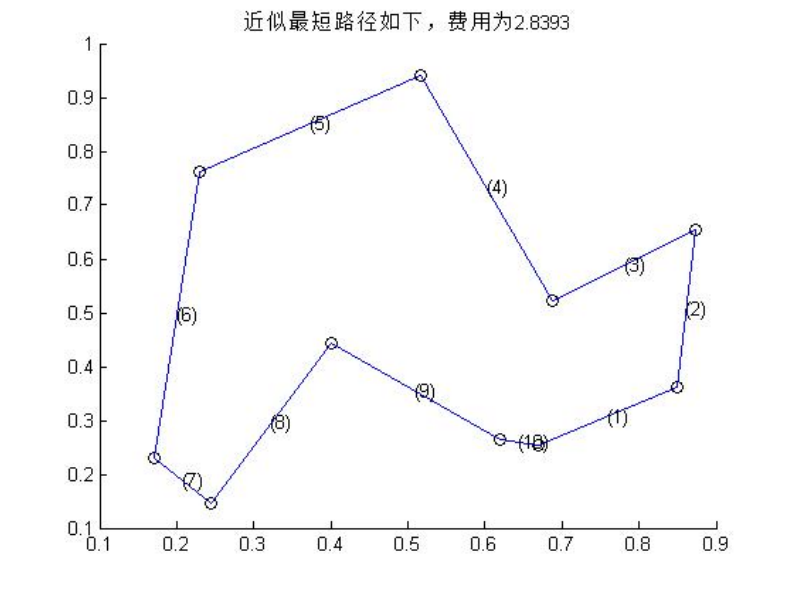
title( [ '近似最短路徑如下,路程為' , num2str( pathfar ) ] ) ;
plot( coord( 1 , : ) , coord( 2 , : ) , 'ok');
pause( 0.4 ) ;
for ii = 2 : len
plot( coord( 1 , path( [ ii - 1 , ii ] ) ) , coord( 2 , path( [ ii - 1 , ii ] ) ) , '-b');
x = sum( coord( 1 , path( [ ii - 1 , ii ] ) ) ) / 2 ;
y = sum( coord( 2 , path( [ ii - 1 , ii ] ) ) ) / 2 ;
text( x , y , [ '(' , num2str( ii - 1 ) , ')' ] ) ;
pause( 0.4 ) ;
end
plot( coord( 1 , path( [ 1 , len ] ) ) , coord( 2 , path( [ 1 , len ] ) ) , '-b' ) ;
x = sum( coord( 1 , path( [ 1 , len ] ) ) ) / 2 ;
y = sum( coord( 2 , path( [ 1 , len ] ) ) ) / 2 ;
text( x , y , [ '(' , num2str( len ) , ')' ] ) ;
pause( 0.4 ) ;
hold off ;
clear;
% 程 序 參 數 設 定
Coord = ... % 城 市 的 坐 標 Coordinates
[ 0.6683 0.6195 0.4 0.2439 0.1707 0.2293 0.5171 0.8732 0.6878 0.8488 ; ...
0.2536 0.2634 0.4439 0.1463 0.2293 0.761 0.9414 0.6536 0.5219 0.3609 ] ;
t0 = 1 ; % 初 溫 t0
iLk = 20 ; % 內 循 環 最 大 迭 代 次 數 iLk
oLk = 50 ; % 外 循 環 最 大 迭 代 次 數 oLk
lam = 0.95 ; % λ lambda
istd = 0.001 ; % 若 內 循 環 函 數 值 方 差 小 於 istd 則 停 止
ostd = 0.001 ; % 若 外 循 環 函 數 值 方 差 小 於 ostd 則 停 止
ilen = 5 ; % 內 循 環 保 存 的 目 標 函 數 值 個 數
olen = 5 ; % 外 循 環 保 存 的 目 標 函 數 值 個 數
% 程 序 主 體
m = length( Coord ) ; % 城 市 的 個 數 m
fare = distance( Coord ) ; % 路 徑 費 用 fare
path = 1 : m ; % 初 始 路 徑 path
pathfar = pathfare( fare , path ) ; % 路 徑 費 用 path fare
ores = zeros( 1 , olen ) ; % 外 循 環 保 存 的 目 標 函 數 值
e0 = pathfar ; % 能 量 初 值 e0
t = t0 ; % 溫 度 t
for out = 1 : oLk % 外 循 環 模 擬 退 火 過 程
ires = zeros( 1 , ilen ) ; % 內 循 環 保 存 的 目 標 函 數 值
for in = 1 : iLk % 內 循 環 模 擬 熱 平 衡 過 程
[ newpath , v ] = swap( path , 1 ) ; % 產 生 新 狀 態
e1 = pathfare( fare , newpath ) ; % 新 狀 態 能 量
% Metropolis 抽 樣 穩 定 准 則
r = min( 1 , exp( - ( e1 - e0 ) / t ) ) ;
if rand < r
path = newpath ; % 更 新 最 佳 狀 態
e0 = e1 ;
end
ires = [ ires( 2 : end ) e0 ] ; % 保 存 新 狀 態 能 量
% 內 循 環 終 止 准 則 :連 續 ilen 個 狀 態 能 量 波 動 小 於 istd
if std( ires , 1 ) < istd
break ;
end
end
ores = [ ores( 2 : end ) e0 ] ; % 保 存 新 狀 態 能 量
% 外 循 環 終 止 准 則 :連 續 olen 個 狀 態 能 量 波 動 小 於 ostd
if std( ores , 1 ) < ostd
break ;
end
t = lam * t ;
end
pathfar = e0 ;
% 輸 入 結 果
fprintf( '近似最優路徑為:\n ' )
%disp( char( [ path , path(1) ] + 64 ) ) ;
disp(path)
fprintf( '近似最優路徑路程\tpathfare=' ) ;
disp( pathfar ) ;
myplot( path , Coord , pathfar ) ;
輸入數據的時候注意:
要輸入兩行,每行之間;分開,上面一行表示每個點的x坐標,下面一行表示每個點的y坐標
如:[ 66.83 61.95 40 24.39 17.07 22.93 51.71 87.32 68.78 84.88 50 40 25 ;
25.36 26.34 44.39 14.63 22.93 76.1 94.14 65.36 52.19 36.09 30 20 26] ;
程序輸出走的路線和總路程
如:
六、種群競爭模型
求兩個不同的群體共同生存時,兩個群體的增長(下降)趨勢
代碼:
fun.m:
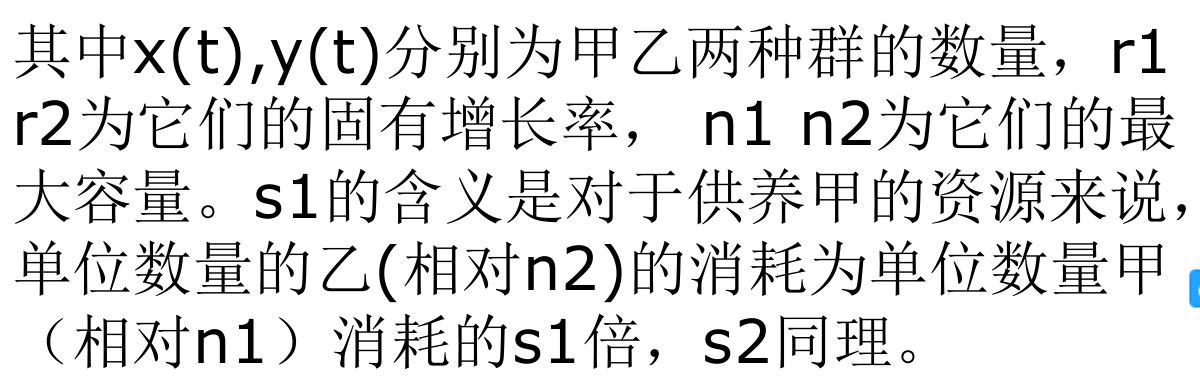
function dx=fun(t,x,r1,r2,n1,n2,s1,s2)
r1=1;
r2=1;
n1=100;
n2=100;
s1=0.5;
s2=2;
dx=[r1*x(1)*(1-x(1)/n1-s1*x(2)/n2);r2*x(2)*(1-s2*x(1)/n1-x(2)/n2)];
p3.m:
h=0.1;%所取時間點間隔
ts=[0:h:30];%時間區間
x0=[10,10];%初始條件
opt=odeset('reltol',1e-6,'abstol',1e-9);%相對誤差1e-6,絕對誤差1e-9
[t,x]=ode45(@fun,ts,x0,opt);%使用5級4階龍格—庫塔公式計算
plot(t,x(:,1),'r',t,x(:,2),'b','LineWidth',2),grid;
pause;
plot(x(:,1),x(:,2),'LineWidth',2),grid %作相軌線
我們運行程序的時候主要改動r1,r2,n1,n2,s1,s2,具體含義看下面
七、線性規劃模型
求多元一次方程的最優解
如:
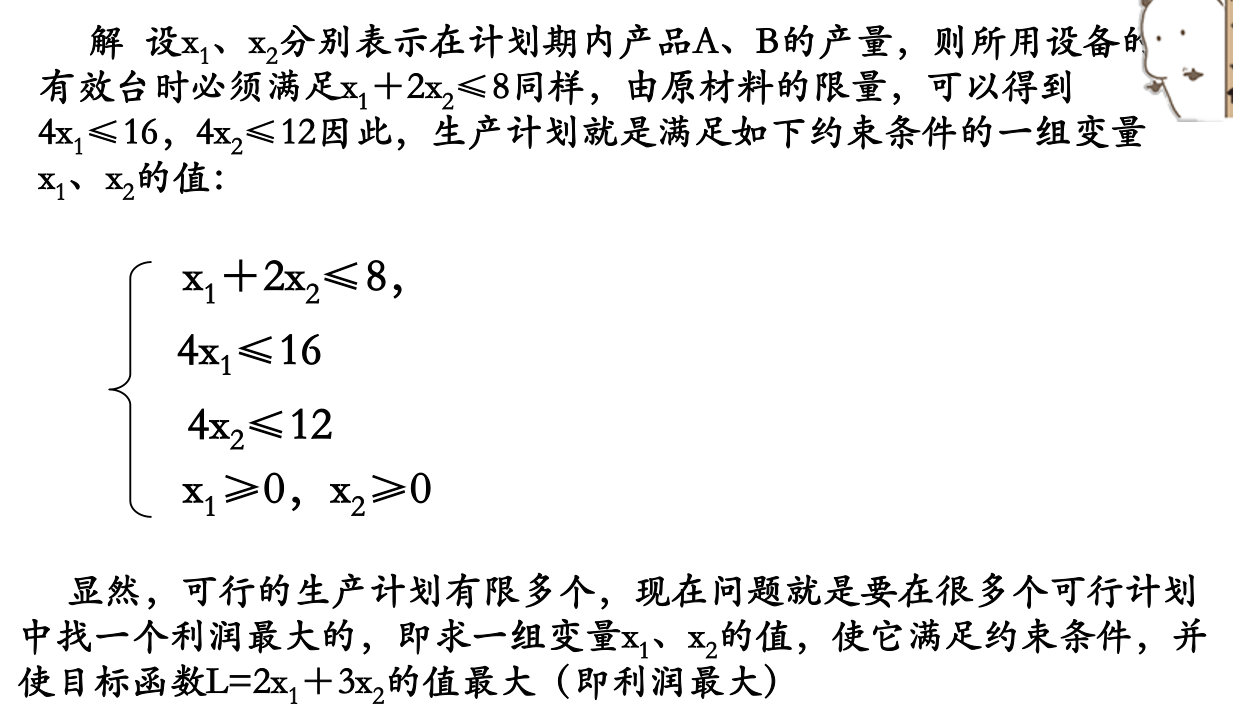
那麼,其Lingo程序為:
max=2*x1+3*x2;
x1+2*x2<=8;
4*x1<=16;
4*x2<=12;
類似的可以通過變換程序中的數據來求解你的問題
八、非線性與0/1問題
非線性:
如:
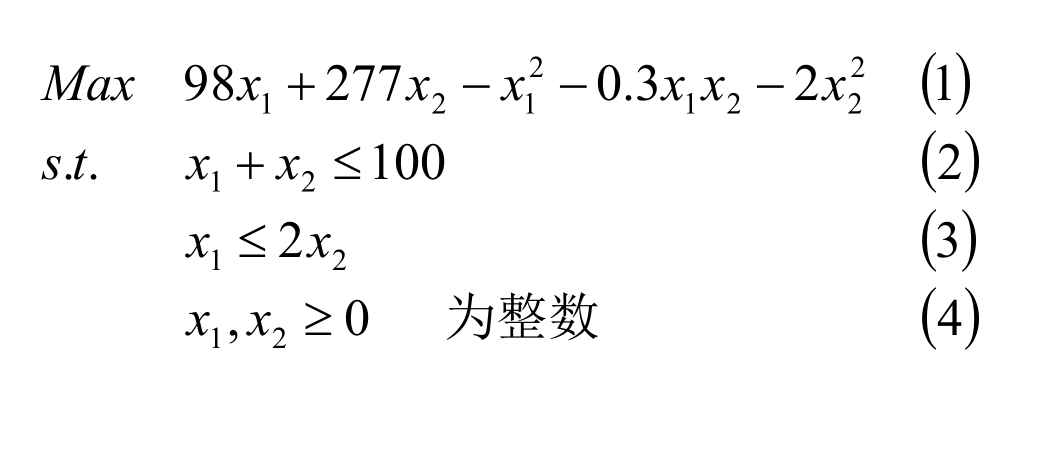
這樣的問題可以用Lingo解決:
max=98*x1+277*x2-x1*x1-0.3*x1*x2-2*x2*x2;
x1+x2<100;
x1<=2*x2;
類似的可以通過變換程序中的數據來求解你的問題
0/1問題:
01 規劃是指未知量的取值範圍只能是0,1 的規劃問題,通常是線性規劃
如:
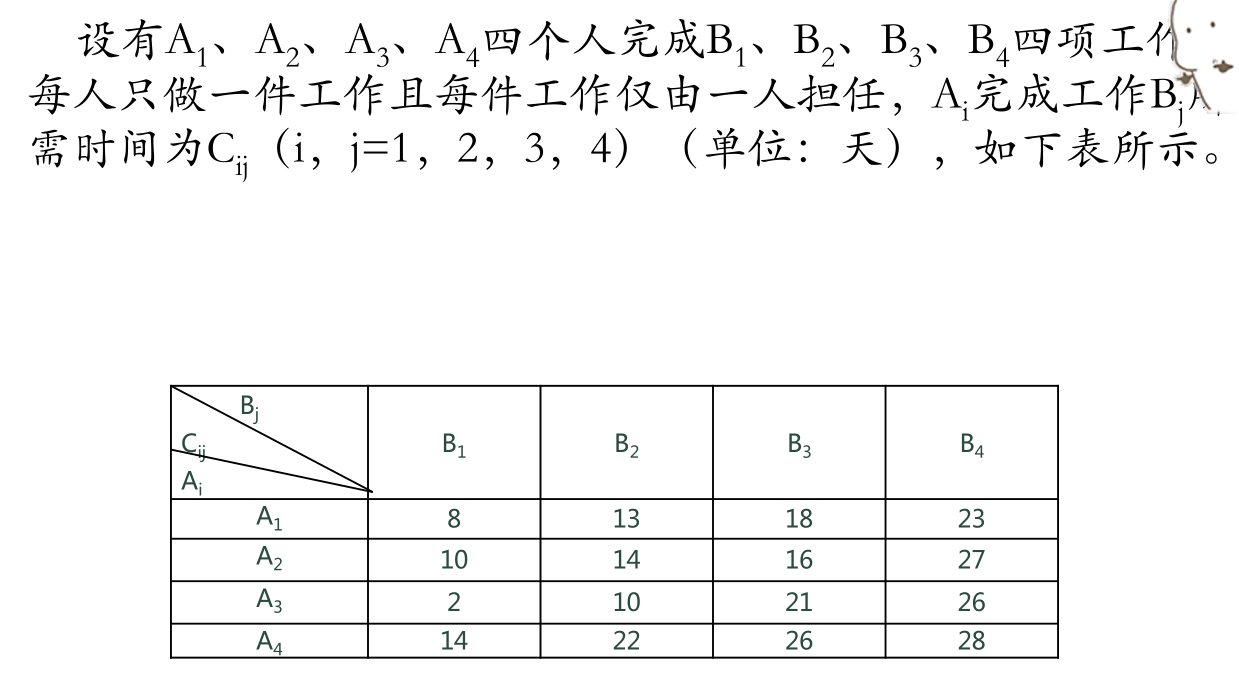

那麼這樣可以用Lingo程序解決:
Min=8*x11+13*x12+18*x13+23*x14+10*x21+14*x22+16*x23+27*x24+2*x31+10*x32+21*x33+26*x34+14*x41+22*x42+26*x43+28*x44;
x11+x12+x13+x14=1;
x21+x22+x23+x24=1;
x31+x32+x33+x34=1;
x41+x42+x43+x44=1;
x11+x21+x31+x41=1;
x12+x22+x32+x42=1;
x13+x23+x33+x43=1;
x14+x24+x34+x44=1;
end
int16
類似的可以通過變換程序中的數據來求解你的問題
九、主成分分析
提取決定總目標的某幾個最主要的成分
如:求以下決定地區排名的2個最主要的成分
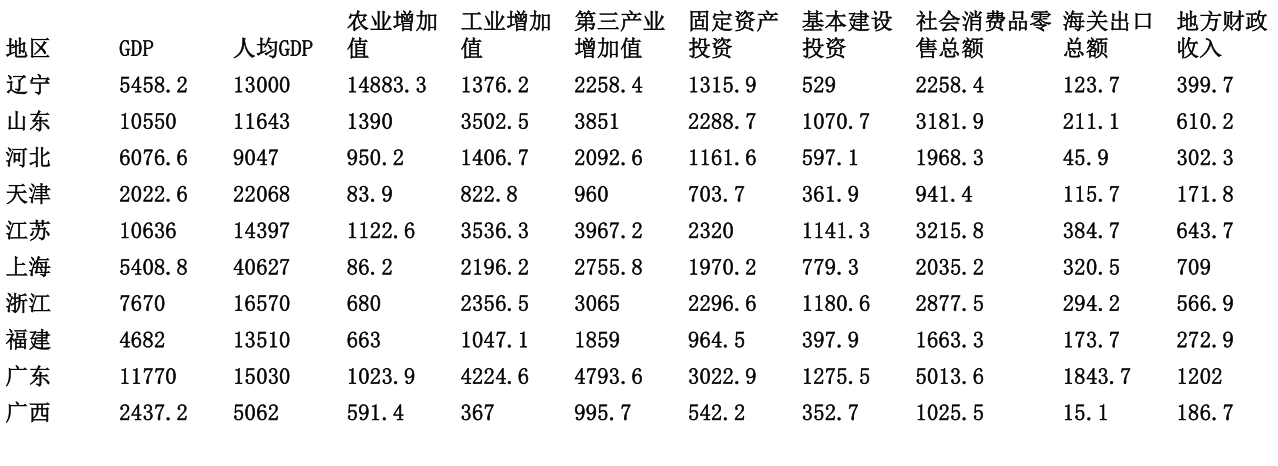
具體使用方法://wenku.baidu.com/view/694c8459effdc8d376eeaeaad1f34693daef1087.html
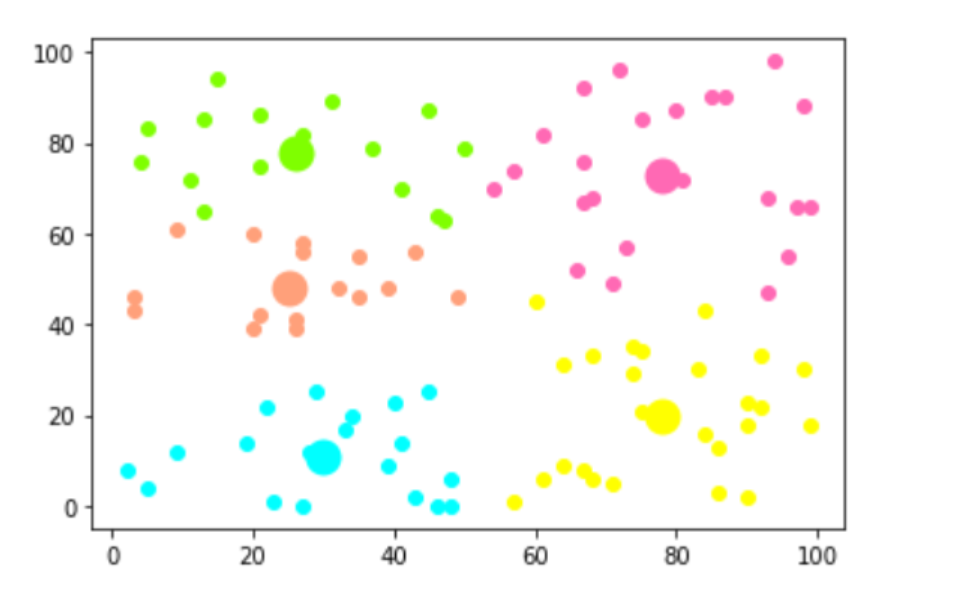
十、聚類分析
將一堆分散的點分成分成幾大類
主要用途:將坐標上的分散點按照遠近分成幾類
python代碼:
import numpy as np
import matplotlib.pyplot as plt

# 兩點距離
def distance(e1, e2):
    # e1:[x1,y1]  e2:[x2,y2]
    # |e1,e2|=((x1-x2)^2+(y1-y2)^2)^(1/2)
    return np.sqrt((e1[0]-e2[0])**2+(e1[1]-e2[1])**2)

# 集合中心
def means(arr):
    # 求 [所有點x的平均值 , 所有點y的平均值]
    return np.array([np.mean([e[0] for e in arr]), np.mean([e[1] for e in arr])])

# arr中距離a最遠的元素,用於初始化聚類中心
def farthest(k_arr, arr):
    f = [0, 0]
    max_d = 0
    for e in arr:
        d = 0
        for i in range(len(k_arr)):
            d = d + np.sqrt(distance(k_arr[i], e))
        if d > max_d:
            max_d = d
            f = e
    return f

# arr中距離a最近的元素,用於聚類
def closest(a, arr):
    c = arr[1]
    min_d = distance(a, arr[1])
    arr = arr[1:]
    for e in arr:
        d = distance(a, e)
        if d < min_d:
            min_d = d
            c = e
    return c # 返回[x,y]


if __name__=="__main__":
    ## 生成二維隨機坐標,手上有數據集的朋友注意,理解arr改起來就很容易了
    ## arr是一個數組,每個元素都是一個二元組,代表着一個坐標
    ## arr形如:[ (x1, y1), (x2, y2), (x3, y3) ... ]
    arr = np.random.randint(100, size=(100, 1, 2))[:, 0, :] # arr是隨機二維點集
    '''
    arr =
    [[75 57]
     [24 51]
     [59 63]
     [62 75]
     [78 98]
        .
        .
        .
     [77 45]
     [95 53]
     [73 41]
     [96 19]
     [19 29]
     [62 35]
     [79 85]]
    '''

    ## 初始化聚類中心和聚類容器
    m = 5 # 中心點個數
    # 隨機選取一個數a作為中心點
    a = np.random.randint(len(arr) - 1)
    k_arr = np.array([arr[a]])
    cla_arr = [[]]
    for i in range(m-1):
        k = farthest(k_arr, arr) # 求與中心點集最遠的點
        # k:[x,y]
        k_arr = np.concatenate([k_arr, np.array([k])]) # concatenate 實現矩陣拼接(更新中心點集)
        cla_arr.append([])
    # k_arr 中包含的元素即中心點的集合

    ## 迭代聚類
    n = 20
    cla_temp = cla_arr
    for i in range(n):    # 迭代n次
        for e in arr:    # 把集合里每一個元素聚到最近的類
            ki = 0        # 假定距離第一個中心最近
            min_d = distance(e, k_arr[ki])
            for j in range(1, len(k_arr)):
                if distance(e, k_arr[j]) < min_d:    # 找到更近的聚類中心
                    min_d = distance(e, k_arr[j])
                    ki = j
            cla_temp[ki].append(e) # 距離e最近的中心點的集合中加入e
        # 迭代更新聚類中心
        for k in range(len(k_arr)):
            if n - 1 == i:
                break
            k_arr[k] = means(cla_temp[k]) # 每迭代一次,就更新中心點為距離自己最近的點的平均值,即將距離較近的一堆點壓縮成一個點
            cla_temp[k] = []

    ## 可視化展示
    col = ['HotPink', 'Aqua', 'Chartreuse', 'yellow', 'LightSalmon']
    for i in range(m):
        plt.scatter(k_arr[i][0], k_arr[i][1], linewidth=10, color=col[i])
        plt.scatter([e[0] for e in cla_temp[i]], [e[1] for e in cla_temp[i]], color=col[i])
    plt.show()
大家運行的時候只需要把程序中的arr改成自己的點陣就可以了
如:arr=[[1,2],
[3,4],
……
]
程序運行出來就是這樣:
到這裡美賽的算法介紹就over了


