拒絕黑盒應用-Spring Boot 應用可視化監控
- 2019 年 10 月 31 日
- 筆記

圖文簡介
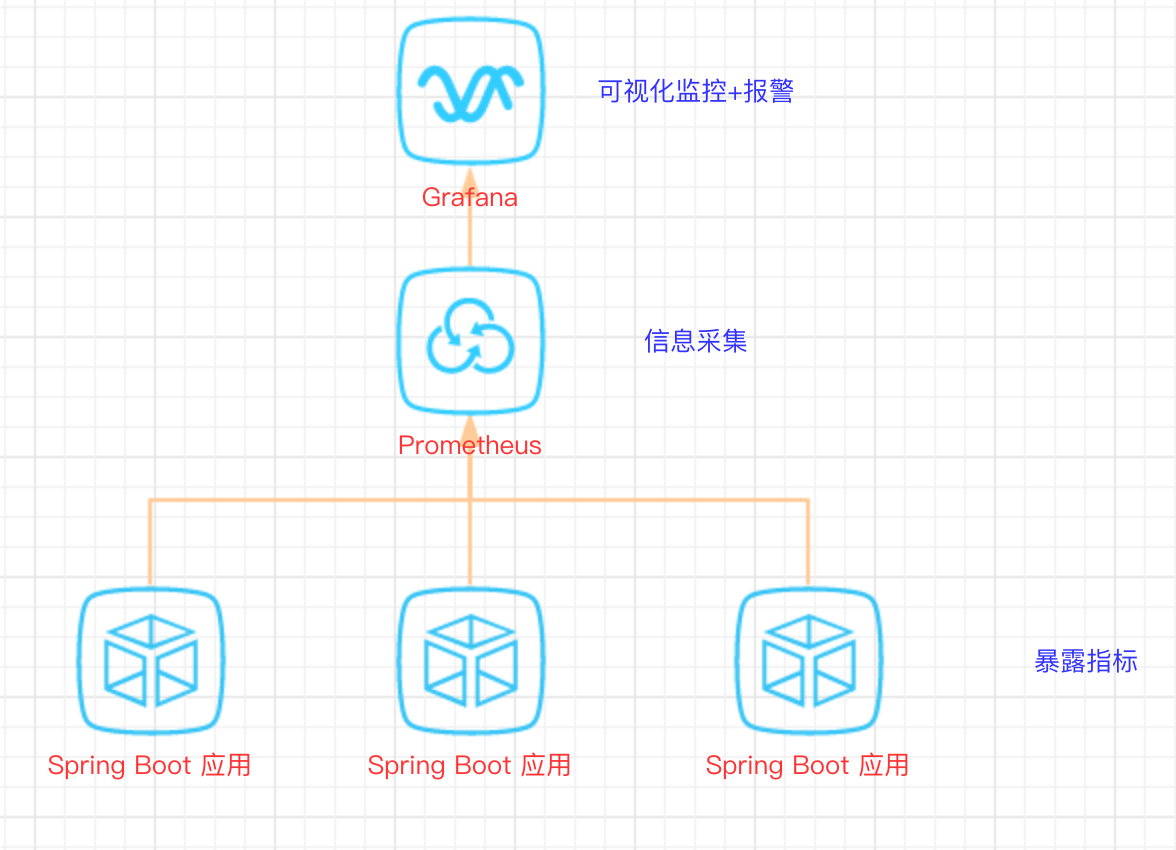
邏輯關係
效果演示
快速開始
1、Spring Boot 應用暴露監控指標【版本 1.5.7.RELEASE】
首先,添加依賴如下依賴:
<dependency> <groupId>org.springframework.boot</groupId> <artifactId>spring-boot-starter-actuator</artifactId> </dependency> <dependency> <groupId>io.prometheus</groupId> <artifactId>simpleclient_spring_boot</artifactId> <version>0.0.26</version> </dependency>然後,在啟動類 Application.java 添加如下注解:
@SpringBootApplication @EnablePrometheusEndpoint @EnableSpringBootMetricsCollector public class Application { public static void main(String[] args) { SpringApplication.run(Application.class, args); } }最後,配置默認的登錄賬號和密碼,在 application.yml 中:
security: user: name: user password: pwd提示:不建議配置
management.security.enabled: false
啟動應用程序後,會看到如下一系列的 Mappings
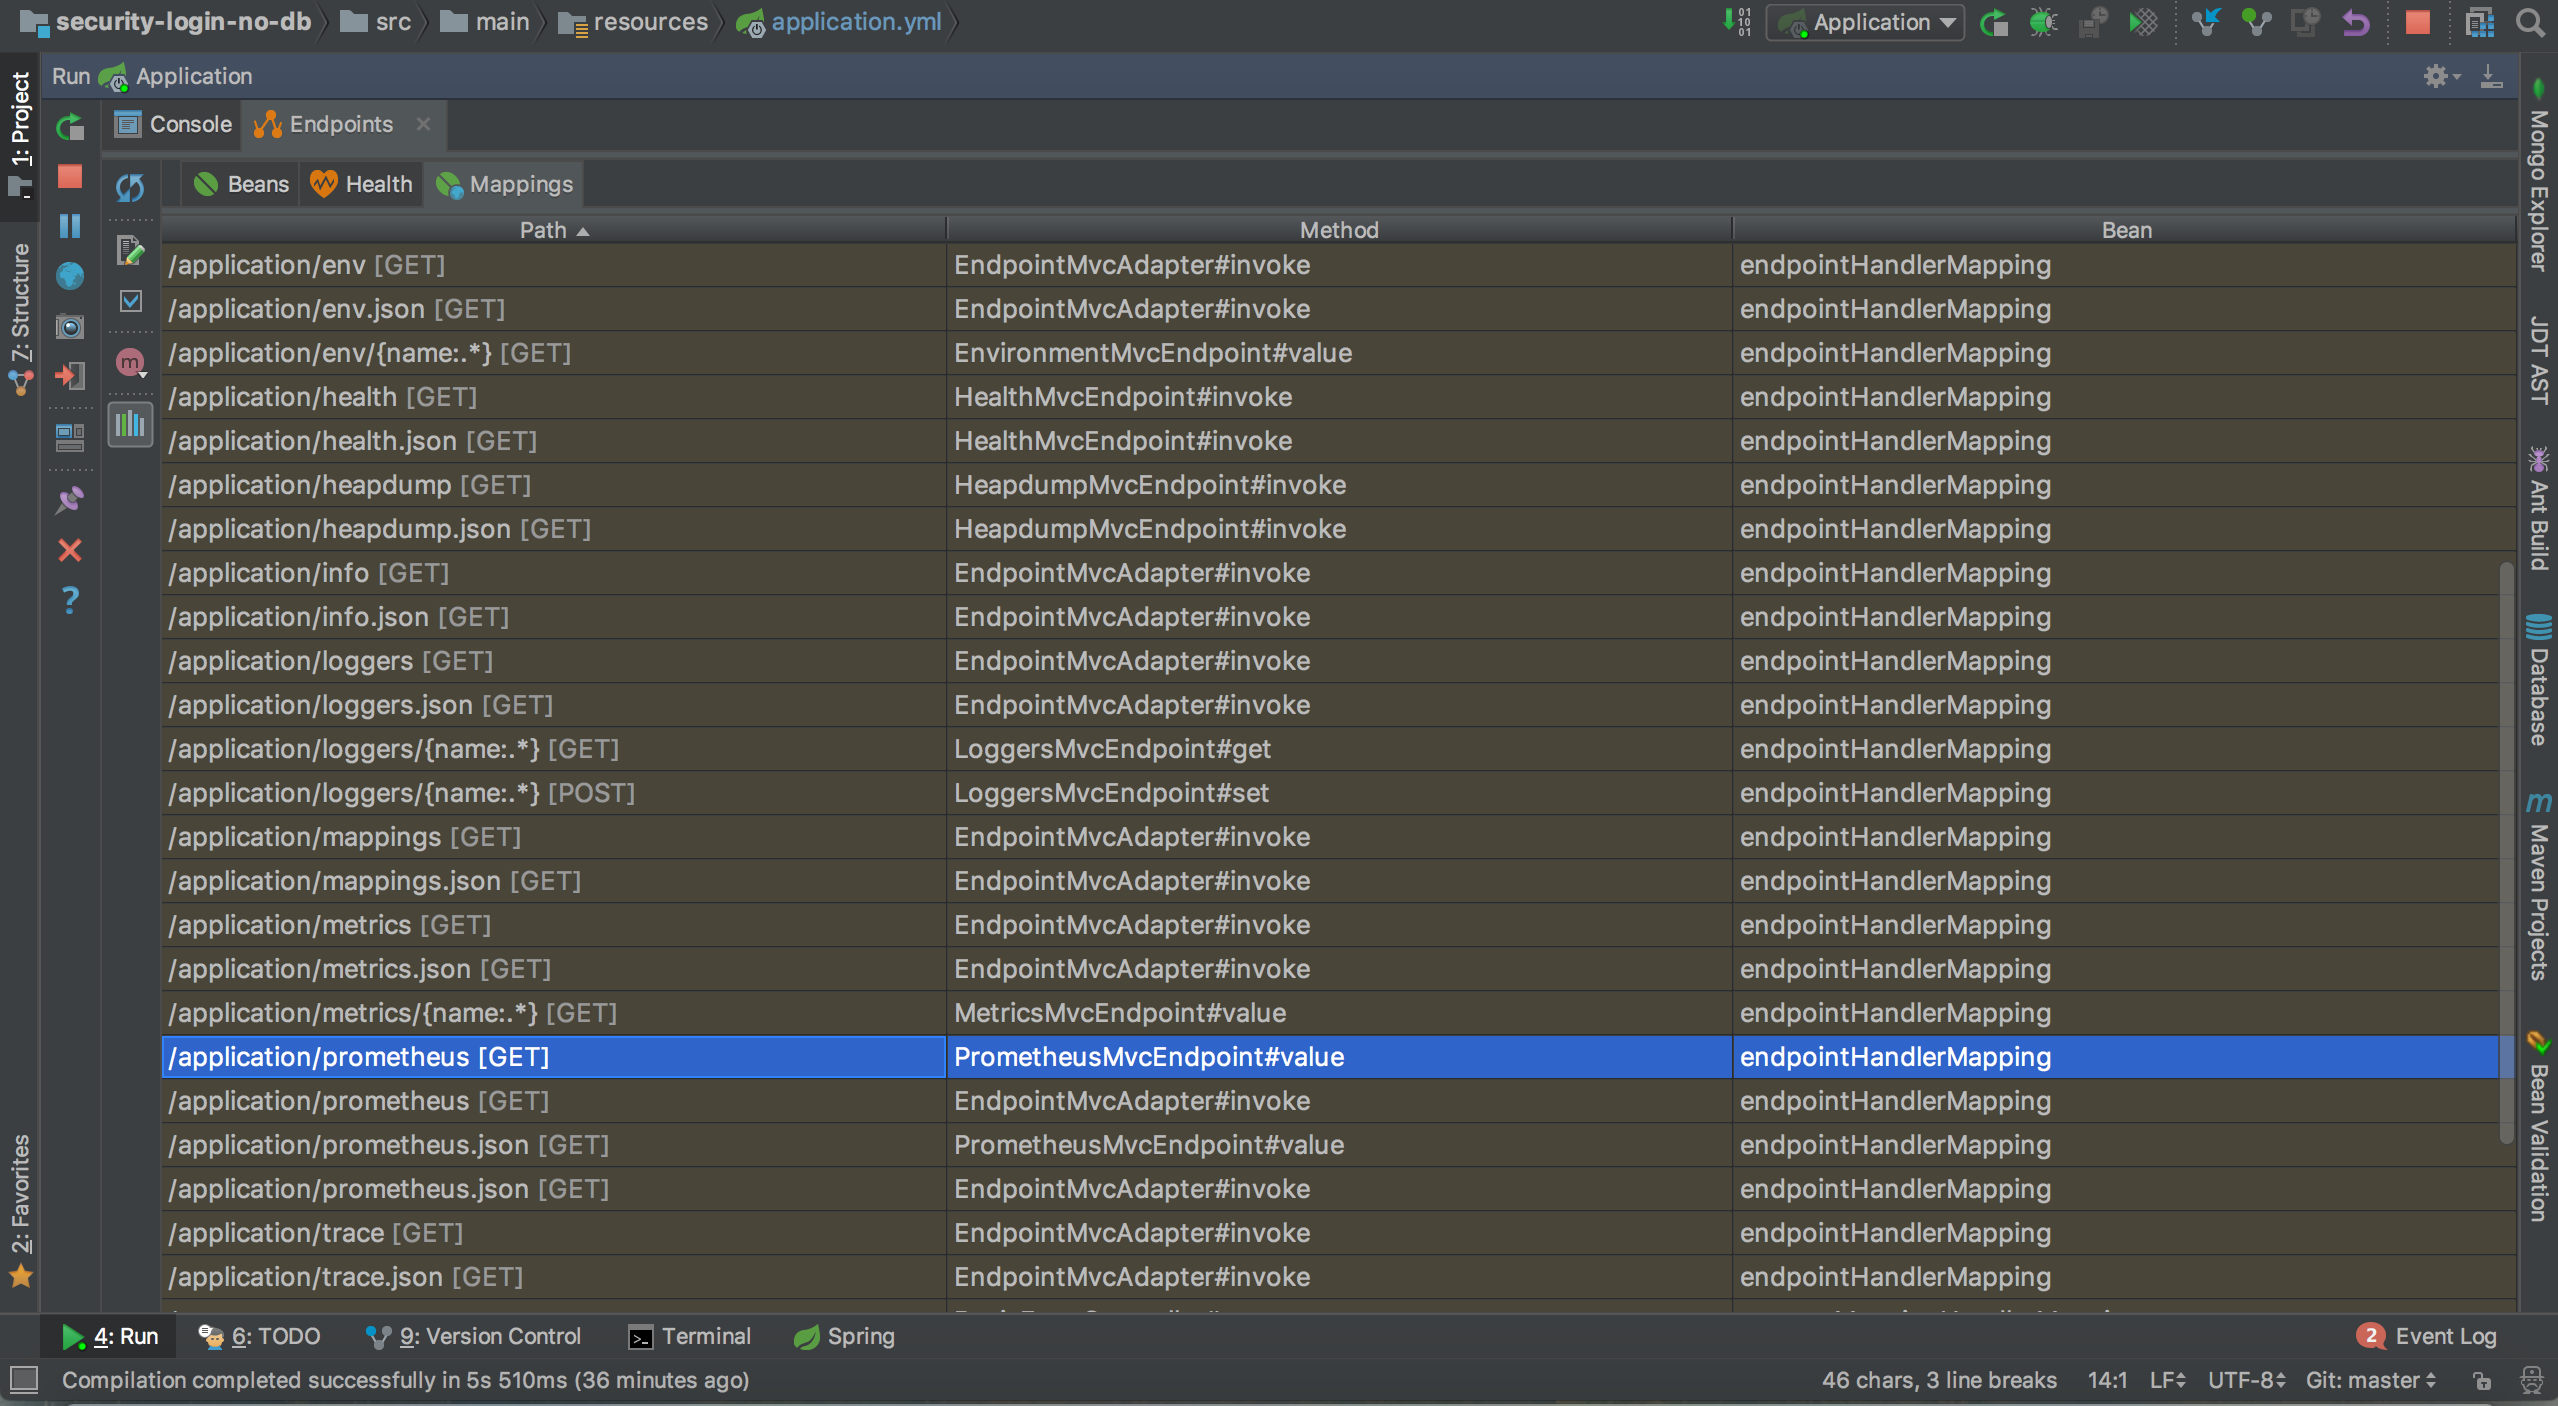
Mappings
利用賬號密碼訪問 http://localhost:8080/application/prometheus ,可以看到 Prometheus 格式的指標數據

指標數據
2、Prometheus 採集 Spring Boot 指標數據
首先,獲取 Prometheus 的 Docker 鏡像:
$ docker pull prom/prometheus然後,編寫配置文件 prometheus.yml :
global: scrape_interval: 10s scrape_timeout: 10s evaluation_interval: 10m scrape_configs: - job_name: spring-boot scrape_interval: 5s scrape_timeout: 5s metrics_path: /application/prometheus scheme: http basic_auth: username: user password: pwd static_configs: - targets: - 127.0.0.1:8080 #此處填寫 Spring Boot 應用的 IP + 端口號接着,啟動 Prometheus :
$ docker run -d --name prometheus -p 9090:9090 -m 500M -v "$(pwd)/prometheus.yml":/prometheus.yml -v "$(pwd)/data":/data prom/prometheus -config.file=/prometheus.yml -log.level=info最後,訪問 http://localhost:9090/targets , 檢查 Spring Boot 採集狀態是否正常。
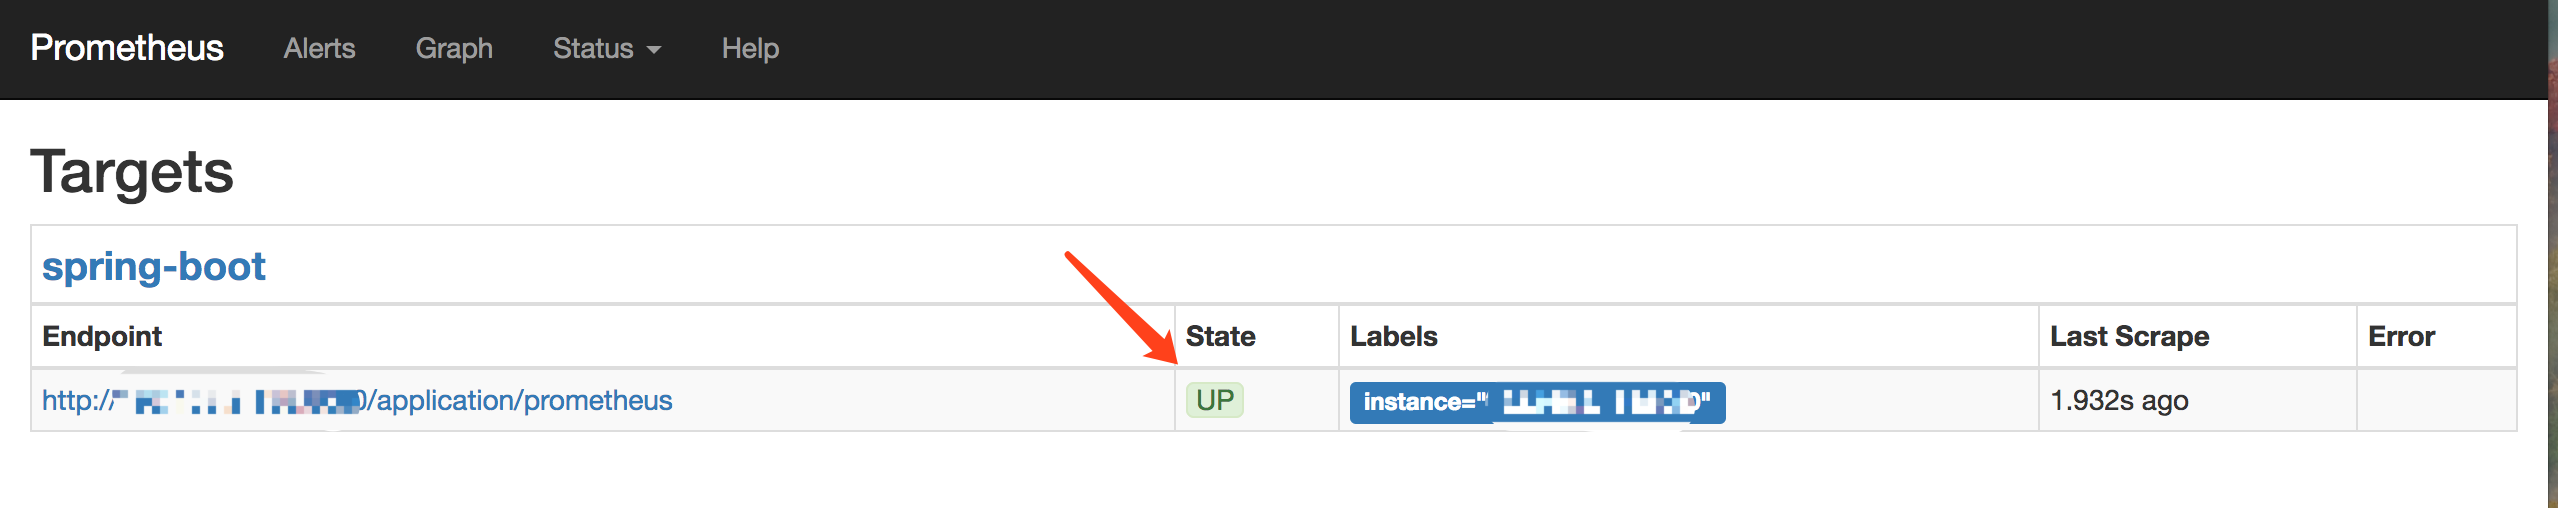
採集狀態
3、Grafana 可視化監控數據
首先,獲取 Grafana 的 Docker 鏡像:
$ docker pull grafana/grafana然後,啟動 Grafana:
$ docker run --name grafana -d -p 3000:3000 grafana/grafana接着,訪問 http://localhost:3000/ 配置 Prometheus 數據源:
Grafana 登錄賬號 admin 密碼 admin

配置 DataSource
最後,配置單個指標的可視化監控面板:
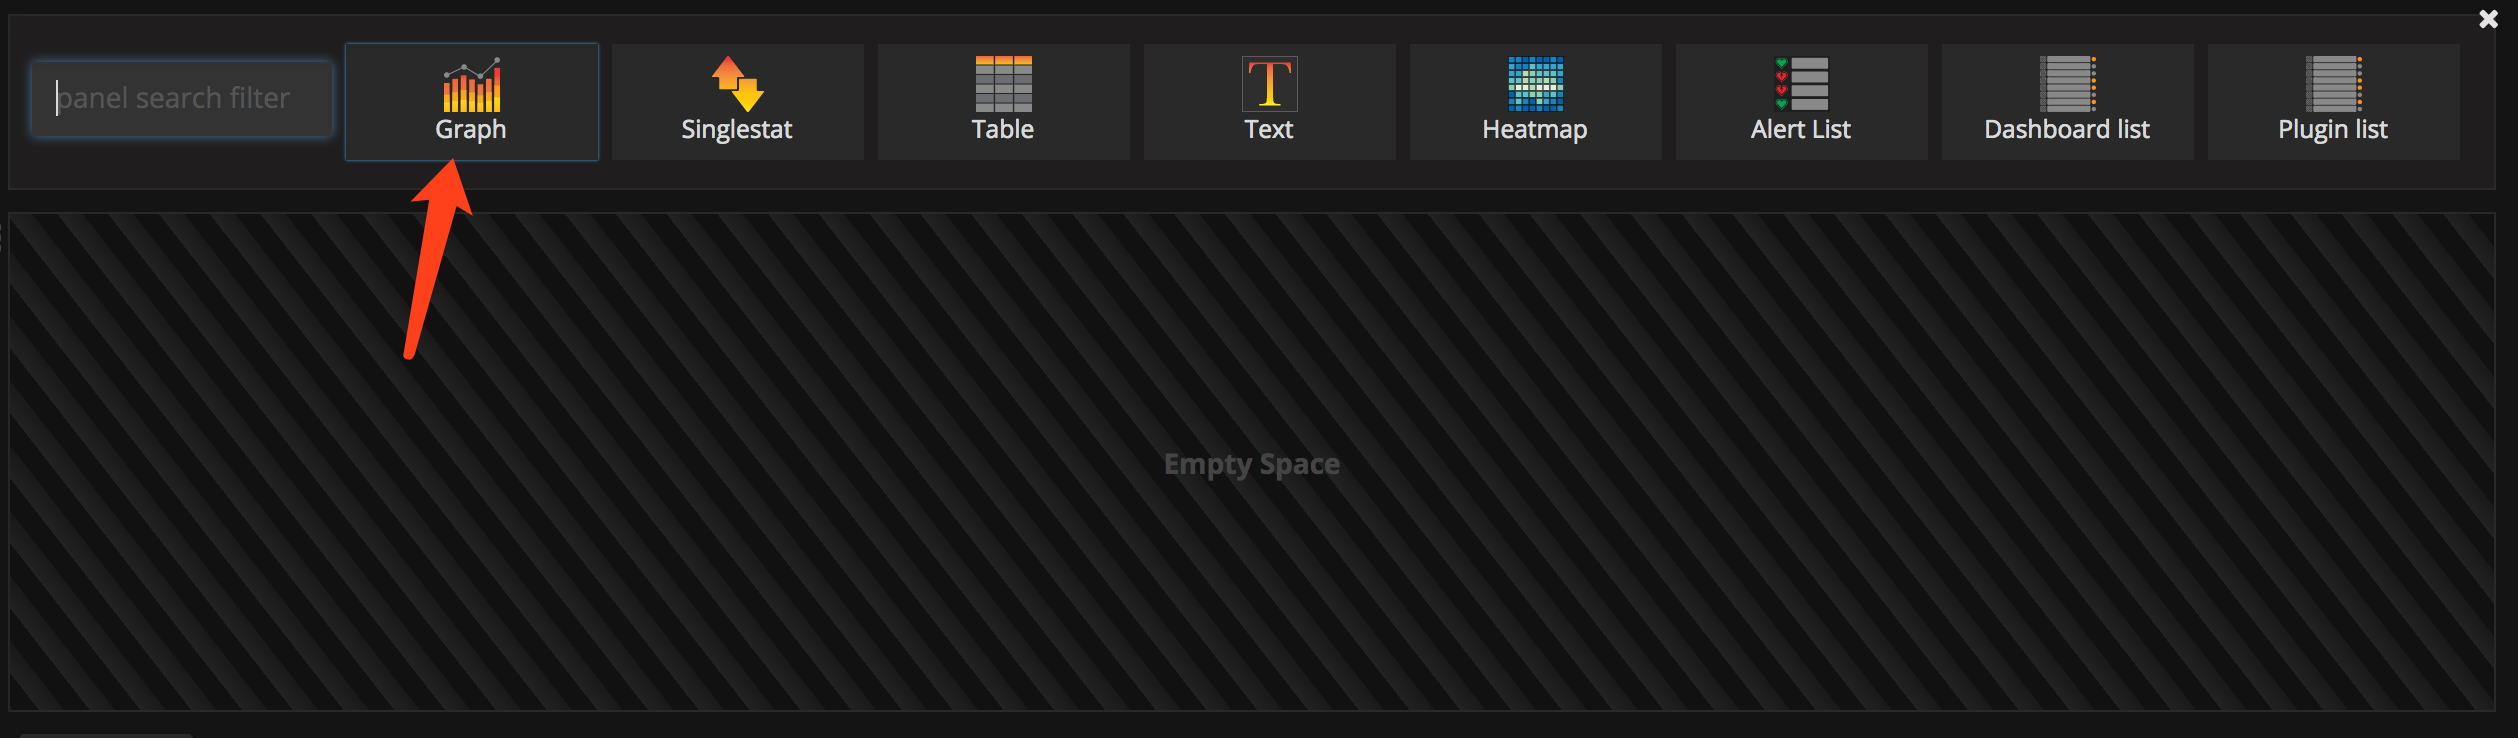
選擇 Graph
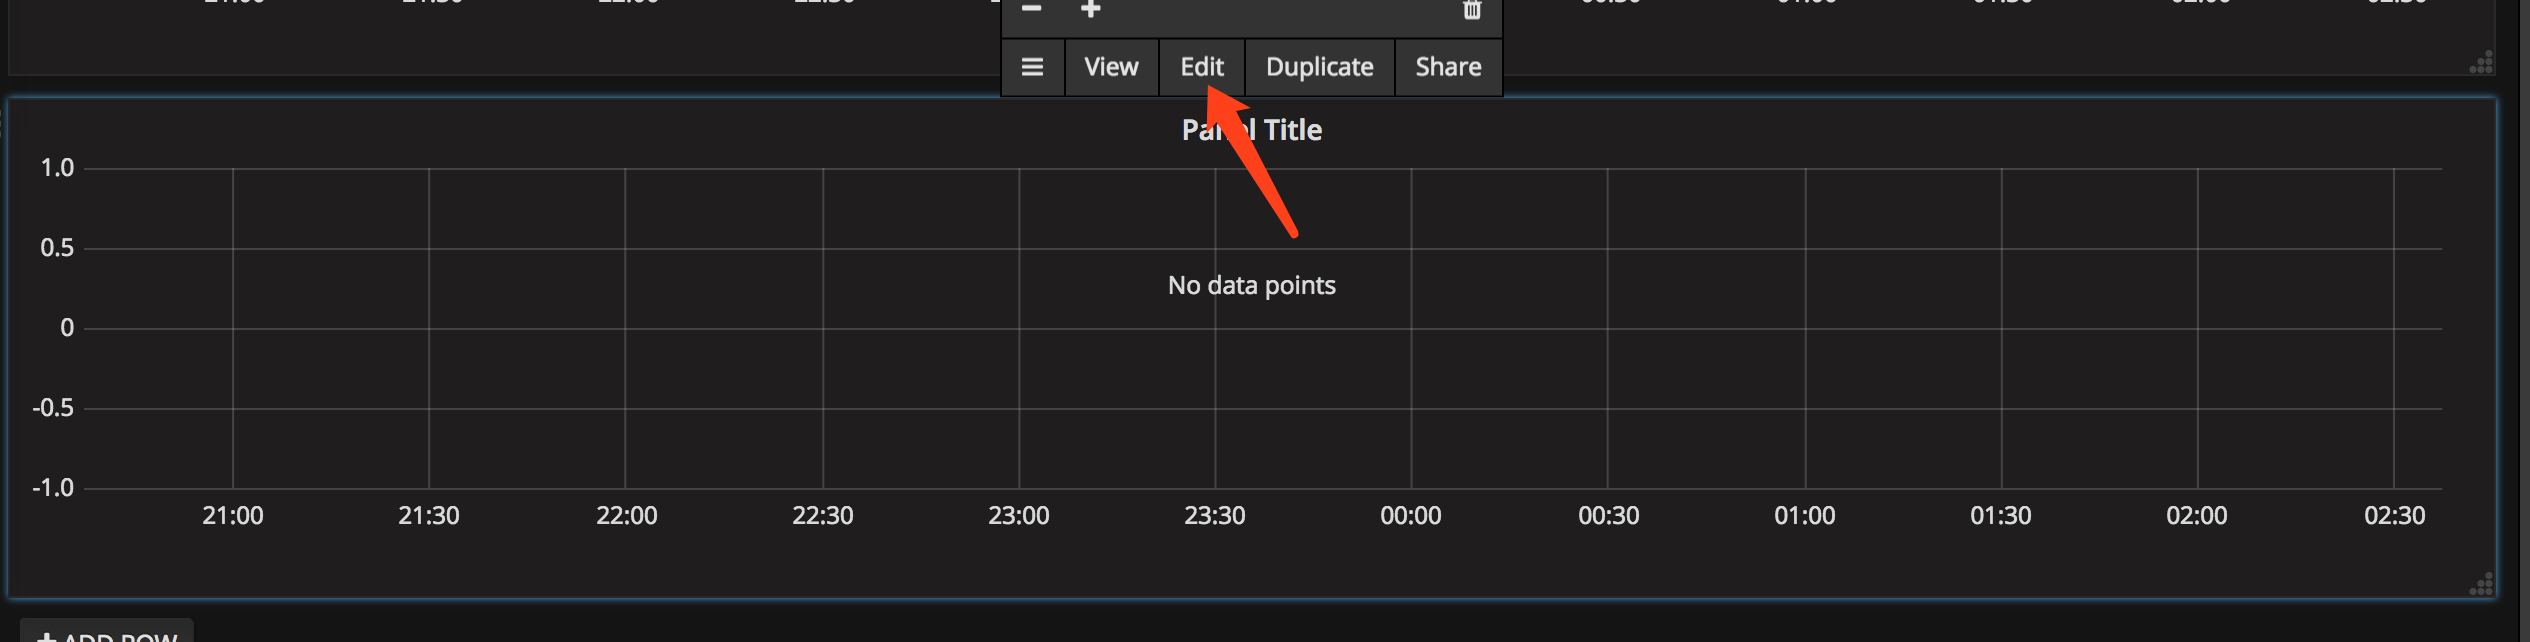
編輯
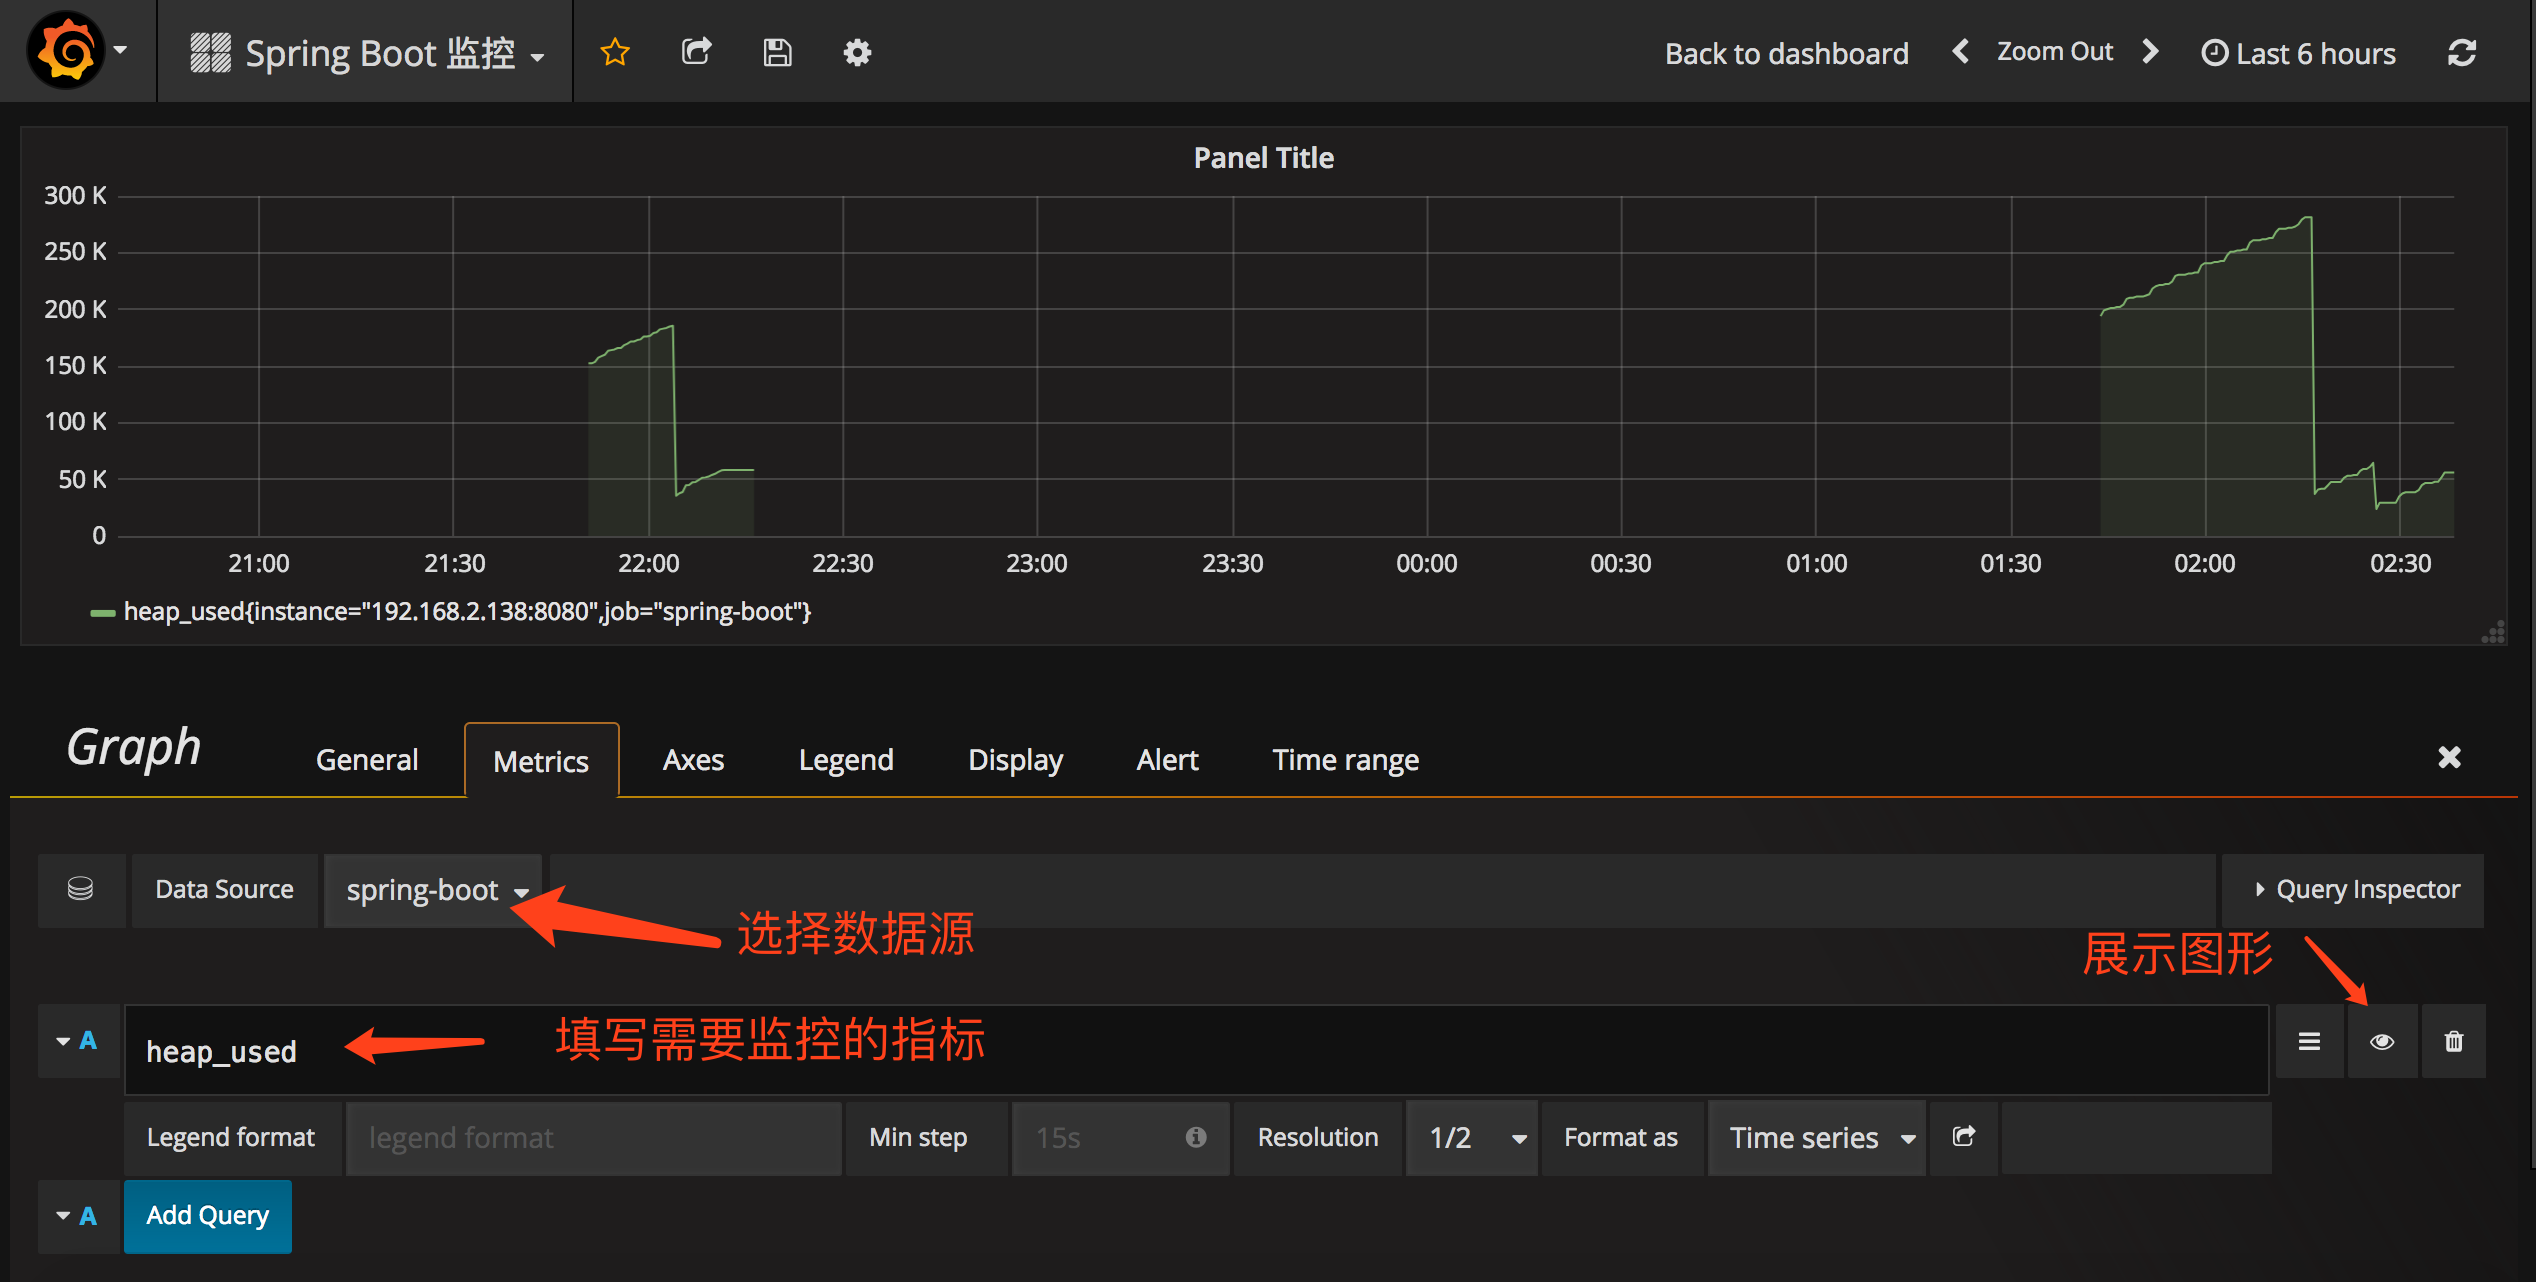
配置需要監控的指標
提示,此處不能任意填寫,只能填已有的指標點,具體的可以在 Prometheus 的首頁看到,即 http://localhost:9090/graph
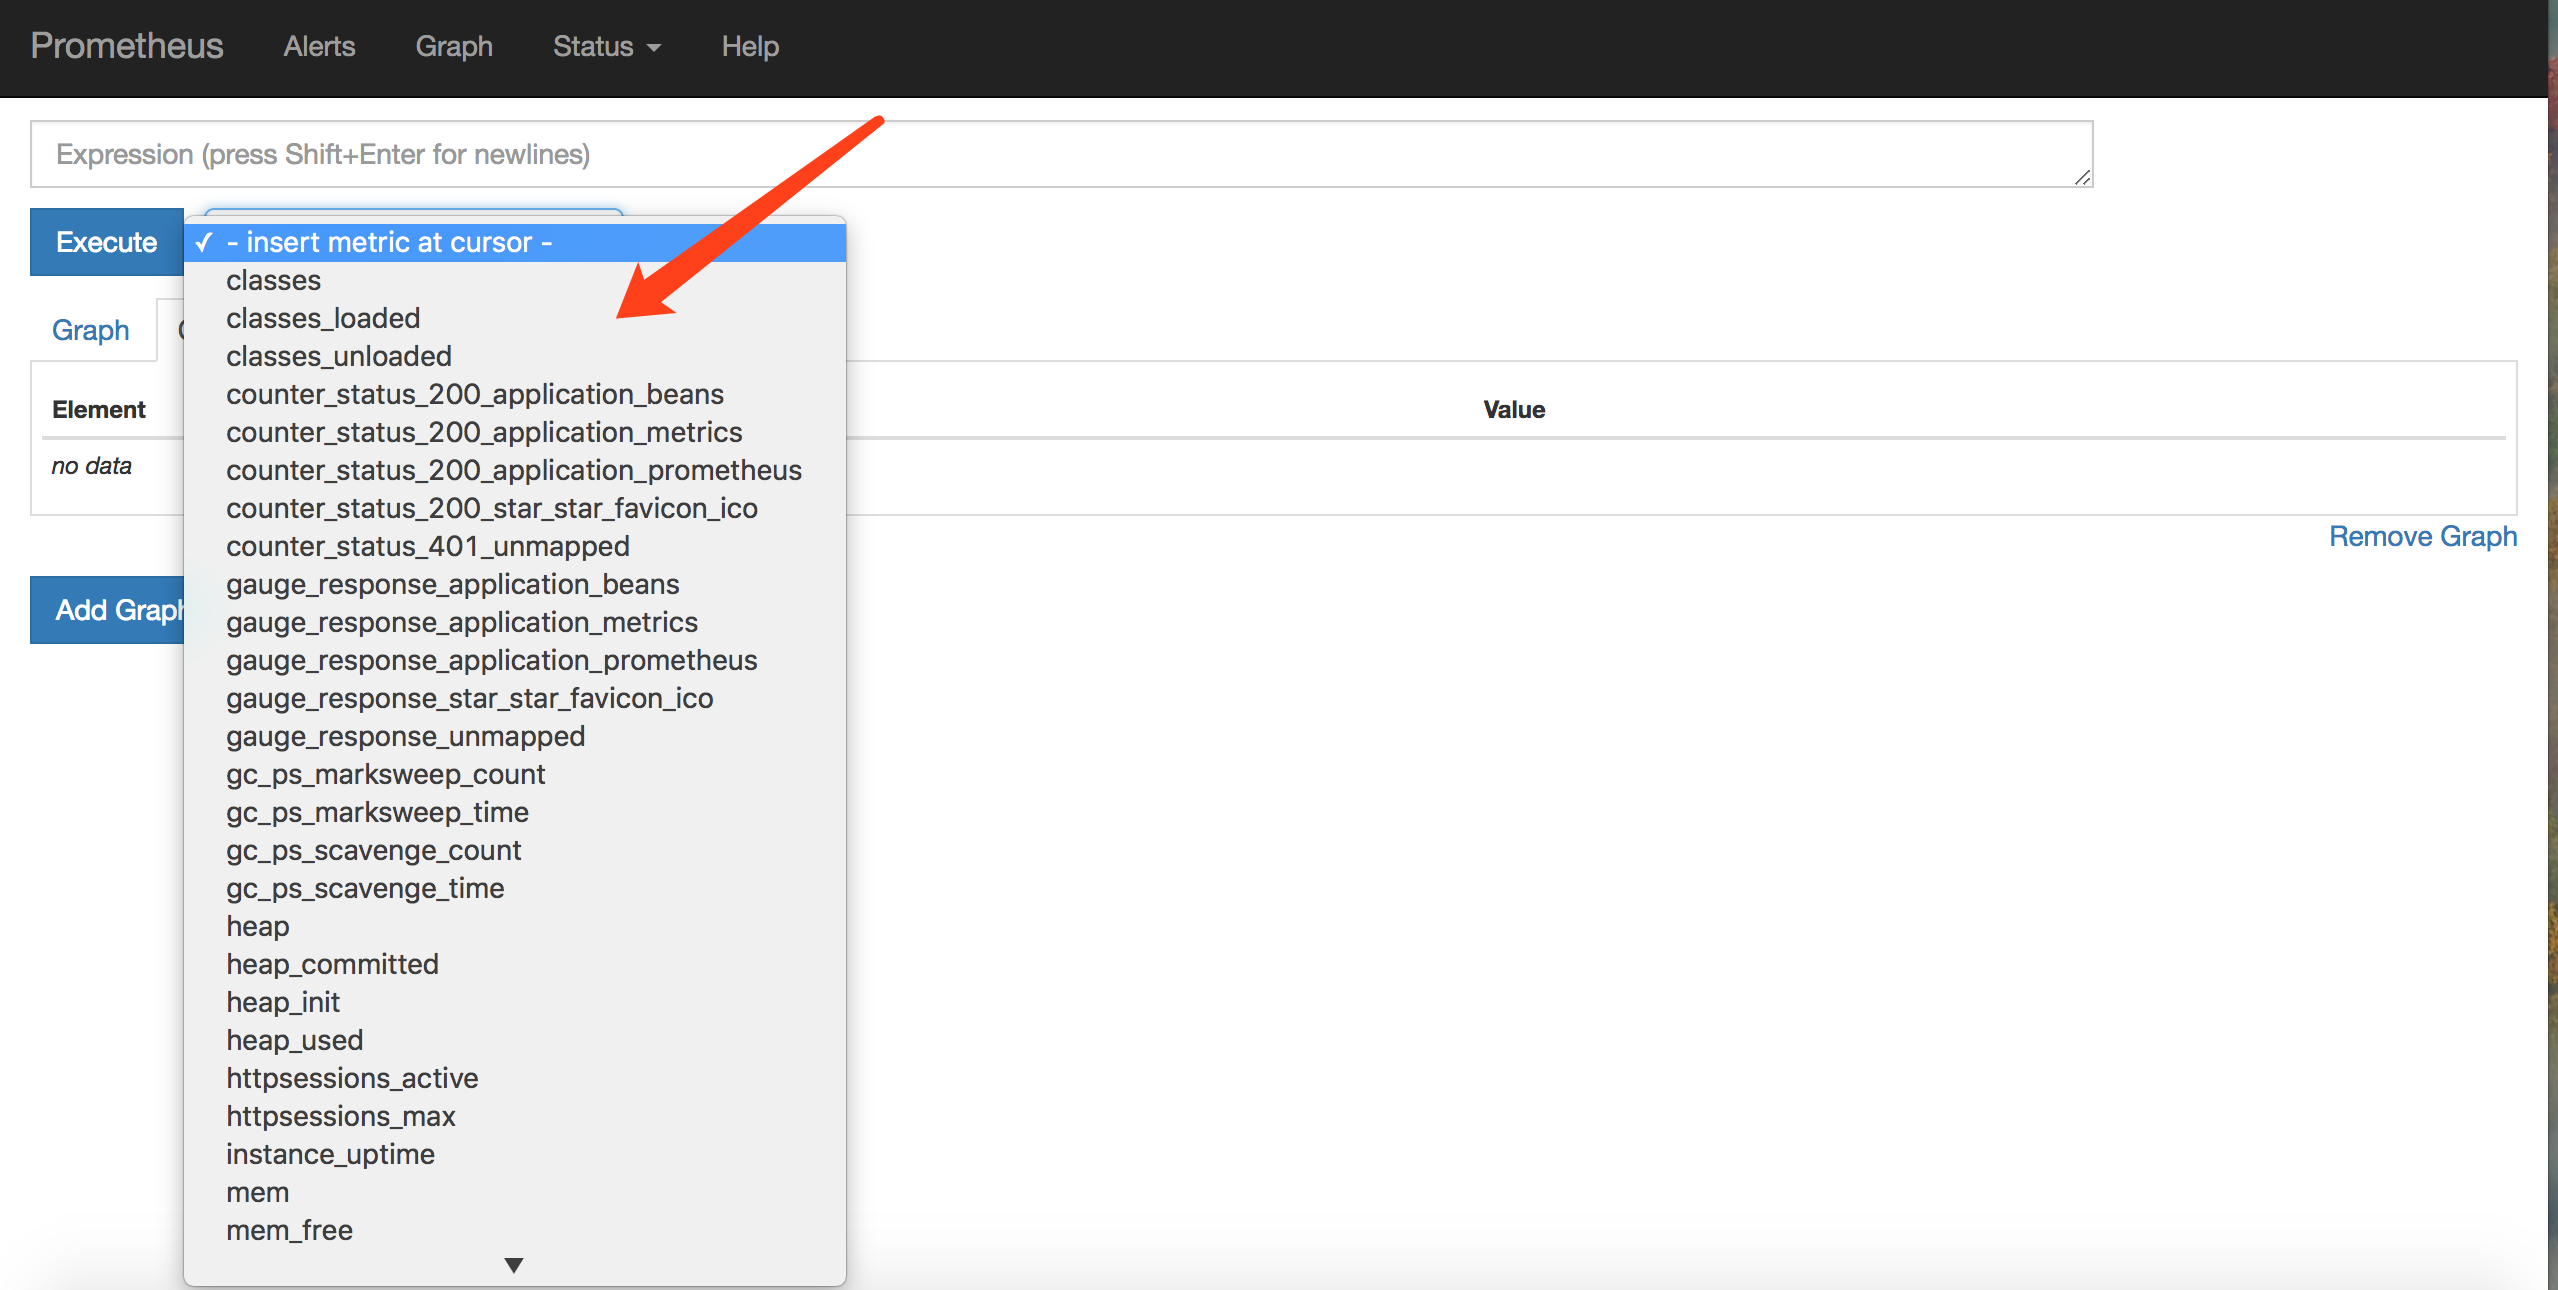
指標
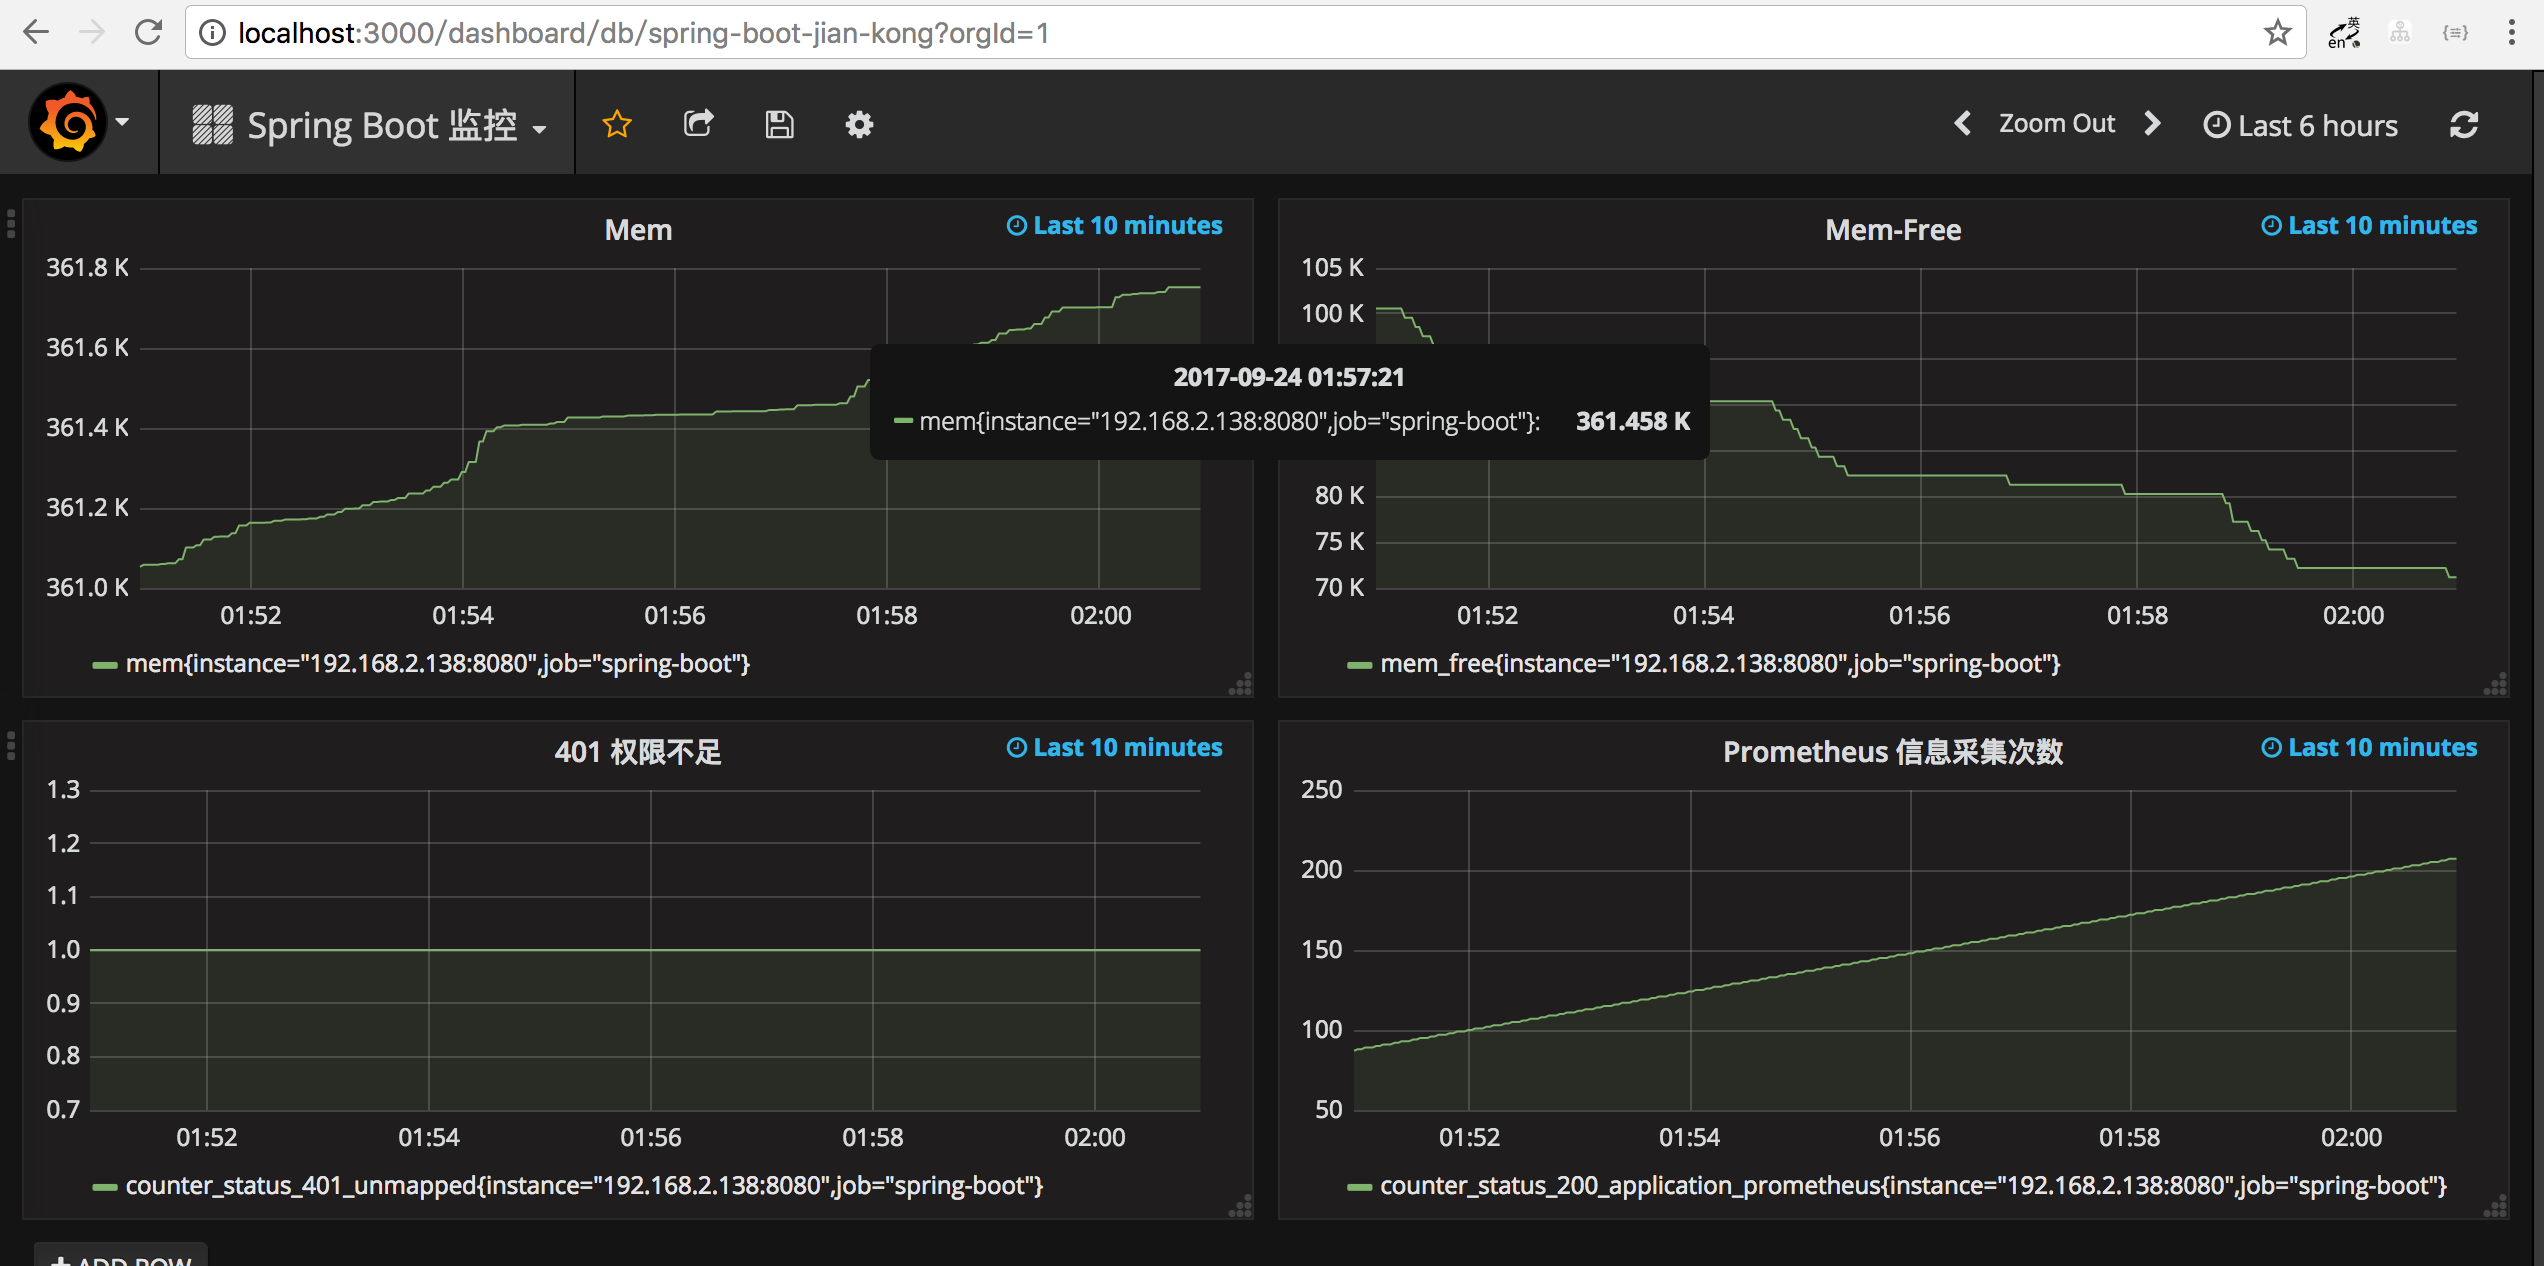
多配置幾個指標之後,即可有如下效果:
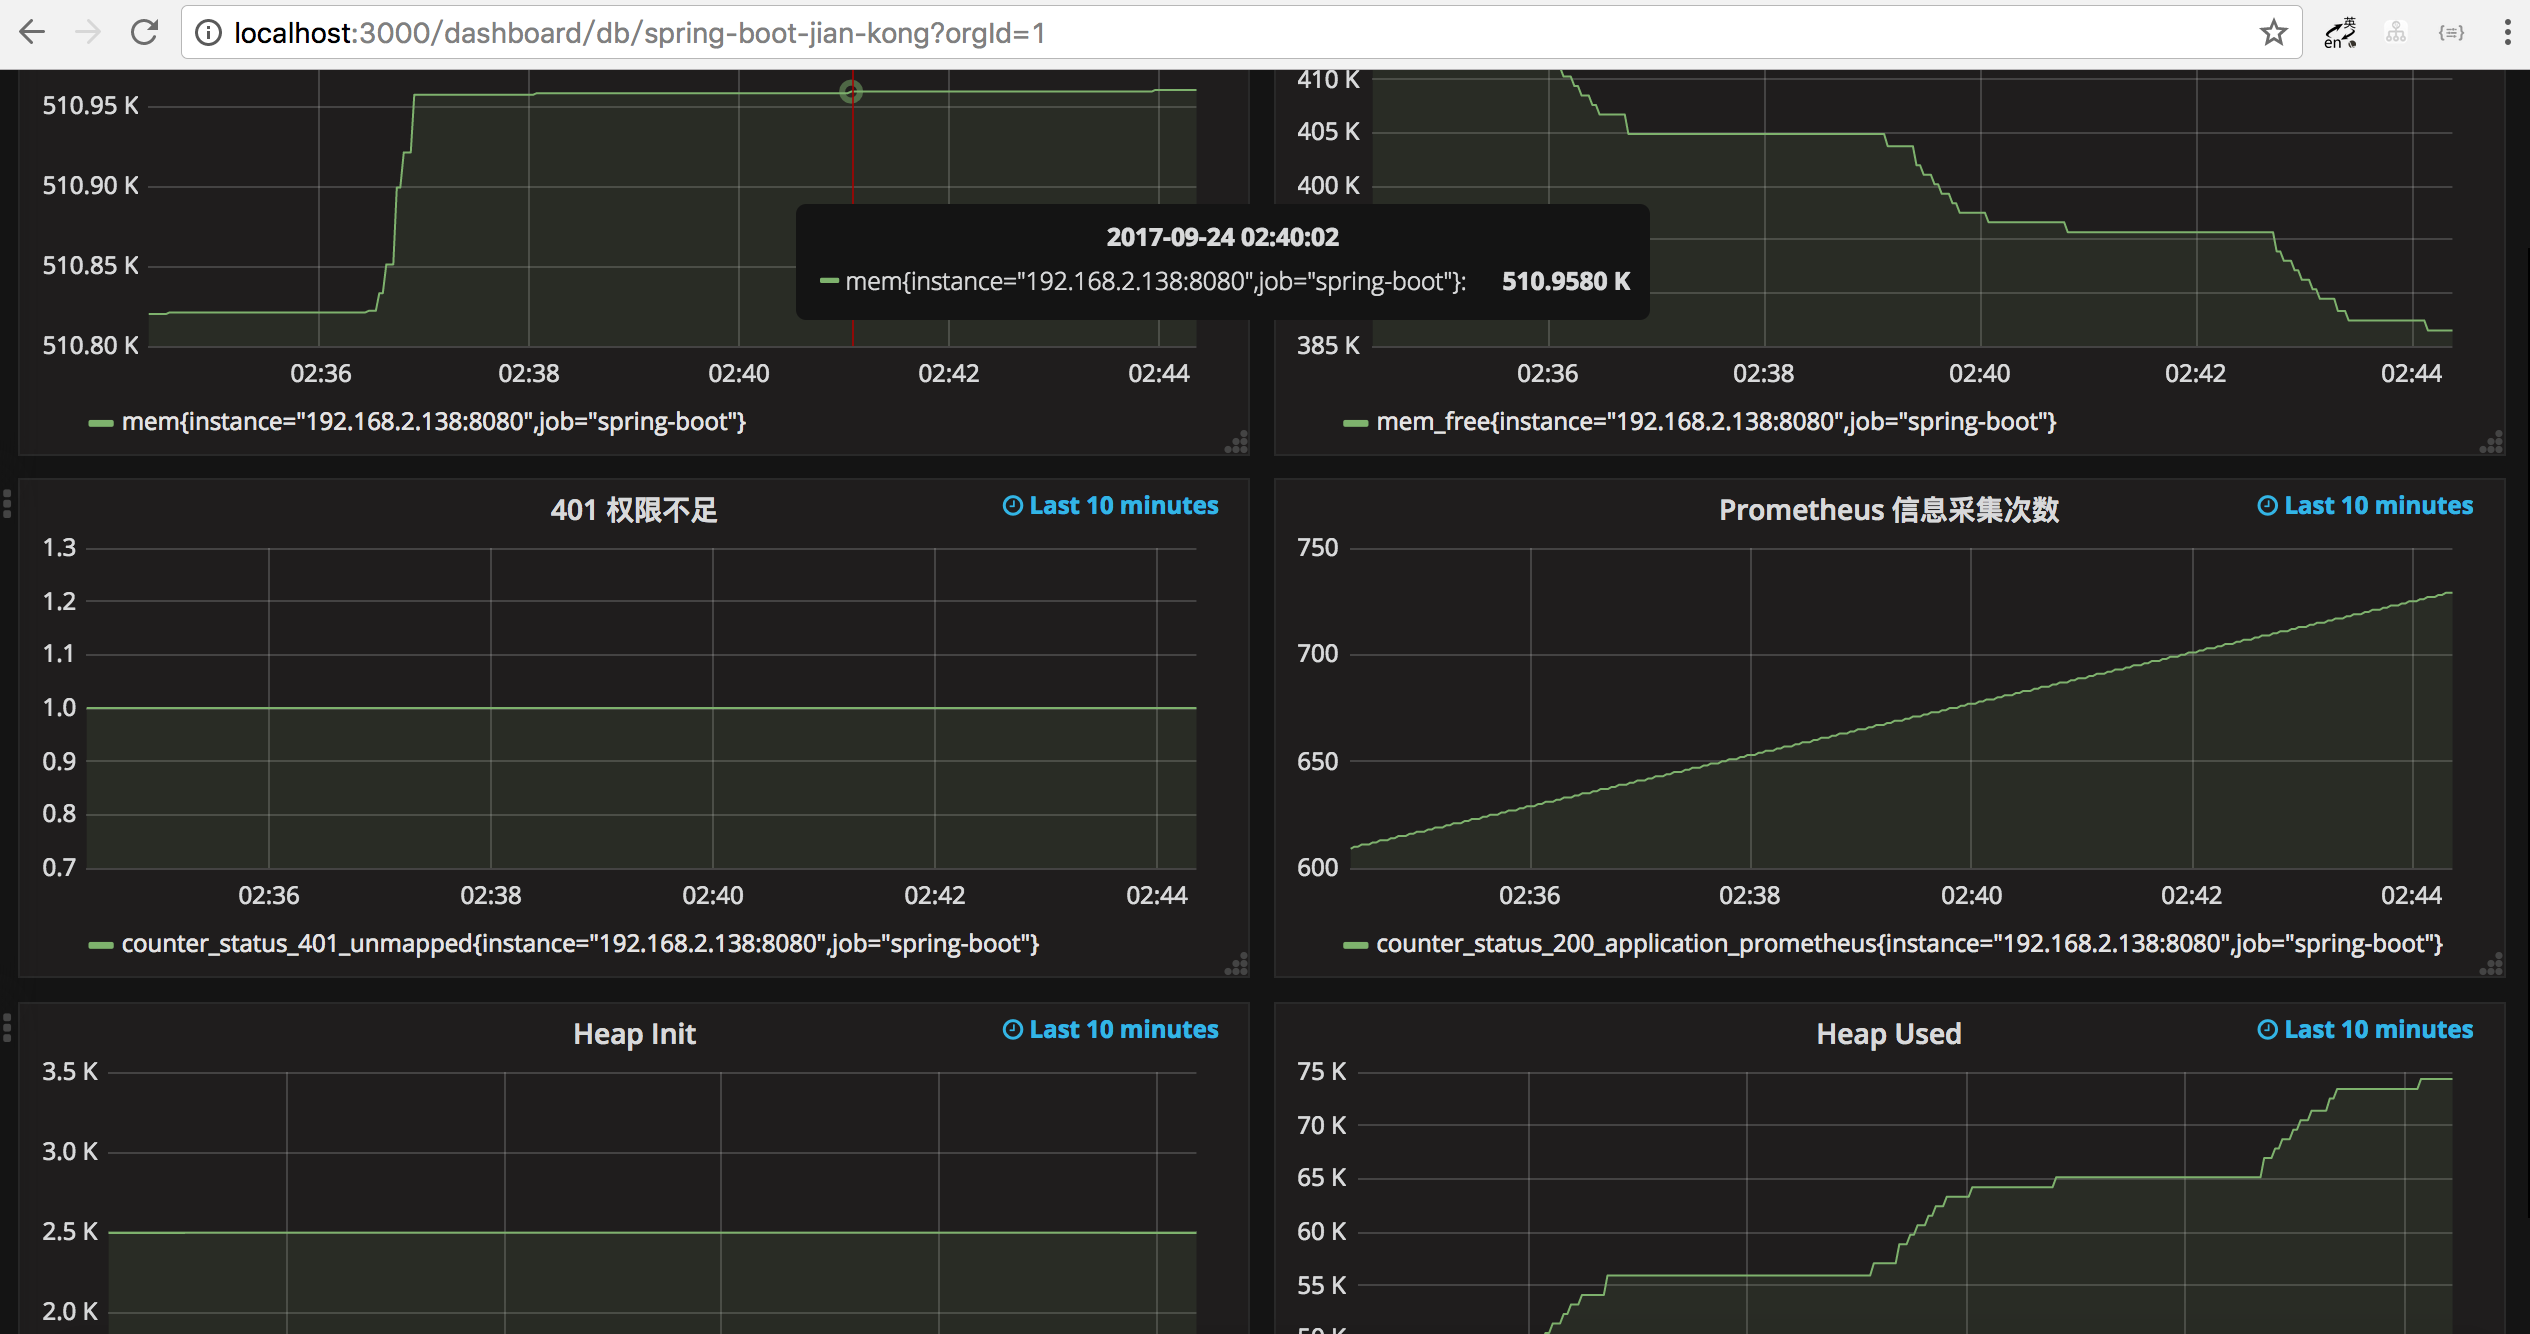
Grafana 監控界面
參考文檔
© 著作權歸作者所有,轉載或內容合作請聯繫作者

本文由博客一文多發平台 OpenWrite 發佈!


