記一次 .NET 某數控機床控制程式 卡死分析
一:背景
1. 講故事
前段時間有位朋友微信上找到我,說它的程式出現了卡死,讓我幫忙看下是怎麼回事? 說來也奇怪,那段時間求助卡死類的dump特別多,被迫訓練了一下對這類問題的洞察力 😄😄😄,再次聲明一下,我分析 dump 是免費的,沒有某軟高額的分析費用,你要問我圖什麼,圖技術的精進。
回到正題,卡死類的問題分析入口點在於主執行緒此時在做什麼,導致它不能處理自己的任務隊列的原因是各種各樣的,接下來上 windbg 分析一下。
二:WinDbg 分析
1. 主執行緒此時在做什麼
看主執行緒很簡單,直接一個 k 命令搞定。
0:000> k
 # ChildEBP RetAddr
00 00f3ec2c 74ef6439     ntdll!NtWaitForSingleObject+0xc
01 00f3ec2c 70293370     KERNELBASE!WaitForSingleObjectEx+0x99
02 00f3ec5c 702933cc     clr!CLREventWaitHelper2+0x33
03 00f3ecac 70293319     clr!CLREventWaitHelper+0x2a
04 00f3ece4 7037bbcf     clr!CLREventBase::WaitEx+0x14b
05 00f3ecfc 70374f08     clr!WKS::GCHeap::WaitUntilGCComplete+0x35
06 00f3ed44 7032c2a2     clr!Thread::RareDisablePreemptiveGC+0x20b
07 00f3edc8 6d453712     clr!JIT_RareDisableHelper+0x22
08 00f3ee4c 6d4530d1     System_Windows_Forms_ni!System.Windows.Forms.Application+ComponentManager.System.Windows.Forms.UnsafeNativeMethods.IMsoComponentManager.FPushMessageLoop(IntPtr, Int32, Int32)$##600550A+0x48e
09 00f3eea0 6d452f23     System_Windows_Forms_ni!System.Windows.Forms.Application+ThreadContext.RunMessageLoopInner(Int32, System.Windows.Forms.ApplicationContext)$##6005539+0x175
0a 00f3eecc 6d42b83d     System_Windows_Forms_ni!System.Windows.Forms.Application+ThreadContext.RunMessageLoop(Int32, System.Windows.Forms.ApplicationContext)$##6005538+0x4f
0b 00f3eee4 02d90c83     System_Windows_Forms_ni!System.Windows.Forms.Application.Run(System.Windows.Forms.Form)$##60005FA+0x35
...
從卦上資訊看,主執行緒正在等待(WaitUntilGCComplete) GC 處理完成,接下來看下是哪一個執行緒觸發了 GC 操作,並看下它正在 GC 三階段的哪一步?
0:000> !t
ThreadCount:      33
UnstartedThread:  3
BackgroundThread: 29
PendingThread:    3
DeadThread:       0
Hosted Runtime:   no
                                                                         Lock
       ID OSID ThreadOBJ    State GC Mode     GC Alloc Context  Domain   Count Apt Exception
   0    1 17a0 0113ecd0     26020 Preemptive  00000000:00000000 01139490 0     STA
   2    2 2074 0114e0e0     2b220 Preemptive  00000000:00000000 01139490 0     MTA (Finalizer)
   5    3 27f4 011ddaa8   102a220 Preemptive  00000000:00000000 01139490 0     MTA (Threadpool Worker)
   8    4 2568 05bf0b90   1029220 Cooperative 00000000:00000000 01139490 1     MTA (GC) (Threadpool Worker)

0:000> ~8s
eax=00000000 ebx=05bf0b90 ecx=00000000 edx=00000000 esi=00000000 edi=00000f6c
eip=77e5aa5c esp=098ce03c ebp=098ce0ac iopl=0         nv up ei pl nz na pe nc
cs=0023  ss=002b  ds=002b  es=002b  fs=0053  gs=002b             efl=00000206
ntdll!NtWaitForSingleObject+0xc:
77e5aa5c c20c00          ret     0Ch
0:008> k
 # ChildEBP RetAddr
00 098ce0ac 74ef6439     ntdll!NtWaitForSingleObject+0xc
01 098ce0ac 70293370     KERNELBASE!WaitForSingleObjectEx+0x99
02 098ce0dc 702933cc     clr!CLREventWaitHelper2+0x33
03 098ce12c 70293319     clr!CLREventWaitHelper+0x2a
04 098ce164 7029333b     clr!CLREventBase::WaitEx+0x14b
05 098ce17c 7032a9b7     clr!CLREventBase::Wait+0x1a
06 098ce1fc 7032a9ef     clr!`anonymous namespace'::CreateSuspendableThread+0x165
07 098ce378 704322bd     clr!GCToEEInterface::CreateThread+0x15c
08 098ce3a8 704332e5     clr!WKS::gc_heap::prepare_bgc_thread+0x36
09 098ce3a8 70378585     clr!WKS::gc_heap::garbage_collect+0x215
0a 098ce3c8 7037868a     clr!WKS::GCHeap::GarbageCollectGeneration+0x1bd
0b 098ce3ec 70378703     clr!WKS::gc_heap::trigger_gc_for_alloc+0x1f
0c 098ce424 70396f6a     clr!WKS::gc_heap::try_allocate_more_space+0x152
0d 098ce46c 70397311     clr!WKS::gc_heap::allocate_large_object+0x51
0e 098ce478 702fde2d     clr!WKS::GCHeap::AllocLHeap+0x11
0f 098ce494 7063f1af     clr!AllocLHeap+0x4b
10 098ce4e8 7028f598     clr!FastAllocatePrimitiveArray+0xa7
11 098ce58c 0e2d3fb6     clr!JIT_NewArr1+0x126
12 098cf26c 6f1f1b5a     0xe2d3fb6
13 098cf274 6f188604     mscorlib_ni!System.Runtime.CompilerServices.AsyncMethodBuilderCore+MoveNextRunner.InvokeMoveNext(System.Object)$##6006FCB+0x1a
...
從卦中的 clr!GCToEEInterface::CreateThread 方法看,如果你沒有這方面的分析經驗,或許你已經無能為力了,以我的經驗來說,既然卡死,那這裡的 CreateThread 自然無法創建成功,創建不成功的原因在於 進程載入鎖 LdrpLoaderLock 被別人持有了,導致它獲取不到這把鎖而一直茫然等待。
2. 誰持有了載入鎖
要想找到誰持有了載入鎖,可以在 ntdll 中搜 LdrpLoaderLock 欄位,接下來使用 x 命令搜索。
0:008> x ntdll!LdrpLoaderLock
77f053b8          ntdll!LdrpLoaderLock = <no type information>
0:008> !cs 77f053b8
-----------------------------------------
Critical section   = 0x77f053b8 (ntdll!LdrpLoaderLock+0x0)
DebugInfo          = 0x77f0573c
LOCKED
LockCount          = 0x0
WaiterWoken        = No
OwningThread       = 0x00001314
RecursionCount     = 0x1
LockSemaphore      = 0x0
SpinCount          = 0x04000000
從卦中的 OwningThread = 0x00001314 跡象看,當前是執行緒 1314 持有了載入鎖,看樣子是要一生一世的持有。。。。 難怪程式不卡死。。。。 接下來切到這個執行緒看看到底咋這麼痴情?
0:043> ~~[1314]s
eax=00000000 ebx=0589f784 ecx=00000000 edx=00000000 esi=00000000 edi=0589f770
eip=77e5c6bc esp=0589f72c ebp=0589f748 iopl=0         nv up ei pl nz na po nc
cs=0023  ss=002b  ds=002b  es=002b  fs=0053  gs=002b             efl=00000202
ntdll!NtWaitForAlertByThreadId+0xc:
77e5c6bc c20800          ret     8
0:043> kb
 # ChildEBP RetAddr      Args to Child
00 0589f748 77e1336b     0ad114e8 00000000 00000000 ntdll!NtWaitForAlertByThreadId+0xc
01 0589f748 77e50630     00000000 00000000 ffffffff ntdll!RtlpWaitOnAddressWithTimeout+0x33
02 0589f78c 77e13299     00000004 00000000 00000000 ntdll!RtlpWaitOnAddress+0xa5
03 0589f7c8 77e2ed76     00000000 0ad114e0 0ad114e4 ntdll!RtlpWaitOnCriticalSection+0xaf
04 0589f7f0 77e2ec99     0589f814 0ac5d1b4 0ad114e4 ntdll!RtlpEnterCriticalSectionContended+0xd6
05 0589f7f8 0ac5d1b4     0ad114e4 00000003 0ac50000 ntdll!RtlEnterCriticalSection+0x49
06 0589f814 0ac5a890     00001314 0acddd2a 0ac50000 fwlibe1!xxx+0x13e3
07 0589f83c 77e5a9f6     0ac50000 00000003 00000000 fwlibe1!xxx+0x290
...
從卦中看,當前是 fwlibe1 這個非託管dll 準備獲取 臨界區 時卡死,接下來可以用 !cs 把 臨界區變數 給提取出來看看到底誰在持有這個 臨界區變數。
0:043> !cs 0ad114e4
-----------------------------------------
Critical section   = 0x0ad114e4 (fwlibe1!xxxx+0x3A1C2)
DebugInfo          = 0x0ff43360
LOCKED
LockCount          = 0x2
WaiterWoken        = No
OwningThread       = 0x00002378
RecursionCount     = 0x1
LockSemaphore      = 0xFFFFFFFF
SpinCount          = 0x020007d0
從卦中可以清晰的看到,當前臨界區變數被 2378 號執行緒持有,接下來切到這個執行緒看看到底啥情況。
0:043> ~~[2378]s
eax=00000036 ebx=00002378 ecx=00000400 edx=00000157 esi=0ad114fc edi=0ad114e4
eip=0ac5cf88 esp=0caddf18 ebp=0cade7fc iopl=0         nv up ei pl nz na po nc
cs=0023  ss=002b  ds=002b  es=002b  fs=0053  gs=002b             efl=00000202
fwlibe1!xxx+0x11b7:
0ac5cf88 8d45f0          lea     eax,[ebp-10h]

0:028> k
 # ChildEBP RetAddr
WARNING: Stack unwind information not available. Following frames may be wrong.
00 0cade7fc 0ac5a8df     fwlibe1!xxx+0x11b7
01 0cade938 0ac5abae     fwlibe1!xxx+0x22
02 0cadea20 09417ccd     fwlibe1!xxx+0x17
03 0cadebfc 09412c11     0x9417ccd
04 0caded2c 6f1f1b5a     0x9412c11
05 0caded34 6f188604     mscorlib_ni!System.Runtime.CompilerServices.AsyncMethodBuilderCore+MoveNextRunner.InvokeMoveNext(System.Object)$##6006FCB+0x1a
...

0:028> !clrstack
OS Thread Id: 0x2378 (28)
Child SP       IP Call Site
0cade9b4 0ac5cf88 [InlinedCallFrame: 0cade9b4]
0cade998 0941a0e9 *** WARNING: Unable to verify checksum for System.Data.ni.dll
DomainBoundILStubClass.IL_STUB_PInvoke(System.Object, UInt16, Int32, UInt16 ByRef)
0cade9b4 09417ccd [InlinedCallFrame: 0cade9b4] Focas.xxx(System.Object, UInt16, Int32, UInt16 ByRef)
從卦中看,託管層調用了 Focas.xxx 函數進入了 fwlibe1.dll ,最後有一句 WARNING: Stack unwind information not available. Following frames may be wrong. ,可能是展開有一定的問題,不過排查到這裡,應該就是這個 Focas.xxx 的問題了。
3. 真相大白
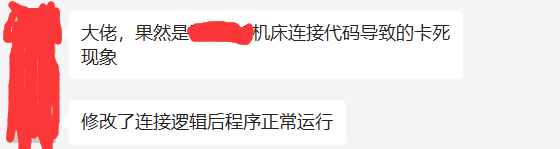
接下來將我的排查結果跟朋友回饋了下,朋友排查下來說是最近改了這裡面的連接方式所致,修改之後就搞定了。
三:總結
這個案例告訴我們:只要程式碼還能跑,就不要動它,它要是不動了,你得要做好動的準備。

