chapter2 線性回歸實現
1 導入包
import numpy as np
2 初始化模型參數
### 初始化模型參數
def initialize_params(dims):
    w = np.zeros((dims, 1))
    b = 0
    return w, b
3 損失函數計算
### 包括線性回歸公式、均方損失和參數偏導三部分
def linear_loss(X, y, w, b):
    num_train = X.shape[0]
    y_hat = np.dot(X, w) + b
    # 計算預測輸出與實際標籤之間的均方損失
    loss = np.sum((y_hat-y)**2)/num_train
    # 基於均方損失對權重參數的一階偏導數
    dw = 2*np.dot(X.T, (y_hat-y)) /num_train
    # 基於均方損失對偏差項的一階偏導數
    db = 2*np.sum((y_hat-y)) /num_train
    return y_hat, loss, dw, db
4 定義線性回歸模型訓練過程
### 定義線性回歸模型訓練過程
def linear_train(X, y, learning_rate=0.01, epochs=10000):
    loss_his = []
    # 初始化模型參數
    w, b = initialize_params(X.shape[1])
    for i in range(1, epochs):
        # 計算當前迭代的預測值、損失和梯度
        y_hat, loss, dw, db = linear_loss(X, y, w, b)
        # 基於梯度下降的參數更新
        w += -learning_rate * dw
        b += -learning_rate * db
        # 記錄當前迭代的損失
        loss_his.append(loss)
        # 每1000次迭代列印當前損失資訊
        if i % 10000 == 0:
            print('epoch %d loss %f' % (i, loss))
        params = {
            'w': w,
            'b': b
        }
        grads = {
            'dw': dw,
            'db': db
        }
    return loss_his, params, grads
5 導入數據集並劃分數據集
from sklearn.datasets import load_diabetes
from sklearn.utils import shuffle
diabetes = load_diabetes()
data, target = diabetes.data, diabetes.target
X, y = shuffle(data, target, random_state=13)
# 按照8/2劃分訓練集和測試集
offset = int(X.shape[0] * 0.8)
X_train, y_train = X[:offset], y[:offset].reshape((-1,1))
X_test, y_test = X[offset:], y[offset:].reshape((-1,1))
# 列印訓練集和測試集維度
print("X_train's shape: ", X_train.shape)
print("X_test's shape: ", X_test.shape)
print("y_train's shape: ", y_train.shape)
print("y_test's shape: ", y_test.shape)
結果:
X_train's shape:  (353, 10)
X_test's shape:  (89, 10)
y_train's shape:  (353, 1)
y_test's shape:  (89, 1)
6 線性回歸模型訓練
# 線性回歸模型訓練
loss_his, params, grads = linear_train(X_train, y_train, 0.01, 200000)
# 列印訓練後得到模型參數
print(params)
結果:
epoch 10000 loss 3219.178670
epoch 20000 loss 2944.940452
epoch 30000 loss 2848.052938
epoch 40000 loss 2806.628090
epoch 50000 loss 2788.051589
epoch 60000 loss 2779.411239
epoch 70000 loss 2775.230777
epoch 80000 loss 2773.107175
epoch 90000 loss 2771.957481
epoch 100000 loss 2771.281723
epoch 110000 loss 2770.843500
epoch 120000 loss 2770.528226
epoch 130000 loss 2770.278899
epoch 140000 loss 2770.066388
epoch 150000 loss 2769.875394
epoch 160000 loss 2769.697658
epoch 170000 loss 2769.528602
epoch 180000 loss 2769.365613
epoch 190000 loss 2769.207165
{'w': array([[   9.84972769],
       [-240.38803204],
       [ 491.45462983],
       [ 298.20492926],
       [ -87.77291402],
       [ -98.36201742],
       [-186.17374049],
       [ 177.38726503],
       [ 424.17405761],
       [  52.48952427]]), 'b': 150.8136201371859}
7 定義線性回歸預測函數
### 定義線性回歸預測函數
def predict(X, params):
    w = params['w']
    b = params['b']
    y_pred = np.dot(X, w) + b
    return y_pred
y_pred = predict(X_test, params)
8 定義R2係數函數
### 定義R2係數函數
def r2_score(y_test, y_pred):
    # 測試標籤均值
    y_avg = np.mean(y_test)
    # 總離差平方和
    ss_tot = np.sum((y_test - y_avg)**2)
    # 殘差平方和
    ss_res = np.sum((y_test - y_pred)**2)
    # R2計算
    r2 = 1 - (ss_res/ss_tot)
    return r2
print(r2_score(y_test, y_pred))
結果:
0.5349331079250876
9 可視化
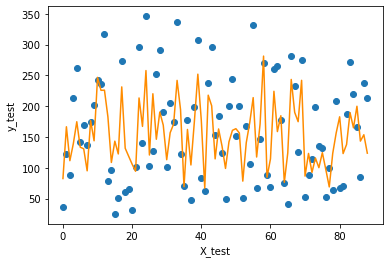
import matplotlib.pyplot as plt
f = X_test.dot(params['w']) + params['b']

plt.scatter(range(X_test.shape[0]), y_test)
plt.plot(f, color = 'darkorange')
plt.xlabel('X_test')
plt.ylabel('y_test')
plt.show();
結果:
plt.plot(loss_his, color = 'blue')
plt.xlabel('epochs')
plt.ylabel('loss')
plt.show()
結果:

10 手寫交叉驗證
from sklearn.utils import shuffle
X, y = shuffle(data, target, random_state=13)
X = X.astype(np.float32)
data = np.concatenate((X, y.reshape((-1,1))), axis=1)
data.shape
結果:
(442, 11)
from random import shuffle
def k_fold_cross_validation(items, k, randomize=True):
    if randomize:
        items = list(items)
        shuffle(items)
    slices = [items[i::k] for i in range(k)]
    for i in range(k):
        validation = slices[i]
        training = [item
                    for s in slices if s is not validation
                    for item in s]
        training = np.array(training)
        validation = np.array(validation)
        yield training, validation
for training, validation in k_fold_cross_validation(data, 5):
    X_train = training[:, :10]
    y_train = training[:, -1].reshape((-1,1))
    X_valid = validation[:, :10]
    y_valid = validation[:, -1].reshape((-1,1))
    loss5 = []
    #print(X_train.shape, y_train.shape, X_valid.shape, y_valid.shape)
    loss, params, grads = linear_train(X_train, y_train, 0.001, 100000)
    loss5.append(loss)
    score = np.mean(loss5)
    print('five kold cross validation score is', score)
    y_pred = predict(X_valid, params)
    valid_score = np.sum(((y_pred-y_valid)**2))/len(X_valid)
    print('valid score is', valid_score)
結果:
epoch 10000 loss 5092.953795
epoch 20000 loss 4625.210998
epoch 30000 loss 4280.106579
epoch 40000 loss 4021.857859
epoch 50000 loss 3825.526402
epoch 60000 loss 3673.689068
epoch 70000 loss 3554.135457
epoch 80000 loss 3458.274820
epoch 90000 loss 3380.033392
five kold cross validation score is 4095.209897465298
valid score is 3936.2234811935696
epoch 10000 loss 5583.270165
epoch 20000 loss 5048.748757
epoch 30000 loss 4655.620298
epoch 40000 loss 4362.817211
epoch 50000 loss 4141.575958
epoch 60000 loss 3971.714077
epoch 70000 loss 3839.037331
epoch 80000 loss 3733.533571
epoch 90000 loss 3648.114252
five kold cross validation score is 4447.019807745928
valid score is 2501.3520150018944
epoch 10000 loss 5200.950784
epoch 20000 loss 4730.397070
epoch 30000 loss 4382.133800
epoch 40000 loss 4120.944891
epoch 50000 loss 3922.113137
epoch 60000 loss 3768.255158
epoch 70000 loss 3647.113946
epoch 80000 loss 3550.018924
epoch 90000 loss 3470.811373
five kold cross validation score is 4191.91819552402
valid score is 3599.5500530218555
epoch 10000 loss 5392.825769
epoch 20000 loss 4859.145634
epoch 30000 loss 4465.914858
epoch 40000 loss 4172.706513
epoch 50000 loss 3951.112149
epoch 60000 loss 3781.128244
epoch 70000 loss 3648.633504
epoch 80000 loss 3543.627226
epoch 90000 loss 3458.998687
five kold cross validation score is 4256.231602795183
valid score is 3306.6604398106706
epoch 10000 loss 4991.290783
epoch 20000 loss 4547.454621
epoch 30000 loss 4219.702158
epoch 40000 loss 3974.018034
epoch 50000 loss 3786.721727
epoch 60000 loss 3641.292905
epoch 70000 loss 3526.175261
epoch 80000 loss 3433.256913
epoch 90000 loss 3356.818661
five kold cross validation score is 4043.189167421097
valid score is 4220.025355059865
11 導入數據集
from sklearn.datasets import load_diabetes
from sklearn.utils import shuffle
from sklearn.model_selection import train_test_split

diabetes = load_diabetes()
data = diabetes.data
target = diabetes.target
X, y = shuffle(data, target, random_state=13)
X = X.astype(np.float32)
y = y.reshape((-1, 1))
X_train, X_test, y_train, y_test = train_test_split(X, y, test_size=0.2, random_state=42)
print(X_train.shape, y_train.shape, X_test.shape, y_test.shape)
結果:
(353, 10) (353, 1) (89, 10) (89, 1)
11 sklearn實現,並可視化
import matplotlib.pyplot as plt
import numpy as np
from sklearn import linear_model
from sklearn.metrics import mean_squared_error, r2_score
regr = linear_model.LinearRegression()
regr.fit(X_train, y_train)
y_pred = regr.predict(X_test)
# The coefficients
print('Coefficients: \n', regr.coef_)
# The mean squared error
print("Mean squared error: %.2f"
      % mean_squared_error(y_test, y_pred))
# Explained variance score: 1 is perfect prediction
print('Variance score: %.2f' % r2_score(y_test, y_pred))
print(r2_score(y_test, y_pred))

# Plot outputs
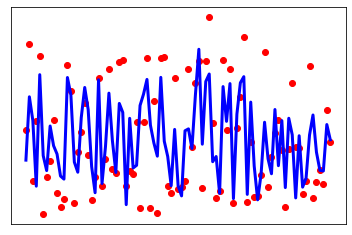
plt.scatter(range(X_test.shape[0]), y_test, color='red')
plt.plot(range(X_test.shape[0]), y_pred, color='blue', linewidth=3)
plt.xticks(())
plt.yticks(())
plt.show();
結果:
Coefficients:
 [[ -23.51037 -216.31213  472.36694  372.07175 -863.6967   583.2741
   105.79268  194.76984  754.073     38.2222 ]]
Mean squared error: 3028.50
Variance score: 0.53
0.5298198993375712
12 交叉驗證
from sklearn.model_selection import KFold
from sklearn.linear_model import LinearRegression
### 交叉驗證
def cross_validate(model, x, y, folds=5, repeats=5):
    ypred = np.zeros((len(y),repeats))
    score = np.zeros(repeats)
    for r in range(repeats):
        i=0
        print('Cross Validating - Run', str(r + 1), 'out of', str(repeats))
        x,y = shuffle(x, y, random_state=r) #shuffle data before each repeat
        kf = KFold(n_splits=folds,random_state=i+1000,shuffle=True) #random split, different each time
        for train_ind, test_ind in kf.split(x):
            print('Fold', i+1, 'out of', folds)
            xtrain,ytrain = x[train_ind,:],y[train_ind]
            xtest,ytest = x[test_ind,:],y[test_ind]
            model.fit(xtrain, ytrain)
            #print(xtrain.shape, ytrain.shape, xtest.shape, ytest.shape)
            ypred[test_ind]=model.predict(xtest)
            i+=1
        score[r] = r2_score(ypred[:,r],y)
    print('\nOverall R2:',str(score))
    print('Mean:',str(np.mean(score)))
    print('Deviation:',str(np.std(score)))
    pass

cross_validate(regr, X, y, folds=5, repeats=5)
結果:
Cross Validating - Run 1 out of 5
Fold 1 out of 5
Fold 2 out of 5
Fold 3 out of 5
Fold 4 out of 5
Fold 5 out of 5
Cross Validating - Run 2 out of 5
Fold 1 out of 5
Fold 2 out of 5
Fold 3 out of 5
Fold 4 out of 5
Fold 5 out of 5
Cross Validating - Run 3 out of 5
Fold 1 out of 5
Fold 2 out of 5
Fold 3 out of 5
Fold 4 out of 5
Fold 5 out of 5
Cross Validating - Run 4 out of 5
Fold 1 out of 5
Fold 2 out of 5
Fold 3 out of 5
Fold 4 out of 5
Fold 5 out of 5
Cross Validating - Run 5 out of 5
Fold 1 out of 5
Fold 2 out of 5
Fold 3 out of 5
Fold 4 out of 5
Fold 5 out of 5

Overall R2: [0.03209418 0.04484132 0.02542677 0.01093105 0.02690136]
Mean: 0.028038935700747846
Deviation: 0.010950454328955226

