你不知道的Canvas(二)
- 2019 年 11 月 5 日
- 筆記
你不知道的Canvas(二)
一、色彩Colors
到目前為止,我們只看到過繪製內容的方法。如果我們想要給圖形上色,有兩個重要的屬性可以做到:fillStyle 和 strokeStyle。
fillStyle = color設置圖形的填充顏色。
strokeStyle = color設置圖形輪廓的顏色。
color 可以是表示 CSS 顏色值的字元串,漸變對象或者圖案對象。默認情況下,線條和填充顏色都是黑色(CSS 顏色值 #000000)。
輸入的應該是符合 CSS3 顏色值標準 的有效字元串。下面的例子都表示同一種顏色。
// 這些 fillStyle 的值均為 '橙色' ctx.fillStyle = "orange"; ctx.fillStyle = "#FFA500"; ctx.fillStyle = "rgb(255,165,0)"; ctx.fillStyle = "rgba(255,165,0,1)";1.fillStyle--調色板
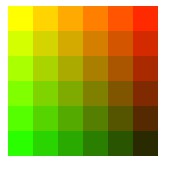
在本示例里,用兩層 for 循環來繪製方格陣列,每個方格不同的顏色。結果如右圖,但實現所用的程式碼卻沒那麼絢麗。我用了兩個變數 i 和 j 來為每一個方格產生唯一的 RGB 色彩值,其中僅修改紅色和綠色通道的值,而保持藍色通道的值不變。你可以通過修改這些顏色通道的值來產生各種各樣的色板。通過增加漸變的頻率,你還可以繪製出類似 Photoshop 裡面的那樣的調色板。
<!DOCTYPE html> <!--[if lt IE 7]> <html class="no-js lt-ie9 lt-ie8 lt-ie7"> <![endif]--> <!--[if IE 7]> <html class="no-js lt-ie9 lt-ie8"> <![endif]--> <!--[if IE 8]> <html class="no-js lt-ie9"> <![endif]--> <!--[if gt IE 8]><!--> <html class="no-js"> <!--<![endif]--> <head> <meta charset="utf-8"> <meta http-equiv="X-UA-Compatible" content="IE=edge"> <title></title> <meta name="description" content=""> <meta name="viewport" content="width=device-width, initial-scale=1"> <link rel="stylesheet" href=""> <script type="text/javascript"> function draw() { var ctx = document.getElementById('myCanvas').getContext('2d'); for (var i = 0; i < 6; i++) { for (var j = 0; j < 6; j++) { ctx.fillStyle = 'rgb(' + Math.floor(255 - 42.5 * i) + ',' + Math.floor(255 - 42.5 * j) + ',0)'; ctx.fillRect(j * 25, i * 25, 25, 25) } } } </script> </head> <body onload="draw();"> <!--[if lt IE 7]> <p class="browsehappy">You are using an <strong>outdated</strong> browser. Please <a href="#">upgrade your browser</a> to improve your experience.</p> <![endif]--> <canvas id="myCanvas" width="150" height="150"></canvas> <script src="" async defer></script> </body> </html>效果如圖所示:
2. strokeStyle--arc多彩圓圈
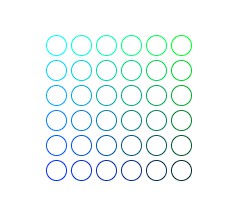
這個示例與上面的有點類似,但這次用到的是 strokeStyle 屬性,畫的不是方格,而是用 arc 方法來畫圓。
<!DOCTYPE html> <!--[if lt IE 7]> <html class="no-js lt-ie9 lt-ie8 lt-ie7"> <![endif]--> <!--[if IE 7]> <html class="no-js lt-ie9 lt-ie8"> <![endif]--> <!--[if IE 8]> <html class="no-js lt-ie9"> <![endif]--> <!--[if gt IE 8]><!--> <html class="no-js"> <!--<![endif]--> <head> <meta charset="utf-8"> <meta http-equiv="X-UA-Compatible" content="IE=edge"> <title></title> <meta name="description" content=""> <meta name="viewport" content="width=device-width, initial-scale=1"> <link rel="stylesheet" href=""> <script type="text/javascript"> function draw() { var canvas = document.getElementById('myCanvas'); if (canvas.getContext) { var ctx = canvas.getContext('2d'); for (var i = 0; i < 6; i++) { for (var j = 0; j < 6; j++) { ctx.strokeStyle = 'rgb(0,' + Math.floor(255 - 42.5 * i) + ',' + Math.floor(255 - 42.5 * j) + ')'; ctx.beginPath(); ctx.arc(12.5 + j * 25, 12.5 + i * 25, 10, 0, Math.PI * 2, true); ctx.stroke(); } } } } </script> </head> <body onload="draw()"> <!--[if lt IE 7]> <p class="browsehappy">You are using an <strong>outdated</strong> browser. Please <a href="#">upgrade your browser</a> to improve your experience.</p> <![endif]--> <canvas id="myCanvas" width="150" height="150" style="margin: 100px 100px;"></canvas> <script src="" async defer></script> </body> </html>效果如圖所示:
二、透明度Transparency
除了可以繪製實色圖形,我們還可以用 canvas 來繪製半透明的圖形。通過設置 globalAlpha 屬性或者使用一個半透明顏色作為輪廓或填充的樣式。
globalAlpha = transparencyValue這個屬性影響到 canvas 里所有圖形的透明度,有效的值範圍是 0.0 (完全透明)到 1.0(完全不透明),默認是 1.0。
globalAlpha 屬性在需要繪製大量擁有相同透明度的圖形時候相當高效。不過,我認為下面的方法可操作性更強一點。
因為 strokeStyle 和 fillStyle 屬性接受符合 CSS 3 規範的顏色值,那我們可以用下面的寫法來設置具有透明度的顏色。
// 指定透明顏色,用於描邊和填充樣式 ctx.strokeStyle = "rgba(255,0,0,0.5)"; ctx.fillStyle = "rgba(255,0,0,0.5)";rgba()方法與 rgb()方法類似,就多了一個用於設置色彩透明度的參數。它的有效範圍是從 0.0(完全透明)到 1.0(完全不透明)。
1. globalAlpha--輻射半透明圓四色格
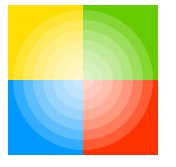
在這個例子里,將用四色格作為背景,設置 globalAlpha 為 0.2 後,在上面畫一系列半徑遞增的半透明圓。最終結果是一個徑向漸變效果。圓疊加得越多,原先所畫的圓的透明度會越低。通過增加循環次數,畫更多的圓,從中心到邊緣部分,背景圖會呈現逐漸消失的效果。
<!DOCTYPE html> <!--[if lt IE 7]> <html class="no-js lt-ie9 lt-ie8 lt-ie7"> <![endif]--> <!--[if IE 7]> <html class="no-js lt-ie9 lt-ie8"> <![endif]--> <!--[if IE 8]> <html class="no-js lt-ie9"> <![endif]--> <!--[if gt IE 8]><!--> <html class="no-js"> <!--<![endif]--> <head> <meta charset="utf-8"> <meta http-equiv="X-UA-Compatible" content="IE=edge"> <title></title> <meta name="description" content=""> <meta name="viewport" content="width=device-width, initial-scale=1"> <link rel="stylesheet" href=""> <script type="text/javascript"> function draw() { var canvas = document.getElementById('myCanvas'); if (canvas.getContext) { var ctx = canvas.getContext('2d'); // 畫背景 ctx.fillStyle = '#FD0'; ctx.fillRect(0, 0, 75, 75); ctx.fillStyle = '#6C0'; ctx.fillRect(75, 0, 75, 75); ctx.fillStyle = '#09F'; ctx.fillRect(0, 75, 75, 75); ctx.fillStyle = '#F30'; ctx.fillRect(75, 75, 75, 75); ctx.fillStyle = '#FFF'; // 設置透明度值 ctx.globalAlpha = 0.2; // 畫半透明圓 for (var i = 0; i < 7; i++) { ctx.beginPath(); ctx.arc(75, 75, 10 + 10 * i, 0, Math.PI * 2, true); ctx.fill(); } } } </script> </head> <body onload="draw();"> <!--[if lt IE 7]> <p class="browsehappy">You are using an <strong>outdated</strong> browser. Please <a href="#">upgrade your browser</a> to improve your experience.</p> <![endif]--> <canvas id="myCanvas" width="150" height="150"></canvas> <script src="" async defer></script> </body> </html>效果如圖所示:
2. rgba--四色輻射矩形格
<!DOCTYPE html> <!--[if lt IE 7]> <html class="no-js lt-ie9 lt-ie8 lt-ie7"> <![endif]--> <!--[if IE 7]> <html class="no-js lt-ie9 lt-ie8"> <![endif]--> <!--[if IE 8]> <html class="no-js lt-ie9"> <![endif]--> <!--[if gt IE 8]><!--> <html class="no-js"> <!--<![endif]--> <head> <meta charset="utf-8"> <meta http-equiv="X-UA-Compatible" content="IE=edge"> <title></title> <meta name="description" content=""> <meta name="viewport" content="width=device-width, initial-scale=1"> <link rel="stylesheet" href=""> <script type="text/javascript"> function draw() { var canvas = document.getElementById('myCanvas'); if (canvas.getContext) { var ctx = canvas.getContext('2d'); // 畫背景 ctx.fillStyle = 'rgb(255,221,0)'; ctx.fillRect(0, 0, 150, 37.5); ctx.fillStyle = 'rgb(102,204,0)'; ctx.fillRect(0, 37.5, 150, 37.5); ctx.fillStyle = 'rgb(0,153,255)'; ctx.fillRect(0, 75, 150, 37.5); ctx.fillStyle = 'rgb(255,51,0)'; ctx.fillRect(0, 112.5, 150, 37.5); // 畫半透明矩形 for (var i = 0; i < 10; i++) { ctx.fillStyle = 'rgba(255,255,255,' + (i + 1) / 10 + ')'; for (var j = 0; j < 4; j++) { ctx.fillRect(5 + i * 14, 5 + j * 37.5, 14, 27.5) } } } } </script> </head> <body onload="draw();"> <!--[if lt IE 7]> <p class="browsehappy">You are using an <strong>outdated</strong> browser. Please <a href="#">upgrade your browser</a> to improve your experience.</p> <![endif]--> <canvas id="myCanvas" width="150" height="150"></canvas> <script src="" async defer></script> </body> </html>效果如圖所示:

三、線型Line Style
可以通過一系列屬性來設置線的樣式。
lineWidth = value設置線條寬度。
lineCap = type設置線條末端樣式。
lineJoin = type設定線條與線條間接合處的樣式。
miterLimit = value限制當兩條線相交時交接處最大長度;所謂交接處長度(斜接長度)是指線條交接處內角頂點到外角頂點的長度。
getLineDash()返回一個包含當前虛線樣式,長度為非負偶數的數組。
setLineDash(segments)設置當前虛線樣式。
lineDashOffset = value設置虛線樣式的起始偏移量。
通過以下的樣例可能會更加容易理解。
1. lineWidth 屬性的例子
這個屬性設置當前繪線的粗細。屬性值必須為正數。默認值是1.0。
線寬是指給定路徑的中心到兩邊的粗細。換句話說就是在路徑的兩邊各繪製線寬的一半。因為畫布的坐標並不和像素直接對應,當需要獲得精確的水平或垂直線的時候要特別注意。
在下面的例子中,用遞增的寬度繪製了10條直線。最左邊的線寬1.0單位。並且,最左邊的以及所有寬度為奇數的線並不能精確呈現,這就是因為路徑的定位問題。
<!DOCTYPE html> <!--[if lt IE 7]> <html class="no-js lt-ie9 lt-ie8 lt-ie7"> <![endif]--> <!--[if IE 7]> <html class="no-js lt-ie9 lt-ie8"> <![endif]--> <!--[if IE 8]> <html class="no-js lt-ie9"> <![endif]--> <!--[if gt IE 8]><!--> <html class="no-js"> <!--<![endif]--> <head> <meta charset="utf-8"> <meta http-equiv="X-UA-Compatible" content="IE=edge"> <title></title> <meta name="description" content=""> <meta name="viewport" content="width=device-width, initial-scale=1"> <link rel="stylesheet" href=""> <script type="text/javascript"> function draw() { var ctx = document.getElementById('myCanvas').getContext('2d'); for (var i = 0; i < 10; i++) { ctx.beginPath(); ctx.lineWidth = 1 + i; ctx.moveTo(5 + i * 14, 5); ctx.lineTo(5 + i * 14, 140); ctx.stroke(); } } </script> </head> <body onload="draw();"> <!--[if lt IE 7]> <p class="browsehappy">You are using an <strong>outdated</strong> browser. Please <a href="#">upgrade your browser</a> to improve your experience.</p> <![endif]--> <canvas id="myCanvas" width="150" height="150"></canvas> <script src="" async defer></script> </body> </html>效果如圖所示:

2. lineCap 屬性的例子
 屬性
lineCap 的值決定了線段端點顯示的樣子。它可以為下面的三種的其中之一:butt,round 和 square。默認是 butt。
在這個例子裡面,我繪製了三條直線,分別賦予不同的 lineCap 值。還有兩條輔助線,為了可以看得更清楚它們之間的區別,三條線的起點終點都落在輔助線上。
最左邊的線用了默認的 butt 。可以注意到它是與輔助線齊平的。中間的是 round 的效果,端點處加上了半徑為一半線寬的半圓。右邊的是 square 的效果,端點處加上了等寬且高度為一半線寬的方塊。
<!DOCTYPE html> <!--[if lt IE 7]> <html class="no-js lt-ie9 lt-ie8 lt-ie7"> <![endif]--> <!--[if IE 7]> <html class="no-js lt-ie9 lt-ie8"> <![endif]--> <!--[if IE 8]> <html class="no-js lt-ie9"> <![endif]--> <!--[if gt IE 8]><!--> <html class="no-js"> <!--<![endif]--> <head> <meta charset="utf-8"> <meta http-equiv="X-UA-Compatible" content="IE=edge"> <title></title> <meta name="description" content=""> <meta name="viewport" content="width=device-width, initial-scale=1"> <link rel="stylesheet" href=""> <script type="text/javascript"> function draw() { var ctx = document.getElementById('myCanvas').getContext('2d'); var lineCap = ['butt', 'round', 'square']; // 創建路徑 ctx.strokeStyle = '#09f'; ctx.beginPath(); ctx.moveTo(10, 10); ctx.lineTo(140, 10); ctx.moveTo(10, 140); ctx.lineTo(140, 140); ctx.stroke(); // 畫線條 ctx.strokeStyle = 'black'; for (var i = 0; i < lineCap.length; i++) { ctx.lineWidth = 15; ctx.lineCap = lineCap[i]; ctx.beginPath(); ctx.moveTo(25 + i * 50, 10); ctx.lineTo(25 + i * 50, 140); ctx.stroke(); } } </script> </head> <body onload="draw();"> <!--[if lt IE 7]> <p class="browsehappy">You are using an <strong>outdated</strong> browser. Please <a href="#">upgrade your browser</a> to improve your experience.</p> <![endif]--> <canvas id="myCanvas" width="150" height="150"></canvas> <script src="" async defer></script> </body> </html>3. lineJoin屬性的例子

lineJoin 的屬性值決定了圖形中兩線段連接處所顯示的樣子。它可以是這三種之一:round, bevel 和 miter。默認是 miter``。
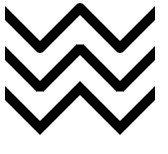
這裡我同樣用三條折線來做例子,分別設置不同的 lineJoin 值。最上面一條是 round 的效果,邊角處被磨圓了,圓的半徑等於線寬。中間和最下面一條分別是 bevel 和 miter 的效果。當值是 miter的時候,線段會在連接處外側延伸直至交於一點,延伸效果受到下面將要介紹的 miterLimit 屬性的制約。
<!DOCTYPE html> <!--[if lt IE 7]> <html class="no-js lt-ie9 lt-ie8 lt-ie7"> <![endif]--> <!--[if IE 7]> <html class="no-js lt-ie9 lt-ie8"> <![endif]--> <!--[if IE 8]> <html class="no-js lt-ie9"> <![endif]--> <!--[if gt IE 8]><!--> <html class="no-js"> <!--<![endif]--> <head> <meta charset="utf-8"> <meta http-equiv="X-UA-Compatible" content="IE=edge"> <title></title> <meta name="description" content=""> <meta name="viewport" content="width=device-width, initial-scale=1"> <link rel="stylesheet" href=""> <script type="text/javascript"> function draw() { var ctx = document.getElementById('myCanvas').getContext('2d'); var lineJoin = ['round', 'bevel', 'miter']; ctx.lineWidth = 10; for (var i = 0; i < lineJoin.length; i++) { ctx.lineJoin = lineJoin[i]; ctx.beginPath(); ctx.moveTo(-5, 5 + i * 40); ctx.lineTo(35, 45 + i * 40); ctx.lineTo(75, 5 + i * 40); ctx.lineTo(115, 45 + i * 40); ctx.lineTo(155, 5 + i * 40); ctx.stroke(); } } </script> </head> <body onload="draw();"> <!--[if lt IE 7]> <p class="browsehappy">You are using an <strong>outdated</strong> browser. Please <a href="#">upgrade your browser</a> to improve your experience.</p> <![endif]--> <canvas id="myCanvas" width="150" height="150"></canvas> <script src="" async defer></script> </body> </html>效果如圖所示:
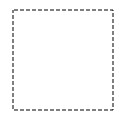
4. 使用虛線
用 setLineDash 方法和 lineDashOffset 屬性來制定虛線樣式. setLineDash 方法接受一個數組,來指定線段與間隙的交替;lineDashOffset屬性設置起始偏移量.
在這個例子中,我們要創建一個螞蟻線的效果。它往往應用在電腦圖形程式選區工具動效中。它可以幫助用戶通過動畫的邊界來區分影像背景選區邊框。
四、漸變Gradients
就好像一般的繪圖軟體一樣,我們可以用線性或者徑向的漸變來填充或描邊。我們用下面的方法新建一個 canvasGradient 對象,並且賦給圖形的 fillStyle 或 strokeStyle 屬性。
createLinearGradient(x1, y1, x2, y2)createLinearGradient 方法接受 4 個參數,表示漸變的起點 (x1,y1) 與終點 (x2,y2)。
createRadialGradient(x1, y1, r1, x2, y2, r2)createRadialGradient 方法接受 6 個參數,前三個定義一個以 (x1,y1) 為原點,半徑為 r1 的圓,後三個參數則定義另一個以 (x2,y2) 為原點,半徑為 r2 的圓。
var lineargradient = ctx.createLinearGradient(0,0,150,150); var radialgradient = ctx.createRadialGradient(75,75,0,75,75,100);創建出 canvasGradient 對象後,我們就可以用 addColorStop 方法給它上色了。
gradient.addColorStop(position, color)addColorStop 方法接受 2 個參數,
position參數必須是一個 0.0 與 1.0 之間的數值,表示漸變中顏色所在的相對位置。例如,0.5 表示顏色會出現在正中間。color參數必須是一個有效的 CSS 顏色值(如 #FFF, rgba(0,0,0,1),等等)。
你可以根據需要添加任意多個色標(color stops)。下面是最簡單的線性黑白漸變的例子。
var lineargradient = ctx.createLinearGradient(0,0,150,150); lineargradient.addColorStop(0,'white'); lineargradient.addColorStop(1,'black');1.createLinearGradient 的例子

本例中,有兩種不同的漸變。第一種是背景色漸變,你會發現,我給同一位置設置了兩種顏色,你也可以用這來實現突變的效果,就像這裡從白色到綠色的突變。一般情況下,色標的定義是無所謂順序的,但是色標位置重複時,順序就變得非常重要了。所以,保持色標定義順序和它理想的順序一致,結果應該沒什麼大問題。
第二種漸變,我並不是從 0.0 位置開始定義色標,因為那並不是那麼嚴格的。在 0.5 處設一黑色色標,漸變會默認認為從起點到色標之間都是黑色。
你會發現,strokeStyle 和 fillStyle 屬性都可以接受 canvasGradient 對象。
2. createRadialGradient的例子
這個例子,我定義了 4 個不同的徑向漸變。由於可以控制漸變的起始與結束點,所以我們可以實現一些比(如在 Photoshop 中所見的)經典的徑向漸變更為複雜的效果。(經典的徑向漸變是只有一個中心點,簡單地由中心點向外圍的圓形擴張)
<!DOCTYPE html> <!--[if lt IE 7]> <html class="no-js lt-ie9 lt-ie8 lt-ie7"> <![endif]--> <!--[if IE 7]> <html class="no-js lt-ie9 lt-ie8"> <![endif]--> <!--[if IE 8]> <html class="no-js lt-ie9"> <![endif]--> <!--[if gt IE 8]><!--> <html class="no-js"> <!--<![endif]--> <head> <meta charset="utf-8"> <meta http-equiv="X-UA-Compatible" content="IE=edge"> <title></title> <meta name="description" content=""> <meta name="viewport" content="width=device-width, initial-scale=1"> <link rel="stylesheet" href=""> <script type="text/javascript"> function draw() { var canvas = document.getElementById('myCanvas'); var ctx = canvas.getContext('2d'); // 創建漸變 var radgrad = ctx.createRadialGradient(45, 45, 10, 52, 50, 30); radgrad.addColorStop(0, '#A7D30C'); radgrad.addColorStop(0.9, '#019F62'); radgrad.addColorStop(1, 'rgba(1,159,98,0)'); var radgrad2 = ctx.createRadialGradient(105, 105, 20, 112, 120, 50); radgrad2.addColorStop(0, '#FF5F98'); radgrad2.addColorStop(0.75, '#FF0188'); radgrad2.addColorStop(1, 'rgba(255,1,136,0)'); var radgrad3 = ctx.createRadialGradient(95, 15, 15, 102, 20, 40); radgrad3.addColorStop(0, '#00C9FF'); radgrad3.addColorStop(0.8, '#00B5E2'); radgrad3.addColorStop(1, 'rgba(0,201,255,0)'); var radgrad4 = ctx.createRadialGradient(0, 150, 50, 0, 140, 90); radgrad4.addColorStop(0, '#F4F201'); radgrad4.addColorStop(0.8, '#E4C700'); radgrad4.addColorStop(1, 'rgba(228,199,0,0)'); // 畫圖形 ctx.fillStyle = radgrad4; ctx.fillRect(0, 0, 150, 150); ctx.fillStyle = radgrad3; ctx.fillRect(0, 0, 150, 150); ctx.fillStyle = radgrad2; ctx.fillRect(0, 0, 150, 150); ctx.fillStyle = radgrad; ctx.fillRect(0, 0, 150, 150); } </script> </head> <body onload="draw();"> <!--[if lt IE 7]> <p class="browsehappy">You are using an <strong>outdated</strong> browser. Please <a href="#">upgrade your browser</a> to improve your experience.</p> <![endif]--> <canvas id="myCanvas" width="150" height="150"></canvas> <script src="" async defer></script> </body> </html>效果如圖所示:

這裡,我讓起點稍微偏離終點,這樣可以達到一種球狀 3D 效果。但最好不要讓里圓與外圓部分交疊,那樣會產生什麼效果就真是不得而知了。
4 個徑向漸變效果的最後一個色標都是透明色。如果想要兩色標直接的過渡柔和一些,只要兩個顏色值一致就可以了。程式碼裡面看不出來,是因為我用了兩種不同的顏色表示方法,但其實是相同的,#019F62 = rgba(1,159,98,1)。
五、圖案樣式Patterns
上面的一個例子裡面,我用了循環來實現圖案的效果。其實,有一個更加簡單的方法:createPattern。
createPattern(image, type)該方法接受兩個參數。Image 可以是一個
Image對象的引用,或者另一個 canvas 對象。Type必須是下面的字元串值之一:repeat,repeat-x,repeat-y和no-repeat。
注意: 用 canvas 對象作為 Image 參數在 Firefox 1.5 (Gecko 1.8) 中是無效的。
圖案的應用跟漸變很類似的,創建出一個 pattern 之後,賦給 fillStyle 或 strokeStyle 屬性即可。
var img = new Image(); img.src = 'someimage.png'; var ptrn = ctx.createPattern(img,'repeat');注意:與 drawImage 有點不同,你需要確認 image 對象已經裝載完畢,否則圖案可能效果不對的。
1. createPattern的例子
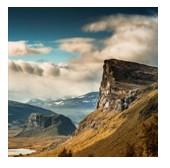
在最後的例子中,我創建一個圖案然後賦給了 fillStyle 屬性。唯一要注意的是,使用 Image 對象的 onload handler 來確保設置圖案之前影像已經裝載完畢。
<!DOCTYPE html> <!--[if lt IE 7]> <html class="no-js lt-ie9 lt-ie8 lt-ie7"> <![endif]--> <!--[if IE 7]> <html class="no-js lt-ie9 lt-ie8"> <![endif]--> <!--[if IE 8]> <html class="no-js lt-ie9"> <![endif]--> <!--[if gt IE 8]><!--> <html class="no-js"> <!--<![endif]--> <head> <meta charset="utf-8"> <meta http-equiv="X-UA-Compatible" content="IE=edge"> <title></title> <meta name="description" content=""> <meta name="viewport" content="width=device-width, initial-scale=1"> <link rel="stylesheet" href=""> <script type="text/javascript"> function draw() { var canvas = document.getElementById('myCanvas'); var ctx = canvas.getContext('2d'); //創建新Image對象,用做圖案 var img = new Image(); img.src = 'https://pic.cnblogs.com/avatar/1489272/20190625145401.png'; img.onload = function() { //創建圖案 var pattern = ctx.createPattern(img, "repeat"); ctx.fillStyle = pattern; ctx.fillRect(0, 0, 150, 150); } } </script> </head> <body onload="draw();"> <!--[if lt IE 7]> <p class="browsehappy">You are using an <strong>outdated</strong> browser. Please <a href="#">upgrade your browser</a> to improve your experience.</p> <![endif]--> <canvas id="myCanvas" width="150" height="150"> </canvas> <script src="" async defer></script> </body> </html>效果如圖所示:
六、陰影Shadows
shadowOffsetX = float
shadowOffsetX 和 shadowOffsetY用來設定陰影在 X 和 Y 軸的延伸距離,它們是不受變換矩陣所影響的。負值表示陰影會往上或左延伸,正值則表示會往下或右延伸,它們默認都為 0。
shadowOffsetY = float
shadowOffsetX 和 shadowOffsetY用來設定陰影在 X 和 Y 軸的延伸距離,它們是不受變換矩陣所影響的。負值表示陰影會往上或左延伸,正值則表示會往下或右延伸,它們默認都為 0。
shadowBlur = float
shadowBlur 用於設定陰影的模糊程度,其數值並不跟像素數量掛鉤,也不受變換矩陣的影響,默認為 0。
shadowColor = color
shadowColor 是標準的 CSS 顏色值,用於設定陰影顏色效果,默認是全透明的黑色。
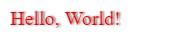
1. 文字陰影的例子
<!DOCTYPE html> <!--[if lt IE 7]> <html class="no-js lt-ie9 lt-ie8 lt-ie7"> <![endif]--> <!--[if IE 7]> <html class="no-js lt-ie9 lt-ie8"> <![endif]--> <!--[if IE 8]> <html class="no-js lt-ie9"> <![endif]--> <!--[if gt IE 8]><!--> <html class="no-js"> <!--<![endif]--> <head> <meta charset="utf-8"> <meta http-equiv="X-UA-Compatible" content="IE=edge"> <title></title> <meta name="description" content=""> <meta name="viewport" content="width=device-width, initial-scale=1"> <link rel="stylesheet" href=""> <script type="text/javascript"> function draw() { var canvas = document.getElementById('myCanvas'); var ctx = canvas.getContext('2d'); ctx.shadowOffsetX = 2; ctx.shadowOffestY = 2; ctx.shadowBlur = 2; ctx.shadowColor = 'rgba(0, 0, 0, 0.5)'; ctx.font = '20px Times New Roman'; ctx.fillStyle = 'red'; ctx.fillText("Hello, World!", 5, 30); } </script> </head> <body onload="draw();"> <!--[if lt IE 7]> <p class="browsehappy">You are using an <strong>outdated</strong> browser. Please <a href="#">upgrade your browser</a> to improve your experience.</p> <![endif]--> <canvas id="myCanvas" width="150" height="150"></canvas> <script src="" async defer></script> </body> </html>效果如圖所示:
七、Canvas填充規則
當我們用到 fill(或者 clip和isPointinPath)你可以選擇一個填充規則,該填充規則根據某處在路徑的外面或者裡面來決定該處是否被填充,這對於自己與自己路徑相交或者路徑被嵌套的時候是有用的。
兩個可能的值:
**"nonzero**": non-zero winding rule, 默認值.**"evenodd"**: even-odd winding rule.
這個例子,我們用填充規則 evenodd
<!DOCTYPE html> <!--[if lt IE 7]> <html class="no-js lt-ie9 lt-ie8 lt-ie7"> <![endif]--> <!--[if IE 7]> <html class="no-js lt-ie9 lt-ie8"> <![endif]--> <!--[if IE 8]> <html class="no-js lt-ie9"> <![endif]--> <!--[if gt IE 8]><!--> <html class="no-js"> <!--<![endif]--> <head> <meta charset="utf-8"> <meta http-equiv="X-UA-Compatible" content="IE=edge"> <title></title> <meta name="description" content=""> <meta name="viewport" content="width=device-width, initial-scale=1"> <link rel="stylesheet" href=""> <script type="text/javascript"> function draw() { var canvas = document.getElementById('myCanvas'); var ctx = canvas.getContext('2d'); ctx.beginPath(); ctx.arc(50, 50, 30, 0, Math.PI * 2, true); ctx.arc(50, 50, 15, 0, Math.PI * 2, true); ctx.fill("evenodd"); } </script> </head> <body onload="draw();"> <!--[if lt IE 7]> <p class="browsehappy">You are using an <strong>outdated</strong> browser. Please <a href="#">upgrade your browser</a> to improve your experience.</p> <![endif]--> <canvas id="myCanvas" width="150" height="150"></canvas> <script src="" async defer></script> </body> </html>效果如圖所示:

