Spring Cloud Alibaba學習筆記(23) - 調用鏈監控工具Spring Cloud Sleuth + Zipkin
- 2019 年 10 月 29 日
- 筆記
隨著業務發展,系統拆分導致系統調用鏈路愈發複雜一個前端請求可能最終需要調用很多次後端服務才能完成,當整個請求陷入性能瓶頸或不可用時,我們是無法得知該請求是由某個或某些後端服務引起的,這時就需要解決如何快讀定位服務故障點,以對症下藥。於是就有了分散式系統調用跟蹤的誕生。
Spring Cloud Sleuth 也為我們提供了一套完整的解決方案。在本文中,我們將詳細介紹如何使用 Spring Cloud Sleuth + Zipkin 來為我們的微服務架構增加分散式服務跟蹤的能力。
Spring Cloud Sleuth
Spring Cloud Sleuth implements a distributed tracing solution for Spring Cloud, borrowing heavily from Dapper, Zipkin and HTrace. For most users Sleuth should be invisible, and all your interactions with external systems should be instrumented automatically. You can capture data simply in logs, or by sending it to a remote collector service.
Spring Cloud Sleuth是Spring Cloud實施分散式跟蹤解決方案,大量借用Dapper,Zipkin和HTrace。 對於大多數用戶來說,偵探應該是隱形的,並且所有與外部系統的交互都應該自動進行檢測。 您可以簡單地在日誌中捕獲數據,也可以將數據發送到遠程收集器服務。
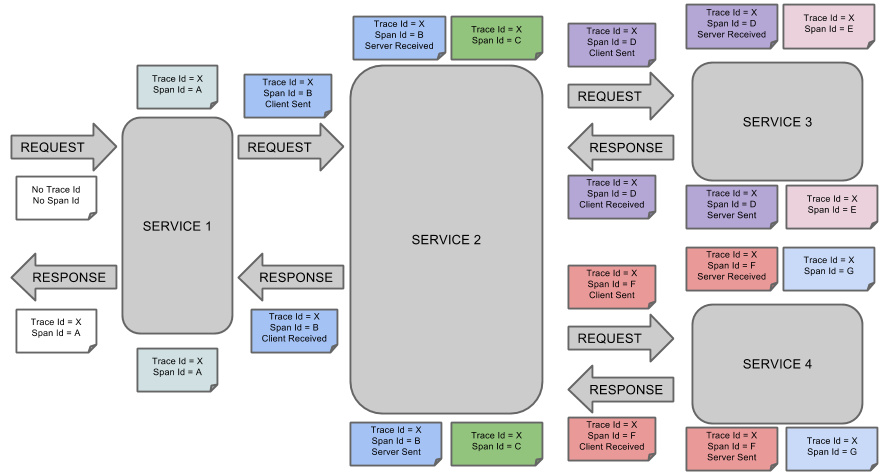
SpringCloudSleuth 借用了 Dapper 的術語:
- Span(跨度):Sleuth的基本工作單元,它用一個64位的id唯一標識。除Id外,span還包含其他數據,例如描述、時間戳事件、鍵值對的註解(標籤)、span ID、span父ID等
- trace(跟蹤):一組span組成的樹狀結構稱之為trace
- Annotation(標註):用於及時記錄事件的存在
- CS(Client Sent客戶端發送):客戶端發送一個請求,該annotation描述了span的開始
- SR(Server Received伺服器端接收):伺服器端獲取請求並準備處理它
- SS(Server Sent伺服器端發送):該annotation表明完成請求處理(當響應發回客戶端時)
- CR(Client Received客戶端接收):span結束的標識,客戶端成功接收到伺服器端的響應
Spring Cloud Sleuth 為服務之間調用提供鏈路追蹤。通過 Sleuth 可以很清楚的了解到一個服務請求經過了哪些服務,每個服務處理花費了多長。從而讓我們可以很方便的理清各微服務間的調用關係。此外 Sleuth 可以幫助我們:
- 耗時分析:通過 Sleuth 可以很方便的了解到每個取樣請求的耗時,從而分析出哪些服務調用比較耗時;
- 可視化錯誤:對於程式未捕捉的異常,可以通過集成 Zipkin 服務介面上看到;
- 鏈路優化:對於調用比較頻繁的服務,可以針對這些服務實施一些優化措施。
Spring Cloud Sleuth 可以結合 Zipkin,將資訊發送到 Zipkin,利用 Zipkin 的存儲來存儲資訊,利用 Zipkin UI 來展示數據。
這是 Spring Cloud Sleuth 的概念圖:
應用整合Sleuth
只需要在pom.xml的dependencies中添加如下依賴,就可以為應用整合sleuth:
<dependency> <groupId>org.springframework.cloud</groupId> <artifactId>spring-cloud-starter-sleuth</artifactId> </dependency>整合完成之後,啟動項目,調用一個請求(我人為的關閉了應用要調用的另一個微服務,導致了請求失敗),這是看控制台日誌:
2019-10-29 16:28:57.417 INFO [study01,,,] 5830 --- [-192.168.31.101] o.s.web.servlet.DispatcherServlet : Completed initialization in 27 ms 2019-10-29 16:28:57.430 INFO [study01,,,] 5830 --- [-192.168.31.101] com.zaxxer.hikari.HikariDataSource : HikariPool-1 - Starting... 2019-10-29 16:28:57.433 INFO [study01,,,] 5830 --- [-192.168.31.101] com.zaxxer.hikari.HikariDataSource : HikariPool-1 - Start completed. 2019-10-29 16:28:58.520 DEBUG [study01,42d9bd786504f775,42d9bd786504f775,false] 5530 --- [nio-8881-exec-1] c.e.s.feignClient.CommentFeignClient : [CommentFeignClient#find] ---> GET http://study02/find HTTP/1.1 2019-10-29 16:28:58.520 DEBUG [study01,42d9bd786504f775,42d9bd786504f775,false] 5530 --- [nio-8881-exec-1] c.e.s.feignClient.CommentFeignClient : [CommentFeignClient#find] ---> END HTTP (0-byte body) 2019-10-29 16:28:58.520 DEBUG [study01,42d9bd786504f775,42d9bd786504f775,false] 5530 --- [nio-8881-exec-1] c.s.i.w.c.f.TraceLoadBalancerFeignClient : Before send 2019-10-29 16:28:58.646 INFO [study01,42d9bd786504f775,42d9bd786504f775,false] 5530 --- [nio-8881-exec-1] c.netflix.config.ChainedDynamicProperty : Flipping property: study02.ribbon.ActiveConnectionsLimit to use NEXT property: niws.loadbalancer.availabilityFilteringRule.activeConnectionsLimit = 2147483647 2019-10-29 16:28:58.661 INFO [study01,42d9bd786504f775,42d9bd786504f775,false] 5530 --- [nio-8881-exec-1] c.netflix.loadbalancer.BaseLoadBalancer : Client: study02 instantiated a LoadBalancer: DynamicServerListLoadBalancer:{NFLoadBalancer:name=study02,current list of Servers=[],Load balancer stats=Zone stats: {},Server stats: []}ServerList:null 2019-10-29 16:28:58.667 INFO [study01,42d9bd786504f775,42d9bd786504f775,false] 5530 --- [nio-8881-exec-1] c.n.l.DynamicServerListLoadBalancer : Using serverListUpdater PollingServerListUpdater 2019-10-29 16:28:58.683 INFO [study01,42d9bd786504f775,42d9bd786504f775,false] 5530 --- [nio-8881-exec-1] c.n.l.DynamicServerListLoadBalancer : DynamicServerListLoadBalancer for client study02 initialized: DynamicServerListLoadBalancer:{NFLoadBalancer:name=study02,current list of Servers=[],Load balancer stats=Zone stats: {},Server stats: []}ServerList:com.alibaba.cloud.nacos.ribbon.NacosServerList@591b62cf 2019-10-29 16:28:58.707 DEBUG [study01,42d9bd786504f775,42d9bd786504f775,false] 5530 --- [nio-8881-exec-1] o.s.c.s.i.a.ContextRefreshedListener : Context successfully refreshed 2019-10-29 16:28:58.755 DEBUG [study01,42d9bd786504f775,42d9bd786504f775,false] 5530 --- [nio-8881-exec-1] c.s.i.w.c.f.TraceLoadBalancerFeignClient : Exception thrown可以看見日誌的形式和之前不太一樣了,首先啟動日誌裡面多了個中括弧:[study01,,,];而當應用請求報異常的時候,中括弧中有了這些數據:[study01,42d9bd786504f775,42d9bd786504f775,false]
study01是應用名稱,42d9bd786504f775是 trace ID,42d9bd786504f775是span ID,false表示是不是要把這條數據上傳給zipkin。這時,就可以通過日誌分析應用哪裡出了問題、哪個階段出了問題。
PS:可以在應用中添加如下配置:
logging: level: org.springframework.cloud.sleuth: debug這段配置的用處是讓sleuth列印更多的日誌,從而進一步幫助我們分析錯誤【我上面粘出的日誌就是添加配置之後的結果】。
Zipkin
Zipkin 是 Twitter 的開源分散式跟蹤系統,它基於 Google Dapper 實現,它致力於收集服務的時序數據,以解決微服務架構中的延遲問題,包括數據的收集、存儲、查找和展現。
搭建Zipkin Server
下載Zipkin Server
使用Zipkin官方的Shell
curl -sSL https://zipkin.io/quickstart.sh | bash -s
Maven中央倉庫
訪問如下地址下載:
https://search.maven.org/remote_content?g=io.zipkin.java&a=zipkin-server&v=LATEST&c=exec
啟動Zipkin Server
下載完成之後,在下載的jar所在目錄,執行java -jar *****.jar命令即可啟動Zipkin Server
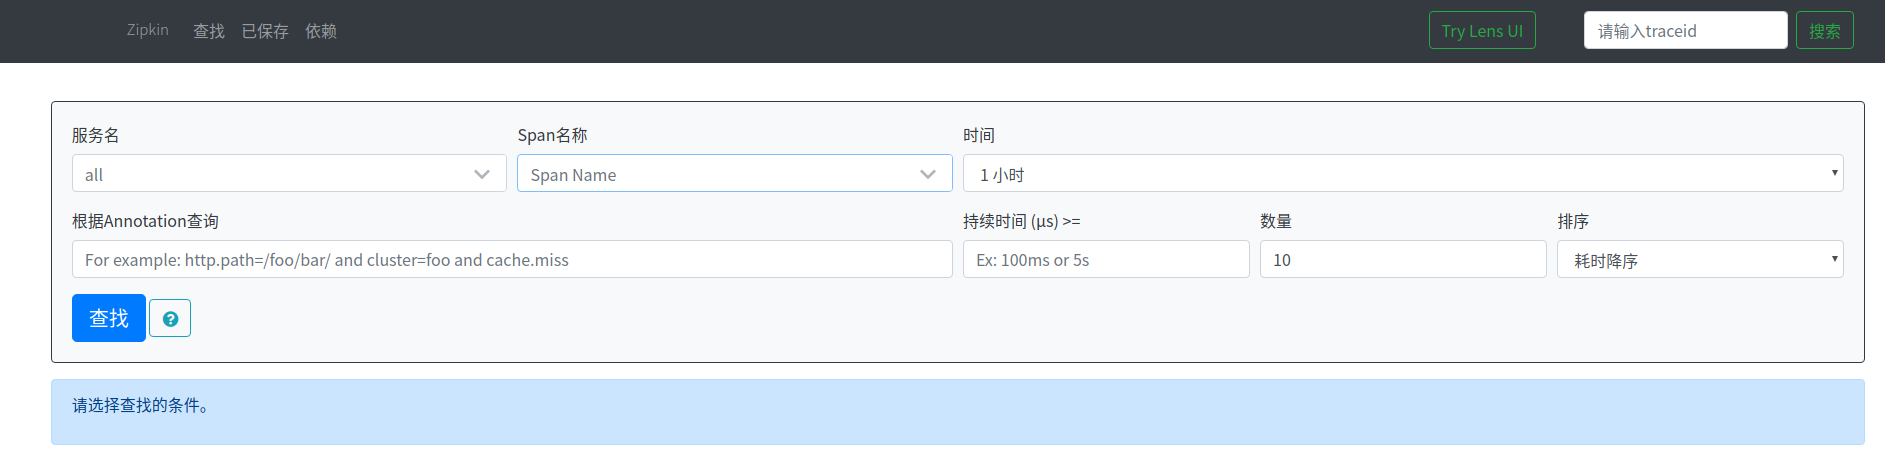
訪問http://localhost:9411 即可看到Zipkin Server的首頁。
應用整合Zipkin
添加依賴:
<dependency> <groupId>org.springframework.cloud</groupId> <artifactId>spring-cloud-starter-zipkin</artifactId> </dependency>PS:當使用了spring-cloud-starter-zipkin之後,前面添加spring-cloud-starter-sleuth就不需要了,因為前者包含了後者。
添加配置
spring: zipkin: base-url: http://localhost:9411/ sleuth: sampler: # 抽樣率,默認是0.1(90%的數據會被丟棄) # 這邊為了測試方便,將其設置為1.0,即所有的數據都會上報給zipkin probability: 1.0啟動項目,產生請求之後,打開zipkin控制台,可以剛剛請求的資訊(按耗時降序排列):

點擊可以查看請求的詳情:
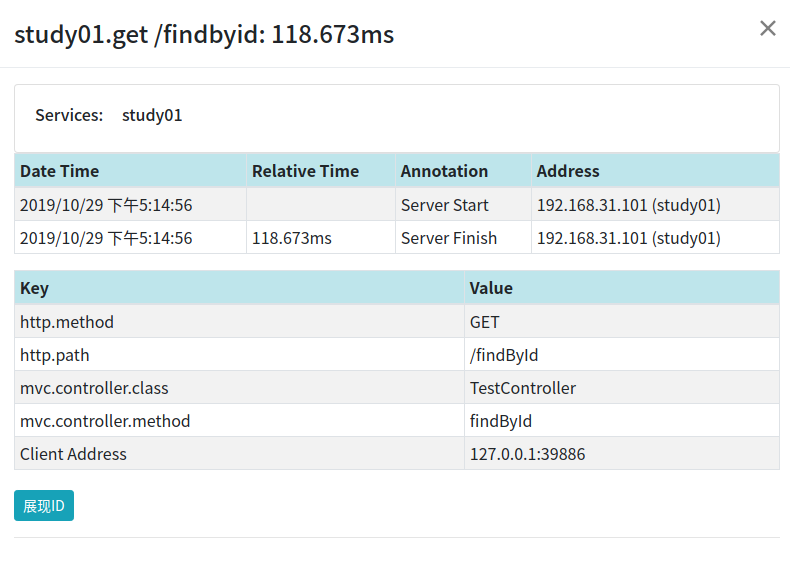
這張圖中,Server Start表示的是Server Received;Server Finish表示的是Server Sent。
因為客戶端發生在瀏覽器上,而瀏覽器並沒有整合zipkin,所以zipkin中沒有Client Sent和Client Received數據。
Zipkin數據持久化
前面搭建Zipkin是基於記憶體的,如果Zipkin發生重啟的話,數據就會丟失,這種方式是不適用於生產的,所以我們需要實現數據持久化。
Zipkin給出三種數據持久化方法:
- MySQL:存在性能問題,不建議使用
- Elasticsearch
- Cassandra
相關的官方文檔:https://github.com/openzipkin/zipkin#storage-component , 本文將介紹Elasticsearch實現Zipkin數據持久化
搭建Elasticsearch
我們需要下載什麼版本的Elasticsearch呢,官方文檔給出了建議,5-7版本都可以使用(本文使用的是Elasticsearch6.8.2,因為Elasticsearch7開始後需要jdk11支援):
The Elasticsearch component uses Elasticsearch 5+ features, but is tested against Elasticsearch 6-7.x.
下載完成後,解壓縮軟體包,進入bin目錄,執行./elasticsearch即可啟動Elasticsearch:
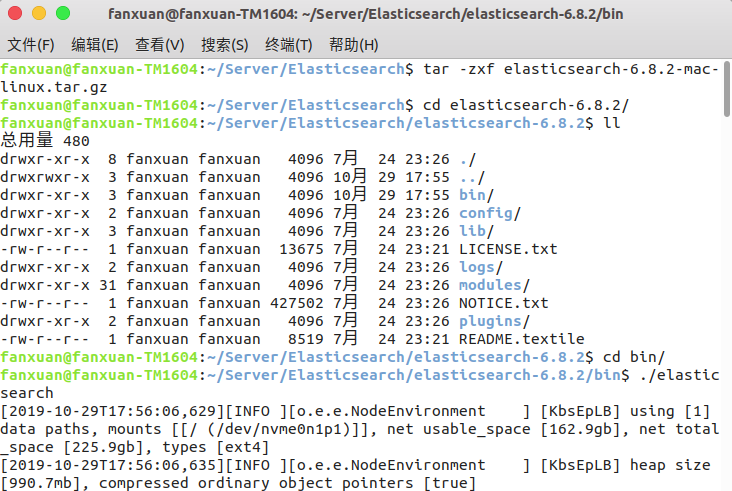
訪問http://localhost:9200/,出現如下頁面,說明Elasticsearch啟動成功:

讓zipkin使用Elasticsearch存儲數據
zipkin提供了很多的環境變數,配置環境變數就可以將數據存儲進Elasticsearch。
- STORAGE_TYPE: 指定存儲類型,可選項為:mysql, cassandra, elasticsearch
- ES_HOSTS:Elasticsearch地址,多個使用,分隔,默認http://localhost:9200
- ES_PIPELINE:指定span被索引之前的pipeline(Elasticsearch的概念)
- ES_TIMEOUT:連接Elasticsearch的超時時間,單位是毫秒;默認10000(10秒)
- ES_INDEX:zipkin所使用的索引前綴(zipkin會每天建立索引),默認zipkin
- ES_DATE_SEPARATOR:zipkin建立索引的日期分隔符,默認是-
- ES_INDEX_SHARDS:shard(Elasticsearch的概念)個數,默認5
- ES_INDEX_REPLICAS:副本(Elasticsearch的概念)個數,默認1
- ES_USERNAME/ES_PASSWORD:Elasticsearch帳號密碼
- ES_HTTP_LOGGING:控制Elasticsearch Api的日誌級別,可選項為BASIC、HEADERS、BODY
更多環境變數參照:https://github.com/openzipkin/zipkin/tree/master/zipkin-server#environment-variables
執行下面程式碼重新啟動zipkin:
STORAGE_TYPE=elasticsearch ES_HOSTS=localhost:9200 java -jar zipkin-server-2.12.9-exec.jar產生請求之後,訪問http://localhost:9411/zipkin/,可以看見剛剛請求的數據:
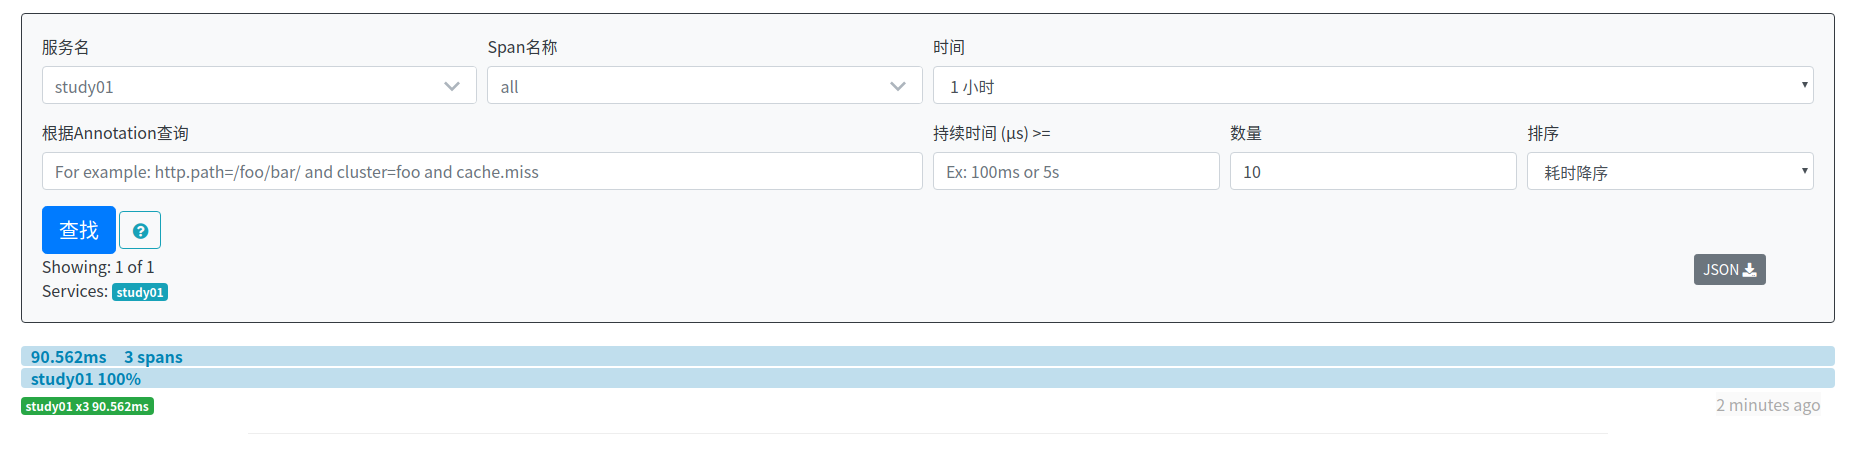
停調zipkin,然後再次啟動,訪問http://localhost:9411/zipkin/,可以看見數據依然存在:
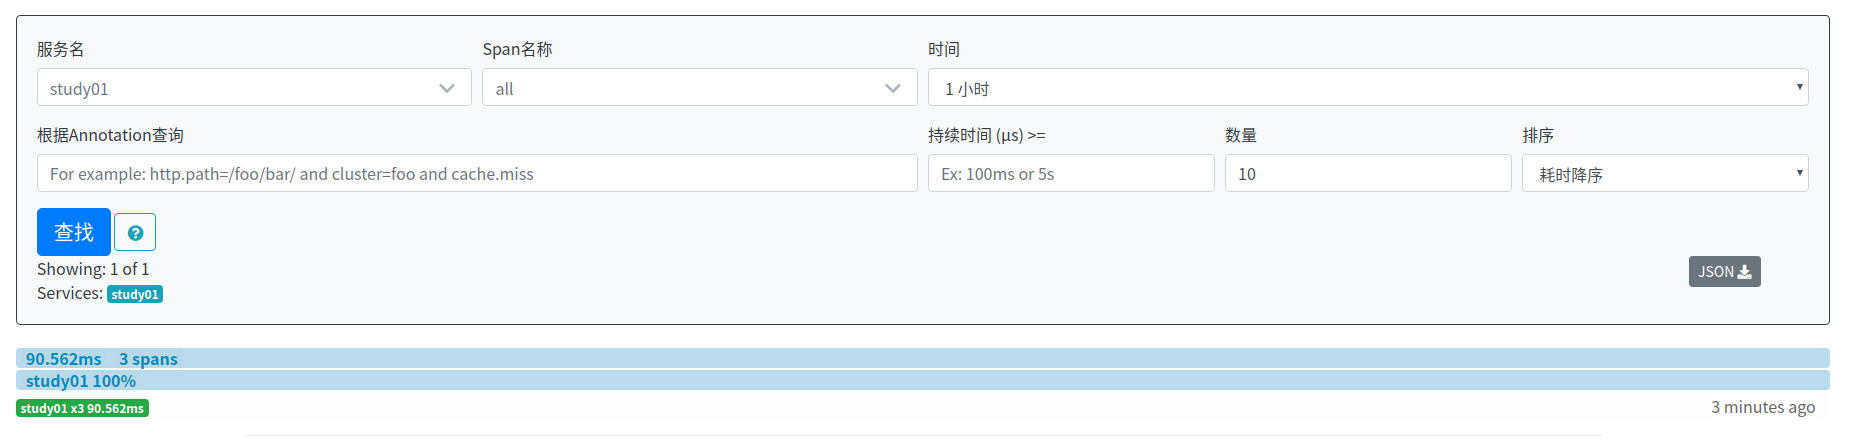
說明此時,數據已經實現了持久化。
從官方文檔可以看出,使用Elasticsearch進行zipkin數據持久化之後,Zipkin的依賴關係分析功能無法使用了。
Note: This store requires a spark job to aggregate dependency links.
我們需要整合zipkin-dependencies來實現依賴關係圖功能。zipkin-dependencies是zipkin的一個子項目,啟動非常的簡單。
下載:
curl -sSL https://zipkin.io/quickstart.sh | bash -s io.zipkin.dependencies:zipkin-dependencies:LATEST zipkin-dependencies.jar
啟動:
STORAGE_TYPE=elasticsearch ES_HOSTS=localhost:9200 java -jar zipkin-dependencies.jar
zipkin-dependencies使用Elasticsearch的環境變數
- STORAGE_TYPE: 指定存儲類型,可選項為:mysql, cassandra, elasticsearch
- ES_HOSTS:Elasticsearch地址,多個使用,分隔,默認http://localhost:9200
- ES_INDEX:zipkin所使用的索引前綴(zipkin會每天建立索引),默認zipkin
- ES_DATE_SEPARATOR:zipkin建立索引的日期分隔符,默認是-
- ES_NODES_WAN_ONLY:如果設為true,則表示僅使用ES_HOSTS所設置的值,默認為false。當Elasticsearch集群運行在Docker中時,可將該環境變數設為true。
這邊只需要把項目啟動,就可以展示依賴關係圖了,這裡就不再演示了。
注意:zipkin-dependencies啟動之後會自動停止,所以建議使用定時任務讓作業系統定時啟動zipkin-dependencies。
擴展:Zipkin Dependencies指定分析日期:
分析昨天的數據(OS/X下的命令)
STORAGE_TYPE=elasticsearch java -jar zipkin-dependencies.jar 'date -uv-ld + %F'
分析昨天的數據(Linux下的命令)
STORAGE_TYPE=elasticsearch java -jar zipkin-dependencies.jar 'date -u -d '1 day ago' + %F'
分析指定日期的數據
STORAGE_TYPE=elasticsearch java -jar zipkin-dependencies.jar 2019-10-29