前端圖形:SVG與Canvas
00、前端圖形
前端程式碼實現圖形的幾種方式:CSS、SVG、Canvas(主要是JavaScript編碼)
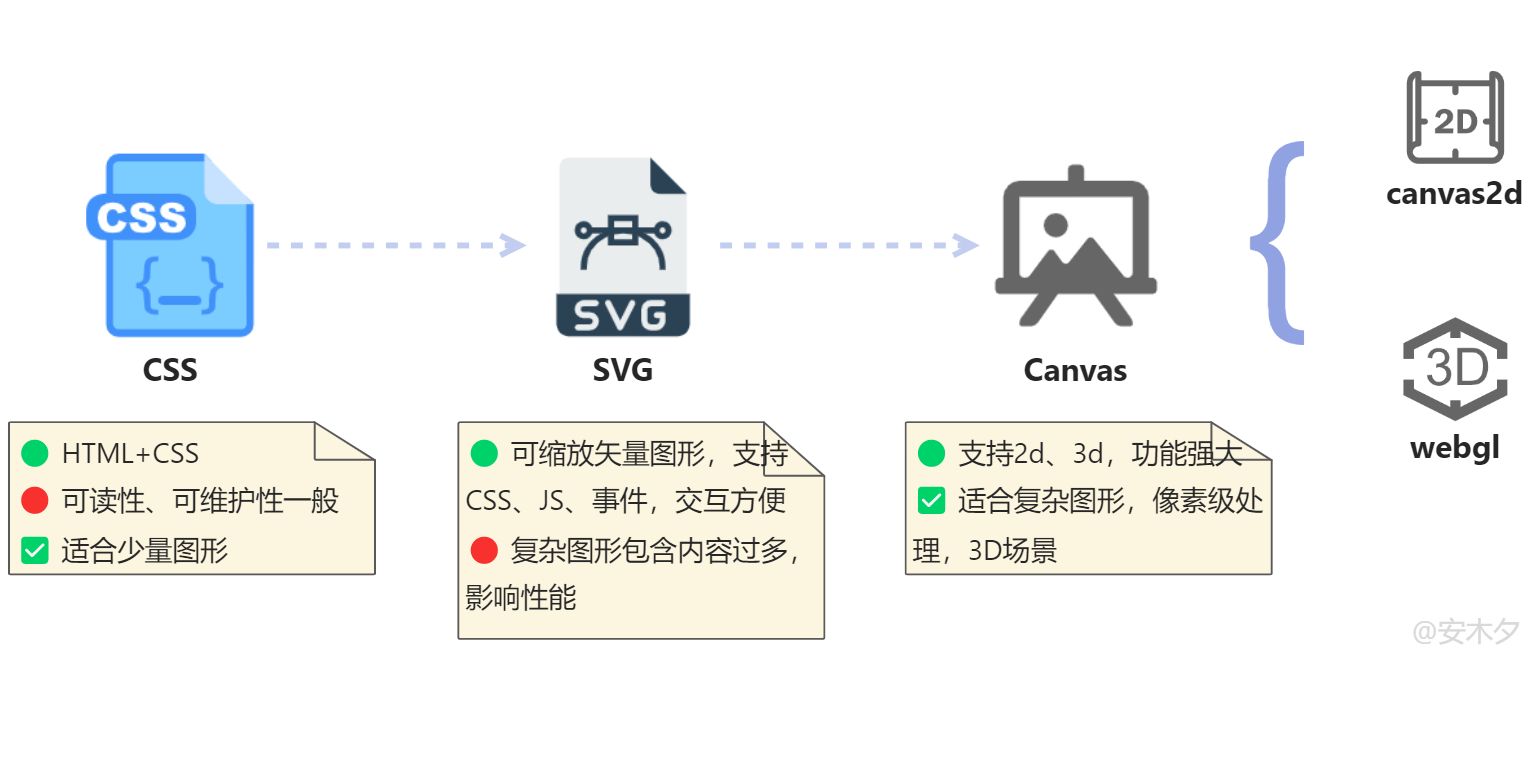
CSS也是可以畫圖的,需要藉助於高寬、邊框border、clip-path裁剪、漸變色背景等屬性來模擬實現各種圖形,當然只能實現一些簡單的圖形。
border:用四條邊框樣式屬性的各種組合變換,實現一些簡單的圖形。網上也有畫一些稍微複雜的圖形,如哆啦A夢,但程式碼量稍多,可讀性不好,並不推薦。
<div class="gcss">
  <p class="border">border</p>
  <p class="rborder">圓角按鈕</p>
  <p class="radio"></p>radio
  <p class="triangle1"></p>三角形
  <p class="triangle2"></p>三角形
</div>
<style>
  .gcss p {
    display: inline-block;
    text-align: center; vertical-align: middle;
  }
  .border {
    border: 30px solid;
    border-color: aqua tan violet peru;
    border-radius: 20px;
  }
  .rborder {
    background-color: #b1ccf3;
    width: 100px; height: 40px; line-height: 40px;
    border-radius: 20px;
  }
  .radio {
    width: 40px; height: 40px;
    border-radius: 50%;
    border: 10px solid;
  }
  .triangle1 {
    border: 50px solid #0001;
    border-left-color: red;
  }
  .triangle2 {
    border-left: 50px solid #0001;
    border-right: 50px solid #0001;
    border-bottom: 50px solid red;
  }
</style>

01、< svg>矢量圖形
< svg>可縮放矢量圖形(Scalable Vector Graphics,SVG),是一種基於 XML(數學)描述的二維的矢量圖形,內容可以直接插入網頁,成為DOM的一部分,然後用 JavaScript 和 CSS 進行操作。SVG 內容也可以寫在一個獨立文件中,然後用CSS(background-url)、<img>、<object>、<embed>、<iframe>來引用。
大多數現代瀏覽器都支援SVG 圖形,越來越多的項目在使用SVG圖形,簡單的像圖標,複雜的一些圖表Chart也有不少是基於SVG實現的。相比於點陣圖,體積更小,可無線縮放而不失真。
| 比較 | 矢量圖形 | 點陣圖 |
|---|---|---|
| 存儲的數據 | 存儲元素、演算法數據 | 存儲像素數據 |
| 存儲大小 | 小 | 大 |
| 縮放效果 | 無線縮放,不失真 | 固定大小,放大會失真 |
| 可維護性 | 很容易修改 | 修改麻煩 |
| 擴展性 | 支援CSS、JS | 不支援 |
| 文件格式 | .svg,直接嵌入數據到頁面 |
.bmp/.png/.jpg/.gif,< img>可嵌入svg文件 |
| 支援的元素 | <svg>、<img>、<iframe>、<object> |
<img>、<iframe> |
| 兼容性 | IE9開始支援 | 較好 |
| 渲染性能 | 複雜的SVG會佔用很多時間 | 穩定 |
| 網路傳輸性能 | 和頁面數據一起,體積小,速度快 | 需單獨請求圖片資源 |
| 快取 | 隨網頁內容一起,不可單獨快取 | 圖片可單獨快取 |
1.1、< svg>元素
<svg>內部支援多種圖形演算法,基礎的如線line、圓形<circle>、矩形rect、文本text,複雜的有折線polyline、多邊形polygon、路徑數據path等。這些圖形都以子元素的形式組合,因此也就都支援CSS、JS的操作了。iconfont-阿里巴巴矢量圖標庫上有非常豐富的< svg>矢量圖形。
| 元素/屬性 | 描述 | 值/示例 |
|---|---|---|
< svg> |
矢量圖形元素 | |
| viewBox | SVG 畫布顯示區域,這裡 1 單位等同於 1 螢幕單位,SVG里的坐標、尺寸都是基於此畫布區域 | viewBox="0 0 300 200" |
| width、height | 寬度、高度 | width="300" height="200" |
| xmlns | xml標籤的命名空間,為了區分html、svg,可以省略 | |
| < line> | 線段 | |
| x1、y1 | 起點x、y坐標 | <line x1="0" y1="100" /> |
| x2、y2 | 終點x、y坐標 | x2="300" y2="100" |
| < rect> | 矩形:<rect x="5" y="50" height="100" width="290"/> |
|
| x、y | 起點坐標 | |
| width、height | 矩形的寬、高 | |
| rx、ry | x、y方向的圓角半徑。r=radius 半徑 | rx="50" ry="50" |
| <circle/ellipse> | 圓和橢圓:<circle cx="150" cy="100" r="80"/> |
|
| cx、cy | 圓心的x、y坐標 | |
| r | 圓的半徑長度 | |
| rx、ry | 橢圓的x、y半徑 | |
| <polyline/polygon> | 折線、多邊形,兩者數據結構相似,多邊形是自動首尾連接封閉成一個區域(Polygon /ˈpɒlɪɡən/ 多邊形) | |
| points | x、y坐標的集合,多個坐標逗號,分割 |
points="0 0, 20 40, 70 80/> |
| < path> | 路徑,很常用、很強大的圖形繪製,數據在屬性d中 |
|
| < d> | 路徑數據,< path>最重要的屬性,由多組命令+ 坐標點組成 |
d="M 50 5 H250 V195 H50 Z" |
| M x y | 移動畫筆到坐標點x、y | M50 5 |
| L x y | 劃線到坐標x、y | L 250 0 |
| H x | 繪製水平線,到坐標x;小寫h的坐標為相對位置 |
H 250 |
| V y | 繪製垂直線,到坐標y;小寫v的坐標為相對位置 |
V195 |
| Z | 閉合路徑(closepath),放到最後用於閉合路徑 | |
| C* | 繪製曲線,包括貝塞爾曲線、圓弧。 | |
| <text> | 文本標籤,支援CSS樣式中的文本樣式 | |
| x、y | 文本開始位置 | |
| font-size | 字體大小 | |
| < textPath> | 文字繪製的路徑,這個就比較有趣了 | <textPath xlink:href="#path1"> |
| 公共屬性 | 部分屬性可以用CSS設置,支援hover偽類 | |
| stroke | 筆畫顏色(stroke /stroʊk/ 筆畫) ,包括線段、形狀線條。 | stroke="red" |
| stroke-width | 畫筆線寬 | stroke-width="10" |
| fill | 填充顏色,填充一個區域(矩形、圓形等) | fill="#0001" |
❗小提示:注意伺服器添加對svg的支援,及gzip壓縮。
<svg version="1.1" baseProfile="full" width="300" height="200" xmlns="//www.w3.org/2000/svg">
	<circle cx="150" cy="100" r="80" fill="green" />
	<circle cx="150" cy="100" r="70" fill="#fff" />
	<text x="150" y="125" font-size="60" text-anchor="middle" fill="orange">SVG</text>
	<line x1="0" y1="100" x2="300" y2="100" stroke="white" stroke-width="8"/>
</svg>
<svg class="icon" height="200" viewBox="0 0 300 200" version="1.1">
	<rect x="5" y="50" rx="50" ry="50" height="100" width="290" fill="white" stroke="blue" stroke-width="10"/>
	<path d="M 50 5 H250 V195 H50 Z" stroke="red" stroke-width="10" fill="#00000001" />
	<text x="145" y="125" font-size="60" text-anchor="middle" fill="#fab">Path</text>
</svg>
<style>
	svg:hover{
		background-color: aliceblue;
		stroke: red;
		stroke-width: 1px;
		fill: red;
	}
</style>

1.2、動畫
SVG 本身就是一個HTML元素,因此動畫可以用CSS的動畫來實現(參考 CSS動畫),SVG中也有專門用於實現動畫的<animate>子元素。這裡示例採用JavaScript+transform變換實現旋轉效果。
<svg version="1.1" baseProfile="full" width="300" height="200" xmlns="//www.w3.org/2000/svg">
	<circle cx="150" cy="100" r="80" fill="green" />
	<circle cx="150" cy="100" r="70" fill="#fff" />
	<text class="svgc" x="150" y="125" font-size="60" text-anchor="middle" fill="orange" >SVG</text>
	<line class="svgc" x1="0" y1="100" x2="300" y2="100" stroke="white" stroke-width="8" />
</svg>
<script>
	let svgcs = document.querySelectorAll(".svgc");
	//設置中心點
	svgcs.forEach(element => {
		element.setAttribute("transform-origin", '150 100');
	});
	let deg = 0;
	setInterval(() => {
		deg = deg > 360 ? 0 : deg+4;
		svgcs.forEach(element => {
			element.setAttribute("transform", `rotate(${deg})`);
		});
	}, 100);
</script>
<!-- 用CSS動畫實現的版本 -->
<style>
	.svgc {
		transform-origin: 150px 100px;
		animation: svgc-routate 2s linear 1s infinite;
	}
	@keyframes svgc-routate {
		from {
			transform: rotate(0deg);
		}
		to {
			transform: rotate(360deg);
		}
	}
</style>

1.3、svg工具/資源/庫
🔸矢量圖標資源
🔸SVG工具
路徑< path>可以繪製任意的圖形,直接編碼是比較困難的,特別是C貝塞爾曲線。所以一般都是用專業工具來繪製< svg>圖形的,也有在線工具。
- 專業工具AI:Adobe Illustrator
- 在線SVG編輯器,Method Draw
- SVGator,一個在線SVG動畫製作工具,導入SVG文件,進行可視化的動畫製作。
🔸動畫庫
- 第三方庫GSAP,來自GreenSock,可以更簡單的實現更豐富的動畫效果,不光支援SVG,包括頁面中任意可以通過JS訪問的元素、屬性,都可以實現動畫。
- anime.js,功能強大,非常輕量,壓縮後大小9K。
- SVG動畫庫:mo.js、SVG.js
02、< canvas>基礎
< canvas>只是一塊平平無奇的畫布而已(在HTML中就一個<canvas>元素),提供了一點點API,由JS進行繪製各種圖形。2D的canvas繪製和<SVG>挺像,都是一些線、矩形、圓、path路徑數據。這裡就先簡單了解一下,<canvas>功能是很強大的,很多可視化圖表都是基於<canvas>實現的。
🔸基本特點:
- 雙標籤,必須包含閉合標籤。標籤內可以放提示文字,當瀏覽器不支援
<canvas>會顯示。 - 坐標系以左上角為中心點,和SVG一樣。

2.1、canvas API
| canvas 屬性/方法 | 描述 |
|---|---|
| height、width | 元素高度、寬度:<canvas width="400" height="400"></canvas> |
| getContext(contextType) | 獲取用於繪製的渲染上下文,contextType: “2d”:CanvasRenderingContext2D 二維渲染上下文 “webgl”: WebGLRenderingContext 三維渲染上下文,OpenGL ES 2.0 “webgl2″:WebGL2RenderingContext 三維渲染上下文,OpenGL ES 3.0 |
| CanvasRenderingContext2D | |
| fillStyle | 填充(內部)顏色 ctx.fillStyle='rgba(250,0,0,0.6)' |
| strokeStyle | 畫筆(邊框)顏色 ctx.strokeStyle='red',同上,支援color、漸變色畫刷、圖片畫刷 |
| font | 字體設置 ctx.font = "bold 48px serif" |
| lineWidth | 線寬 ctx.lineWidth = 15; |
| toDataURL(type, quality) | 可以將canvas繪製的圖形轉換為Data URI 格式的影像,從而導出為點陣圖文件 |
| 基礎圖形繪製 | |
| fillRect(x, y, width, height) | 填充一個矩形 |
| strokeRect(x, y, width, height) | 繪製一個矩形框 |
| clearRect(x, y, width, height) | 清除指定區域的的像素 |
| fillText(text, x, y, [maxWidth]) | 填充文本 |
| strokeText(text, x, y [, maxWidth]) | 繪製文本(輪廓) |
| drawImage() | 繪製點陣圖 |
| 路徑繪製 | ①創建路徑 >** ②創建路徑 > ③**渲染路徑 |
| beginPath() | 開始一個新的路徑,清除已有路徑列表 |
| closePath() | 閉合一個路徑 |
| moveTo(x, y) | 移動畫筆到坐標x、y |
| lineTo(x, y) | 畫線到坐標x、y |
| ellipse(x, y, radiusX, radiusY,r,sa,ea) | 橢圓路徑 ellipse(x, y, radiusX, radiusY, rotation, startAngle, endAngle) |
| rect(x, y, width, height) | 矩形路徑 |
| arc(x, y, radius, startAngle, endAngle) | 繪製圓弧路徑 |
| quadraticCurveTo(cp1x, cp1y, x, y) | 二次貝塞爾曲線 |
| fill([path], [fillRule]) | 填充當前、已存在的路徑 |
| stroke([path]) | 描邊子路徑 |
| Path2D | 可以單獨申明一個路徑對象,支援上面的繪製,還支援SVG的path數據。 |
<canvas id="canvas" width="400" height="400"></canvas>
<script>
	ctx = document.getElementById('canvas').getContext('2d');
	// ctx.alpha = false;
	ctx.fillStyle = 'rgba(250,0,0,0.6)';
	ctx.fillRect(10, 10, 40, 40);
	ctx.fillRect(30, 30, 40, 40);
	ctx.strokeStyle = 'red';
	ctx.lineWidth = 3;
	ctx.strokeRect(90, 10, 150, 50);
	ctx.fillStyle = 'rgba(0,0,250,0.5)';
	ctx.font = '20px 微軟雅黑';
	ctx.fillText("文本Text", 120, 40)
	//path
	ctx.beginPath();
	ctx.moveTo(90, 80);
	ctx.lineTo(90, 200);
	ctx.lineTo(190, 200);
	ctx.closePath();
	ctx.arc(120, 120, 50, 0, 360);
	ctx.fill();
</script>

弧度 = ( Math.PI / 180 ) * 角度,360度的弧度= Math.PI*2
2.2、動畫
Canvas的動畫就是不停的重繪,其實任何動畫都是這樣,前端實現動畫有以下幾種姿勢:
- setInterval(function, delay):定時重繪,適合不需要交互的場景。
- setTimeout(function, delay):定時重繪,適合通過鍵盤或者滑鼠事件來捕捉用戶的交互,再用
setTimeout執行相應的動作。 - requestAnimationFrame(callback):動畫專用API,這個方法更加平緩並更加有效率,當系統準備好了重繪條件的時候,才調用繪製動畫幀。
requestAnimationFrame (render)是HTML5提供的動畫API,他向瀏覽器申請執行一個動畫幀渲染函數,瀏覽器在下次重繪(刷新)之前調用這個render回調函數。requestAnimationFrame還做了很多優化以提升性能和流暢度。
- 穩定60幀:瀏覽器的刷新周期大多和螢幕刷新率匹配,為每秒60次,非常穩定高效。不像
setInterval、setTimeout還要在任務隊列里排隊等待,就可能發生丟幀和卡頓現象。 - 合併優化:瀏覽器會優化動畫的執行,把每一幀的所有DOM操作集中起來,在一個渲染周期內執行。
- 隱藏優化:當前窗口或者標籤頁不可見時停止運行
requestAnimationFrame。
<canvas id="canvas" width="400" height="400"></canvas>
	<script>
	ctx = document.getElementById('canvas').getContext('2d');
	//動畫旋轉
	let eangle = 0;
	function drawEllipse() {
		ctx.clearRect(255, 150, 140, 140);
		ctx.beginPath();
		ctx.fillStyle = 'rgba(0,250,0,0.3)';
		eangle = eangle > 360 ? 0 : eangle + 1;
		ctx.ellipse(320, 230, 60, 30, eangle * Math.PI / 180, 0, 2 * Math.PI);
		ctx.stroke();
		ctx.fill();
		ctx.beginPath();
		ctx.ellipse(320, 230, 30, 60, eangle * Math.PI / 180, 0, 2 * Math.PI);
		ctx.fillStyle = 'rgba(0,0,250,0.3)';
		ctx.stroke();
		ctx.fill();
	}
	setInterval(drawEllipse, 20);
	//水平移動
	let lx = 40;
	let ltr = true;
	function drawRect() {
		if (lx > 300) ltr = false;
		if (lx < 40) ltr = true;
		// ctx.clearRect(lx, 220, 40, 40);
		ctx.fillStyle = 'rgb(255,255,255,0.4)';
		ctx.fillRect(20, 290, 340, 60);
		lx = ltr ? lx + 2 : lx - 2;
		ctx.fillStyle = 'rgb(110,22,250)';
		ctx.fillRect(lx, 300, 40, 40);
		ctx.strokeRect(lx, 300, 40, 40);
		requestAnimationFrame(drawRect);  //永遠不停的提交渲染申請,遞歸自己
	}
	requestAnimationFrame(drawRect);
	</script>

用canvas實現的一個綵球大戰:codepen
03、WebGL
WebGL 作為一種WEB 3D繪圖技術,依託於<canvas>元素。WebGL是運行在GPU上的,可面向底層顯示卡編程,可調用底層的介面,實現硬體加速,在2D圖形繪製上性能會優於Canvas2D。
傳說原生的WebGL比較難學,可考慮使用使用第三方的WebGL庫,如Three.js、Cesium.js(3D地圖)、Babylon.js
©️版權申明:版權所有@安木夕,本文內容僅供學習,歡迎指正、交流,轉載請註明出處!原文編輯地址

