測試右移:線上品質監控 ELK 實戰
【測試右移】介紹
為什麼要做測試右移?
- 測試環境不能完全模擬線上環境。
- 線上品質不僅取決於已發布程式碼,還取決於數據變更與配置變更。
- 線上測試可以獲得更多品質數據,以輔助產品更新。
測試右移主要實踐:
- 應用監控
- 綜合監控品質監控(ContinuousQuality Monitoring)
- A/B 測試
- 金絲雀部署(Canary Releases)
- TIP 線上測試
- 故障注入/混沌工程(Chaostesting)

為什麼要搭建監控系統:
- 測試數據收集
- 測試數據分析
- 測試數據可視化與分析
品質監控:
- apm 應用性能監控
- 全鏈路監控 zipkin、skywalking
- 崩潰率監控 bugly
- 線上用戶體驗特徵監控與分析

測試監控:
- 優化測試的深度
- 優化測試的速度
- 優化測試的廣度
- 優化測試進度管理
ELK Stack 介紹
ELK Stack 代指 Elasticsearch、Logstash 和 Kibana ,在這個生態圈慢慢發展過程中,加入了一個新成員 Beats。
-
ElasticSearch:基於 Java,一個開源的分散式搜索引擎。 -
LogStash:基於 Java,開源的用於收集、分析和存儲日誌的工具。(它和 Beats 有重疊的功能。Beats 出現之後,LogStash 則專門做日誌的分析) -
Kibana:基於 Node.js,主要為 ElasticSearch 和 LogStash 提供 Web 頁面展示,可以匯總,分析搜索資訊。 -
Beats:數據採集,它其實是一個綜合的名字,它由一些子項目組合而成。- Packetbeat(搜集網路流量數據)
- Topbeat(搜集系統、進程和文件系統級別的 CPU 和記憶體使用情況等數據)
- Filebeat(用於監控,搜集伺服器日誌文件)
- Winlogbeat( Windows 事件日誌數據收集)
- Metricbeat(可定期獲取外部系統的監控指標資訊,可用於監控、收集 Apache、Mysql、Nginx、Redis、Zookeeper 等服務)

ELK 監控體系搭建
docker pull docker.elastic.co/elasticsearch/elasticsearch:8.1.2
docker pull docker.elastic.co/kibana/kibana:8.1.2
docker pull docker.elastic.co/logstash/logstash:8.1.2
ES & Kibana 搭建
# 創建子網
docker create network elastic

# 啟動 elasticsearch 容器
docker run -d --name es01 --net elastic -p 9200:9200 docker.elastic.co/elasticsearch/elasticsearch:8.1.2
# 由於啟動時間較久,可使用 docker logs -f es01 查看啟動日誌
記錄啟動日誌中的登錄密碼及 Token(注意有效期為半小時):

->  Password for the elastic user (reset with `bin/elasticsearch-reset-password -u elastic`):
  DB1ngqLjym5Zg3n-doni

->  HTTP CA certificate SHA-256 fingerprint:
  2cffe4439402214dcd28786c835fcd9fdce82f266a8cfd915cdd9fd52facdea3

->  Configure Kibana to use this cluster:
* Run Kibana and click the configuration link in the terminal when Kibana starts.
* Copy the following enrollment token and paste it into Kibana in your browser (valid for the next 30 minutes):
  eyJ2ZXIiOiI4LjEuMiIsImFkciI6WyIxNzIuMTkuMC4yOjkyMDAiXSwiZmdyIjoiMmNmZmU0NDM5NDAyMjE0ZGNkMjg3ODZjODM1ZmNkOWZkY2U4MmYyNjZhOGNmZDkxNWNkZDlmZDUyZmFjZGVhMyIsImtleSI6InZ5UkZySUVCYzFJYTJ4eXZWUXRLOlJSYW03X1FnU3ZxdUZqT0lnOEZLTUEifQ==

-> Configure other nodes to join this cluster:
* Copy the following enrollment token and start new Elasticsearch nodes with `bin/elasticsearch --enrollment-token <token>` (valid for the next 30 minutes):
  eyJ2ZXIiOiI4LjEuMiIsImFkciI6WyIxNzIuMTkuMC4yOjkyMDAiXSwiZmdyIjoiMmNmZmU0NDM5NDAyMjE0ZGNkMjg3ODZjODM1ZmNkOWZkY2U4MmYyNjZhOGNmZDkxNWNkZDlmZDUyZmFjZGVhMyIsImtleSI6IndTUkZySUVCYzFJYTJ4eXZWUXVsOlF0bFNtVnVCVFhXVV83UThUcVZETkEifQ==

  If you're running in Docker, copy the enrollment token and run:
  `docker run -e "ENROLLMENT_TOKEN=<token>" docker.elastic.co/elasticsearch/elasticsearch:8.1.2`
證書認證:
# 拷貝證書到本地
docker cp es01:/usr/share/elasticsearch/config/certs/http_ca.crt .

# 進行認證
curl --cacert http_ca.crt -u elastic //localhost:9200
# 輸入剛剛記錄下的密碼

啟動 Kibana:
docker run -d \
  --name kibana \
  --link elasticsearch:elasticsearch \
  --net elastic \
  -p 5601:5601 \
  docker.elastic.co/kibana/kibana:8.1.2

輸入 ES 啟動日誌中的 Token 及 Kibana 啟動日誌中的 code:
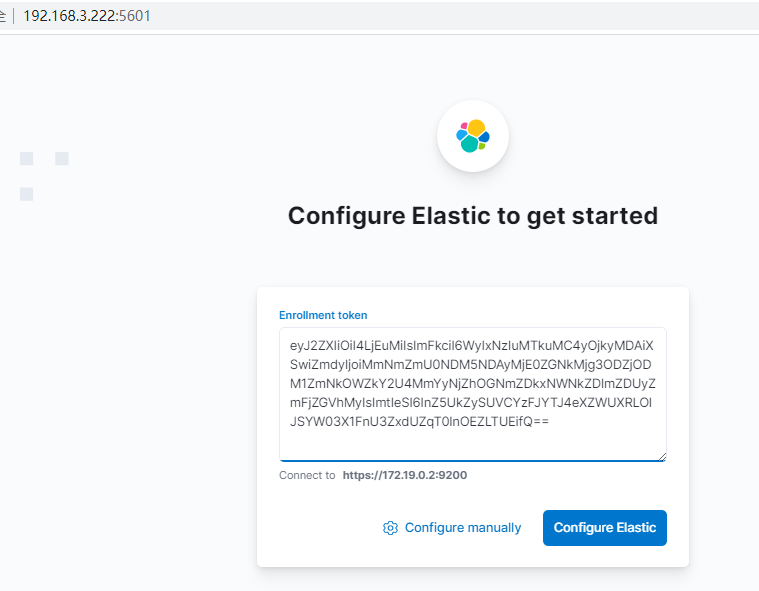
輸入 ES 啟動日誌中的用戶名/密碼:

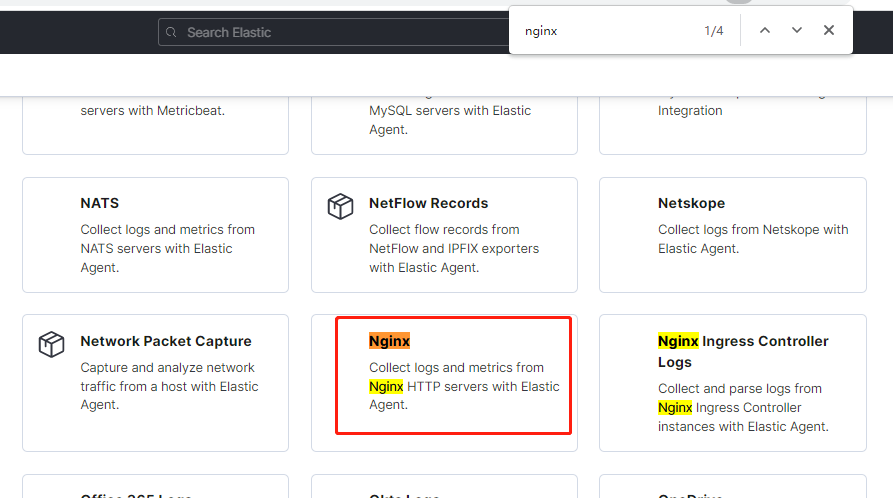
Nginx 日誌自動採集
示例:使用 ES 提供的集成工具(Nginx Agent),自動採集伺服器上的 Nginx 日誌數據到 ES 中
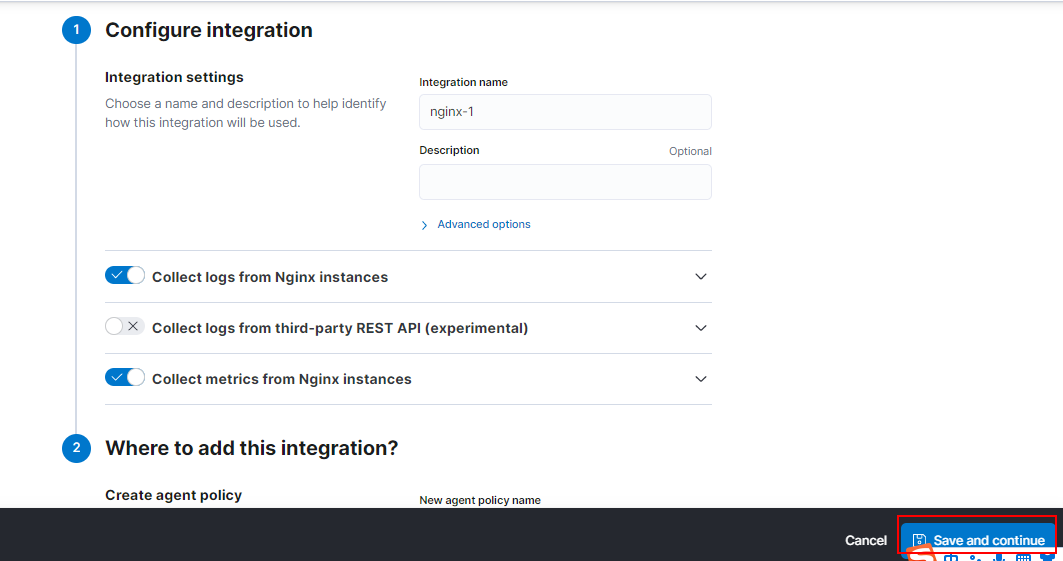
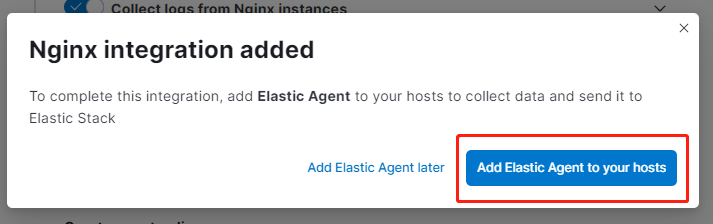
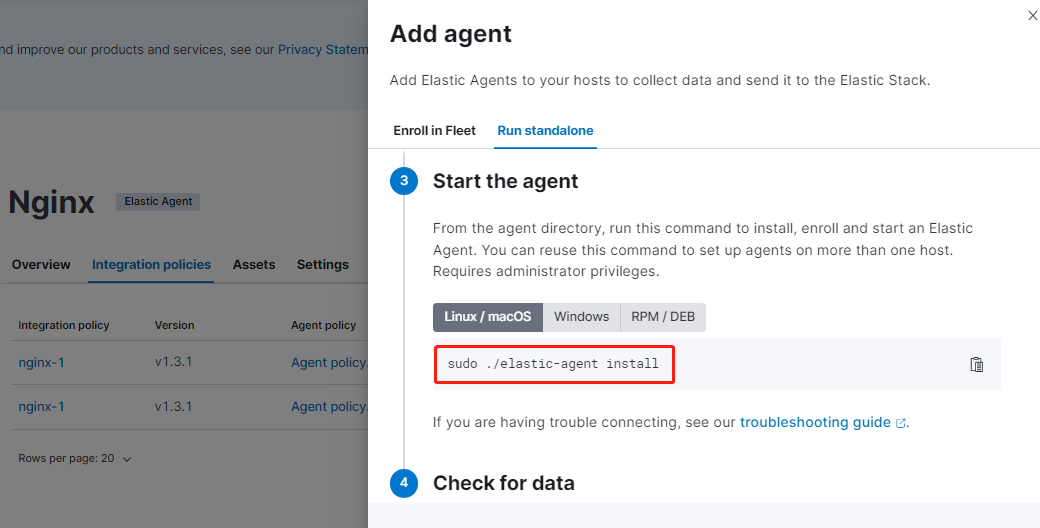
Nginx Agent

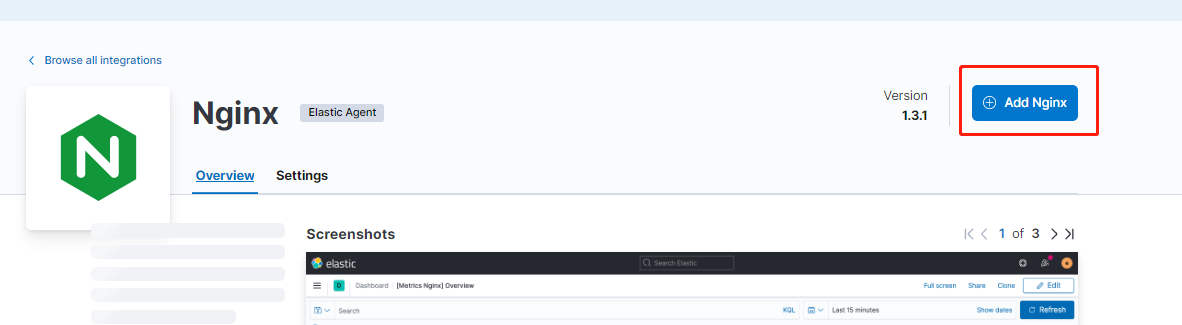
使用默認配置進行保存:
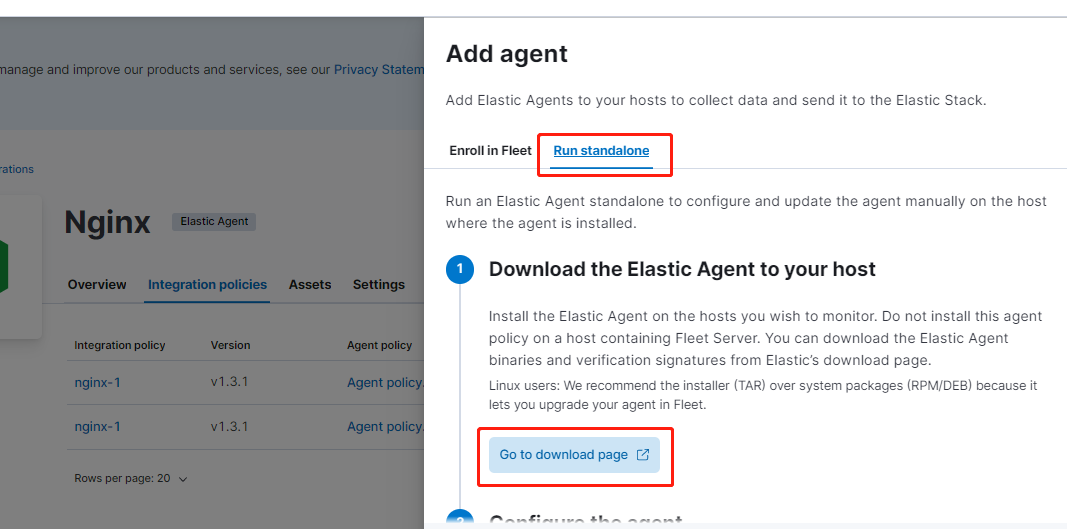

將上述 ES 提供的日誌採集 Agent 下載到 Nginx 伺服器中:
[root@localhost es_agent]# wget //artifacts.elastic.co/downloads/beats/elastic-agent/elastic-agent-8.1.2-linux-x86_64.tar.gz
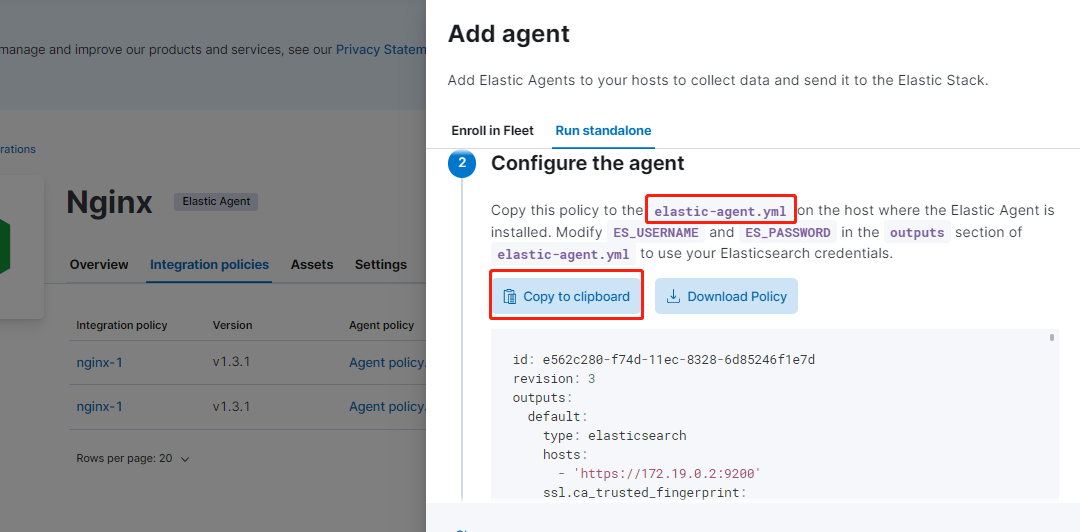
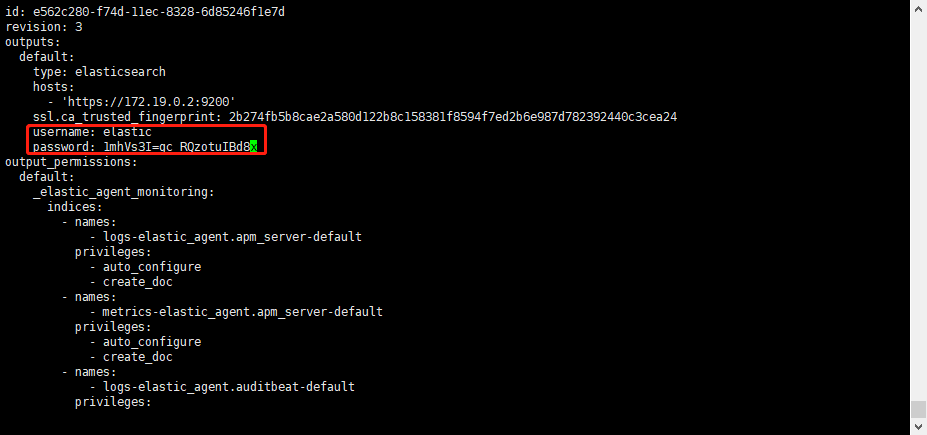
創建 elastic-agent.yml 配置文件:
解壓 agent 並執行:
[root@localhost es_agent]# tar -zxvf elastic-agent-8.1.2-linux-x86_64.tar.gz
...
[root@localhost es_agent]# ls
elastic-agent-8.1.2-linux-x86_64  elastic-agent-8.1.2-linux-x86_64.tar.gz  elastic-agent.yml
[root@localhost es_agent]# ./elastic-agent-8.1.2-linux-x86_64/elastic-agent install
Elastic Agent will be installed at /opt/Elastic/Agent and will run as a service. Do you want to continue? [Y/n]:y
Do you want to enroll this Agent into Fleet? [Y/n]:n
Elastic Agent has been successfully installed.
# 此時 agent 會被成功安裝在 /opt/Elastic/Agent/ 目錄
替換剛下載的配置文件:
[root@localhost Agent]# mv elastic-agent.yml elastic-agent.yml_bak
[root@localhost Agent]# mv ../elastic-agent.yml .
[root@localhost Agent]# vi elastic-agent.yml
# 重啟 agent
[root@localhost Agent]# ./elastic-agent restart
安裝 Nginx 伺服器
# 下載 nginx
[root@localhost Agent]# yum install nginx

# 啟動 nginx
[root@localhost Agent]# systemctl start nginx

# 查看 nginx 日誌,發現已被 agent 監控
[root@localhost Agent]# less /var/log/nginx/access.log
127.0.0.1 - - [29/Jun/2022:12:42:23 +0800] "GET /nginx_status HTTP/1.1" 404 3971 "-" "Elastic-Metricbeat/8.1.2 (linux; amd64; 6118f25235a52a7f0c4937a0a309e380c92d8119; 2022-03-29 22:45:47 +0000 UTC)" "-"
127.0.0.1 - - [29/Jun/2022:12:42:40 +0800] "GET /nginx_status HTTP/1.1" 404 3971 "-" "Elastic-Metricbeat/8.1.2 (linux; amd64; 6118f25235a52a7f0c4937a0a309e380c92d8119; 2022-03-29 22:45:47 +0000 UTC)" "-"
...
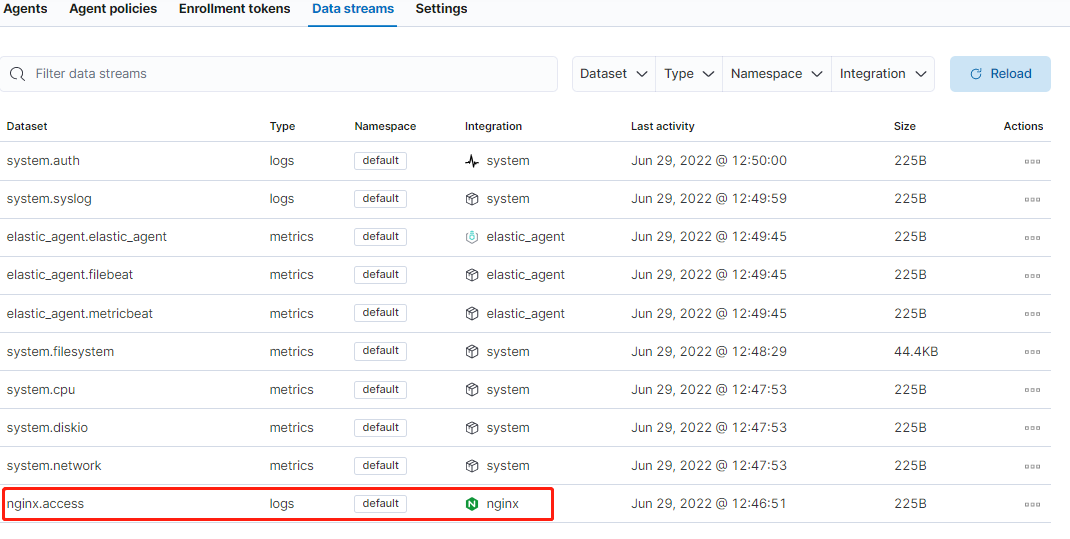
數據分析
確認日誌數據正常被採集到 ES 中:

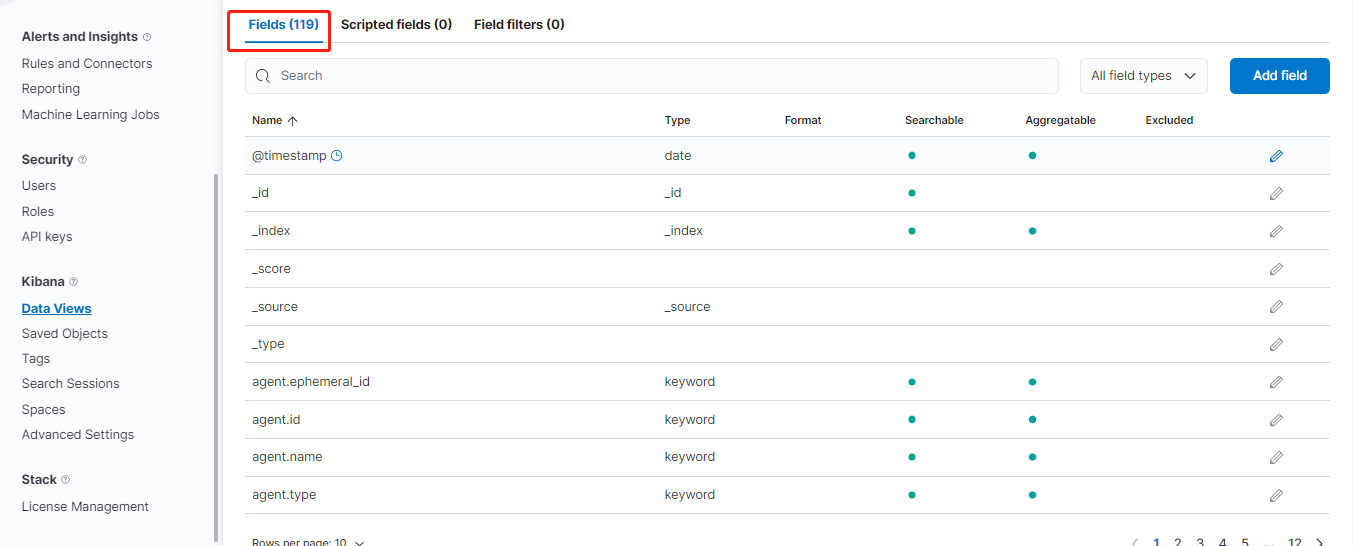
創建自定義視圖(正則匹配所需要的日誌文件):
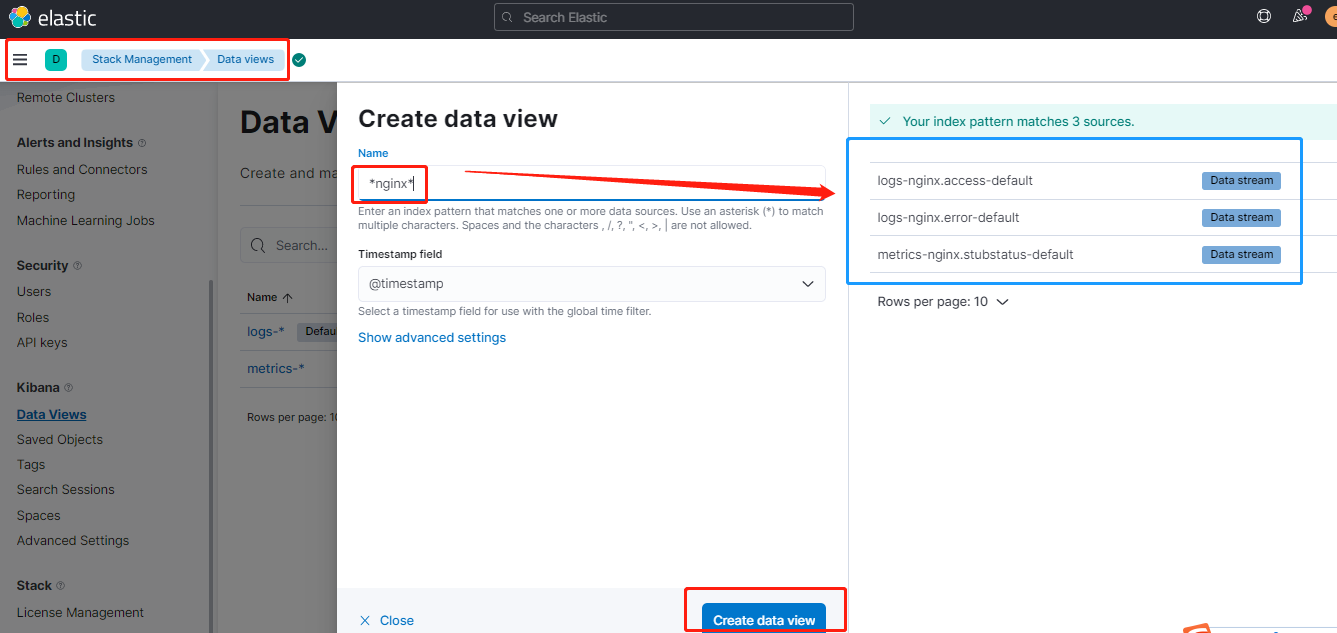
創建完成後,會自動解析欄位:
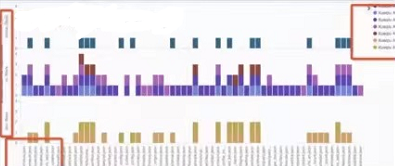
查看自定義視圖的統計圖及明細數據:
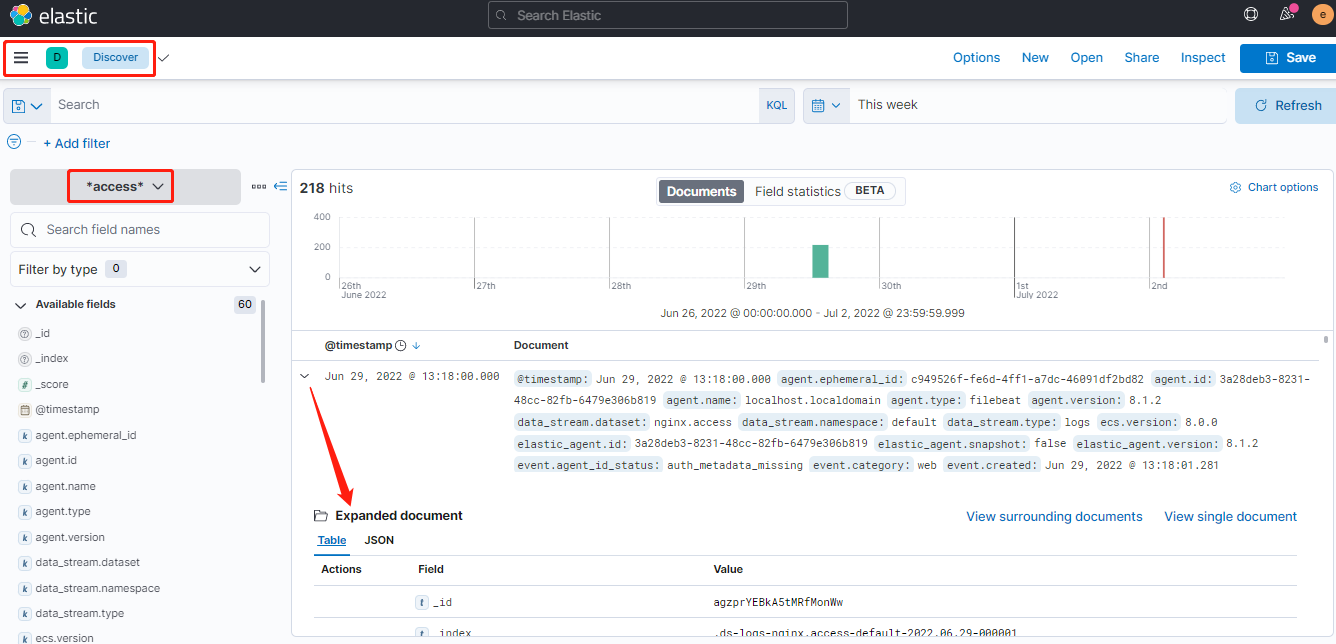
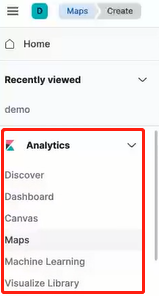
更多的數據分析功能:
Logstash 搭建
配置文件:vi $PWD/pipeline/logstash.conf
# 輸入
input {
  file {
    path => [ "/data/*.log" ]  # logstash的data目錄下的log
  }
}

# 過濾
filter {
      grok {
        match => { "message" => ["%{IPORHOST:[nginx][access][remote_ip]} - %{DATA:[nginx][access][user_name]} \[%{HTTPDATE:[nginx][access][time]}\] \"%{WORD:[nginx][access][method]} %{DATA:[nginx][access][url]} HTTP/%{NUMBER:[nginx][access][http_version]}\" %{NUMBER:[nginx][access][response_code]} %{NUMBER:[nginx][access][body_sent][bytes]} \"%{DATA:[nginx][access][referrer]}\" \"%{DATA:[nginx][access][agent]}\""] }
        remove_field => "message"
      }
}

# 輸出
output {
  stdout {}  # 標準輸出
  elasticsearch {  # 輸出到 es
    hosts => ["//192.168.3.222:9200"]  # es主機
    index => "logstash-nginx-%{+YYYY.MM.dd}"  # 生成的索引
    user => "elastic"  # es用戶名
    password => "-yAoRIIni3qy*RW*Q8Nc"  # es密碼
    ssl_certificate_verification => false  # 關閉es證書認證
  }
}
啟動 logstash:
# 配置文件
[root@localhost logstash]# vi logstash.yml
http.host: "0.0.0.0"
xpack.monitoring.elasticsearch.hosts: ["//192.168.3.222:9200"]
xpack.monitoring.elasticsearch.username: "elastic"
xpack.monitoring.elasticsearch.password: "-yAoRIIni3qy*RW*Q8Nc"
xpack.monitoring.enabled: true

# 啟動 logstash
docker run --name logstash --rm -d --net elastic \
  -v $PWD/logstash.yml:/usr/share/logstash/config/logstash.yml \  # 掛載配置文件
  -v $PWD/pipeline:/usr/share/logstash/pipeline/ \  # 掛載採集配置文件目錄
  -v /var/log/nginx/access.log:/data/access.log \  # 掛載nginx的訪問日誌
  -v /var/log/nginx/error.log:/data/error.log \  # 掛載nginx的錯誤日誌
  docker.elastic.co/logstash/logstash:8.1.2 \
  --config.reload.automatic  # 熱更新配置文件
查看成功生成的索引:
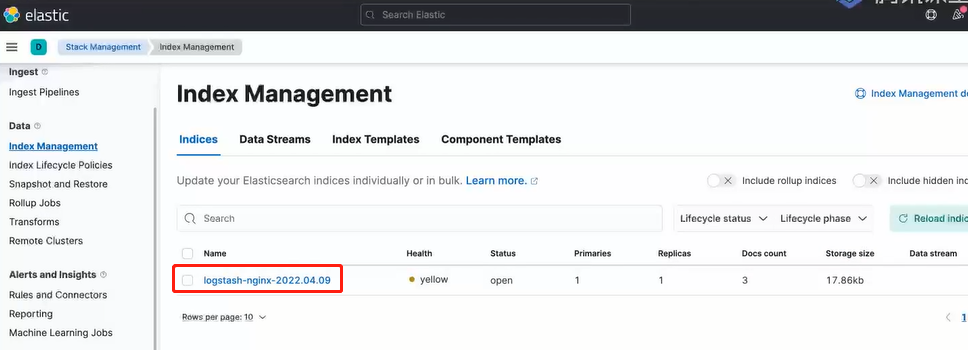
接著便可創建自定義視圖(data view)並進行數據分析。


