Golang | 測試與性能調優
Test
我們在日常的工作過程中,自測是不可缺少的,公司還會要求所有的公共方法必須要寫單測,在別的語言中,我們如果想要寫單測還需要使用到測試框架,但是Go語言中,直接支援測試,並且使用起來非常簡單。
比如說我現在寫了一個:
// twoSum 給定數組,求兩個之和的數組內地址
func twoSum(nums []int, target int) []int {
	hashTable := map[int]int{}
	for i, x := range nums {
		if p, ok := hashTable[target-x]; ok {
			return []int{p, i}
		}
		hashTable[x] = i
	}
	return nil
}
這個方法是求兩數之和的,這個方法是公共方法,現在我需要對這個方法進行單測,我們只需要在同一目錄下新建一個以 _test結尾的文件就可以了。
package twoSum

import (
	"testing"
)

func TestTwoSum(t *testing.T) {

}
新建一個函數,以Test開頭,以剛剛的方法名結尾,參數默認是 testing包中的。
現在我們就可以寫測試內容了:
func TestTwoSum(t *testing.T) {
	args := []struct {
		nums   []int
		target int
		source []int
	}{
		{[]int{2, 7, 11, 15}, 9, []int{0, 1}},
		{[]int{2, 7, 11, 15}, 13, []int{0, 2}},
		{[]int{0, 1, 0}, 0, []int{0, 2}},
	}
	for _, arg := range args {
		sum := twoSum(arg.nums, arg.target)
		for i, v := range sum {
			if arg.source[i] != v {
				fmt.Printf("nums:%v,target:%v,right:%v,source:%v", arg.nums, arg.target, sum, arg.source)
			}
		}
	}
}
以上就是測試方法的內容了,這和我們平時寫的測試不太一樣,是因為這是表格驅動測試。
把輸入和輸出放到同一個結構體內,然後循環去執行測試,把測試不通過的測試案例輸出出來,並且符上正確答案,這種方法更加的直觀一點,也更加的方便,在Go語言中我們使用這種方法測試更加的簡單一點,別的語言如果使用這測試方法可能全非常的麻煩。
測試程式碼覆蓋率
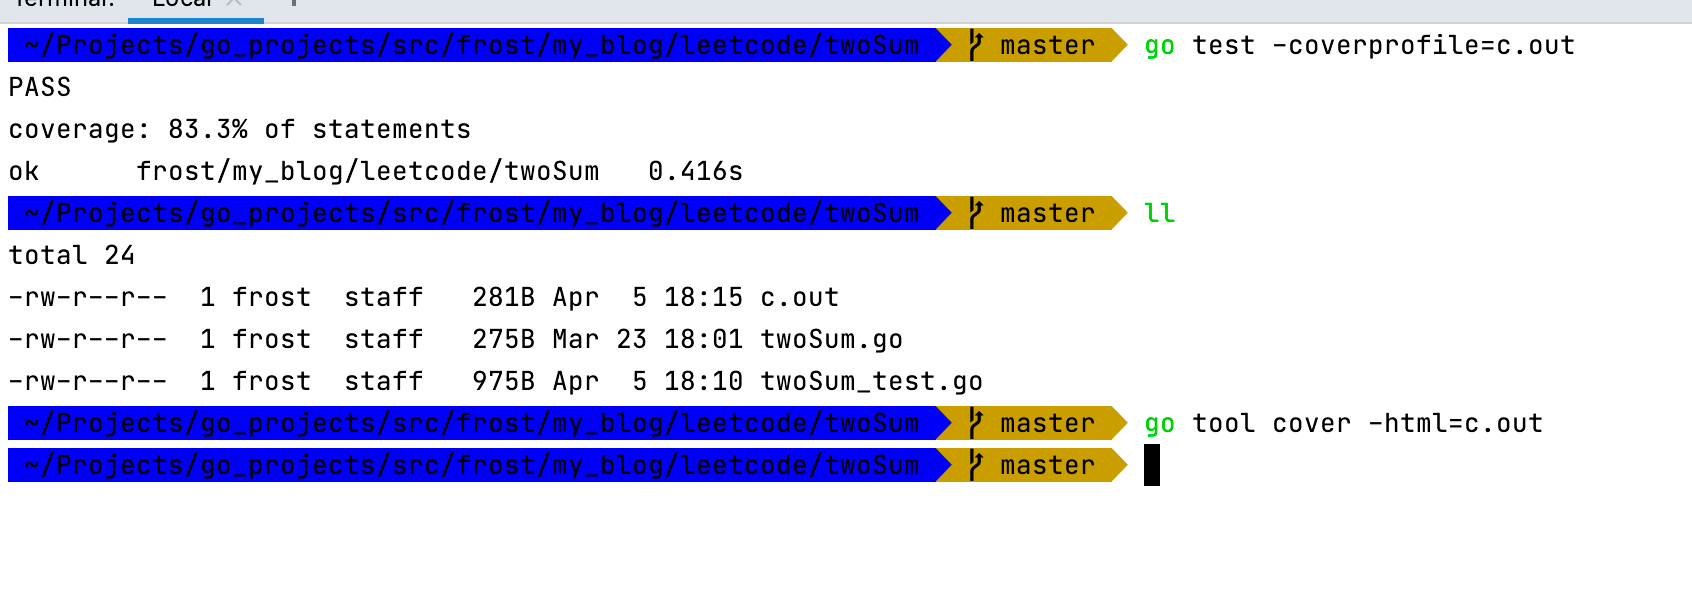
使用命令go test -coverprofile=c.out 成生程式碼覆蓋率文件。
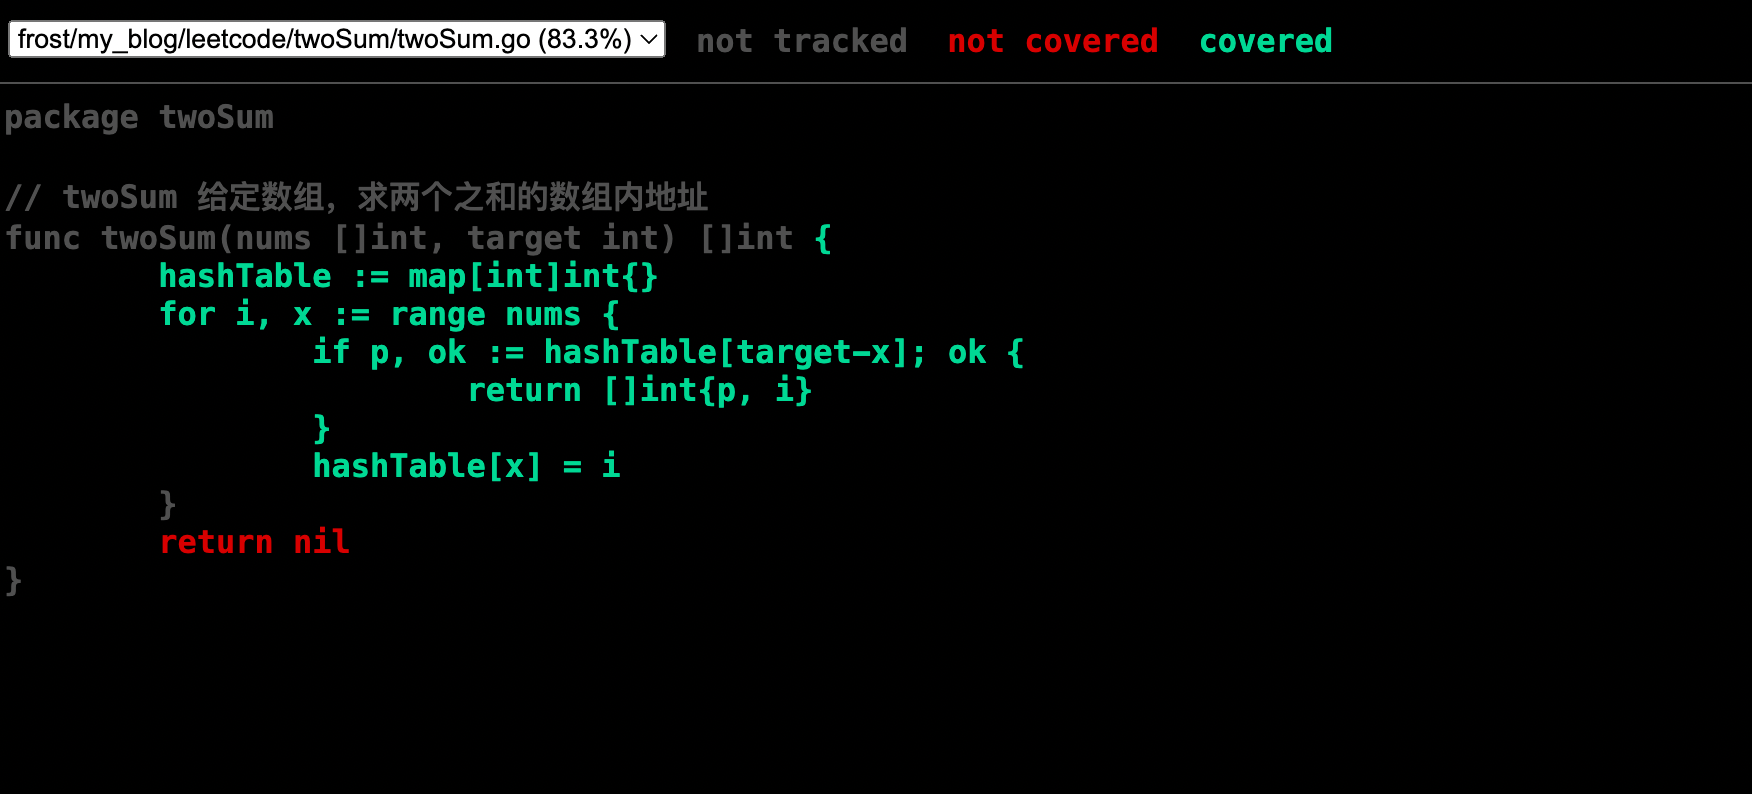
然後通過 go tool cover -html=c.out查看文件內容:
性能測試
一般我們寫完測試程式碼之後,這個函數的測試工作就算完成了,但是有時當一個函數特別重要時,我還還需要對這個函數進行性能測試,Go語言也對性能測試提供了支援:
func BenchmarkTwoSum(b *testing.B) {
	nums := []int{2, 7, 11, 15, 24, 22, 44}
	target := 9
	source := []int{0, 1}
	b.ResetTimer()
	for i := 0; i < b.N; i++ {
		sum := twoSum(nums, target)
		for i, v := range sum {
			if source[i] != v {
				fmt.Printf("nums:%v,target:%v,right:%v,source:%v", nums, target, sum, source)
			}
		}
	}
}
函數名以Benchmark開頭,以要測試的函數名結尾。函數體為測試內容。
b.ResetTimer() // 數據準備完成,從這一行對性能進行統計
b.N // 循環的次數由系統決定
使用命令對函數進行測試:
go test -bench .
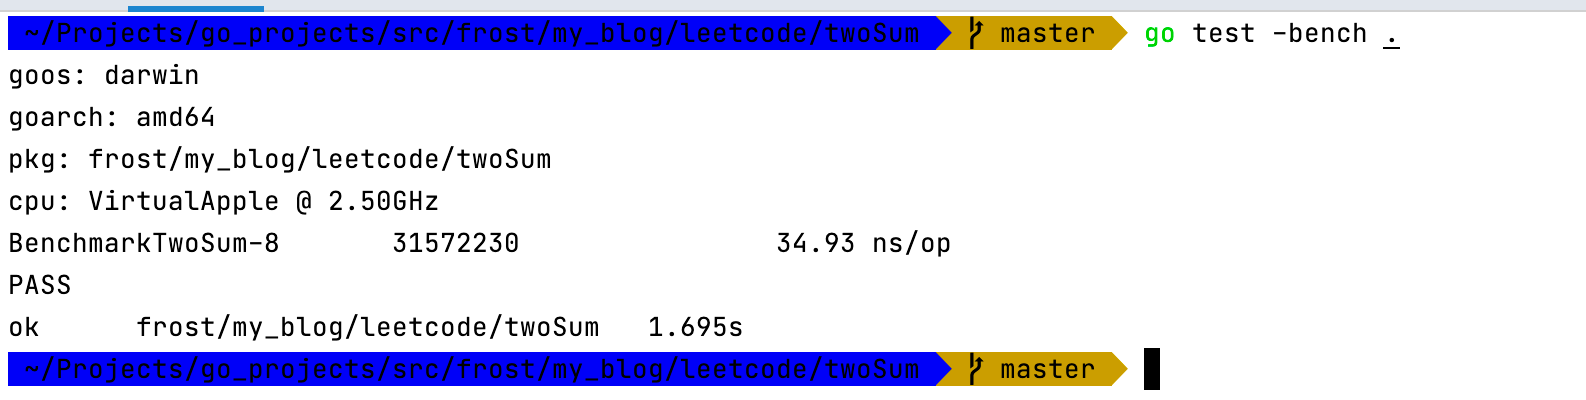
以上就是測試內容,一共運行了:31572230 次,每次用時 34.93 ns
當然,有時我們想知道這個函數的性能瓶頸在那我們也可以通過命令來實現:
# 通過命令生成性能測試文件
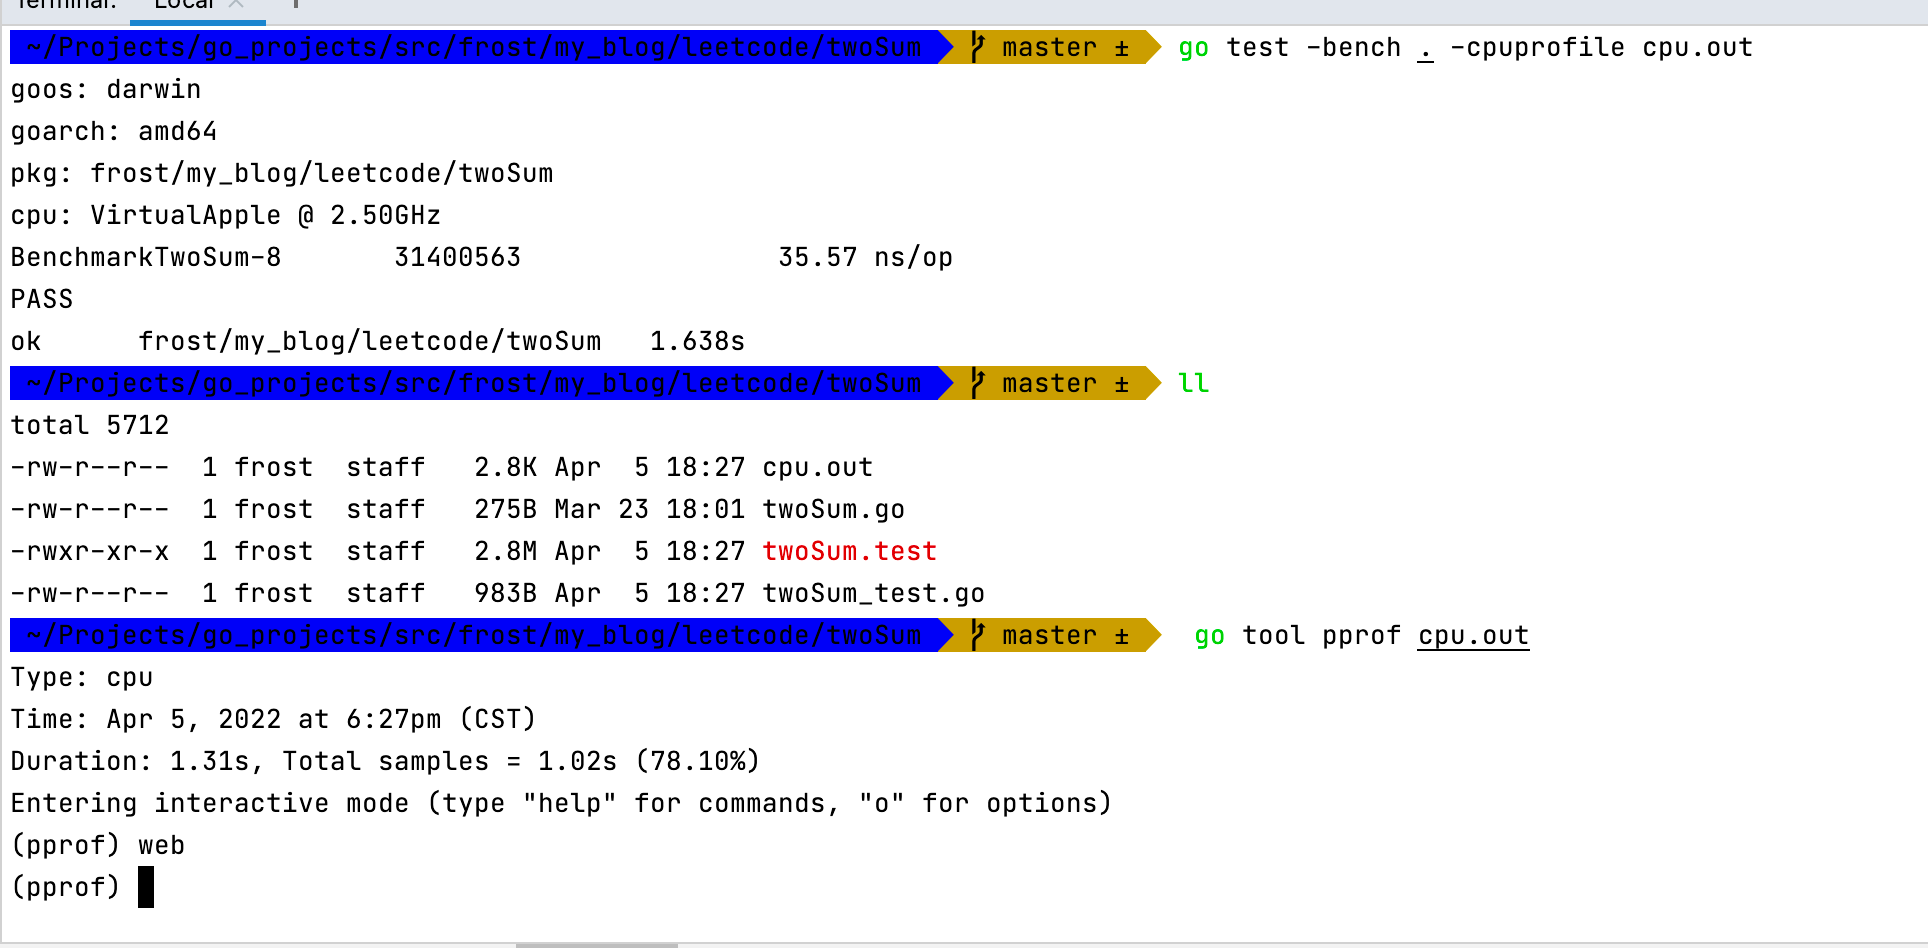
go test -bench . -cpuprofile cpu.out
# 能過web方式查看性能文件
go tool pprof cpu.out
# 最後輸入 web 後會自動彈出網頁
web
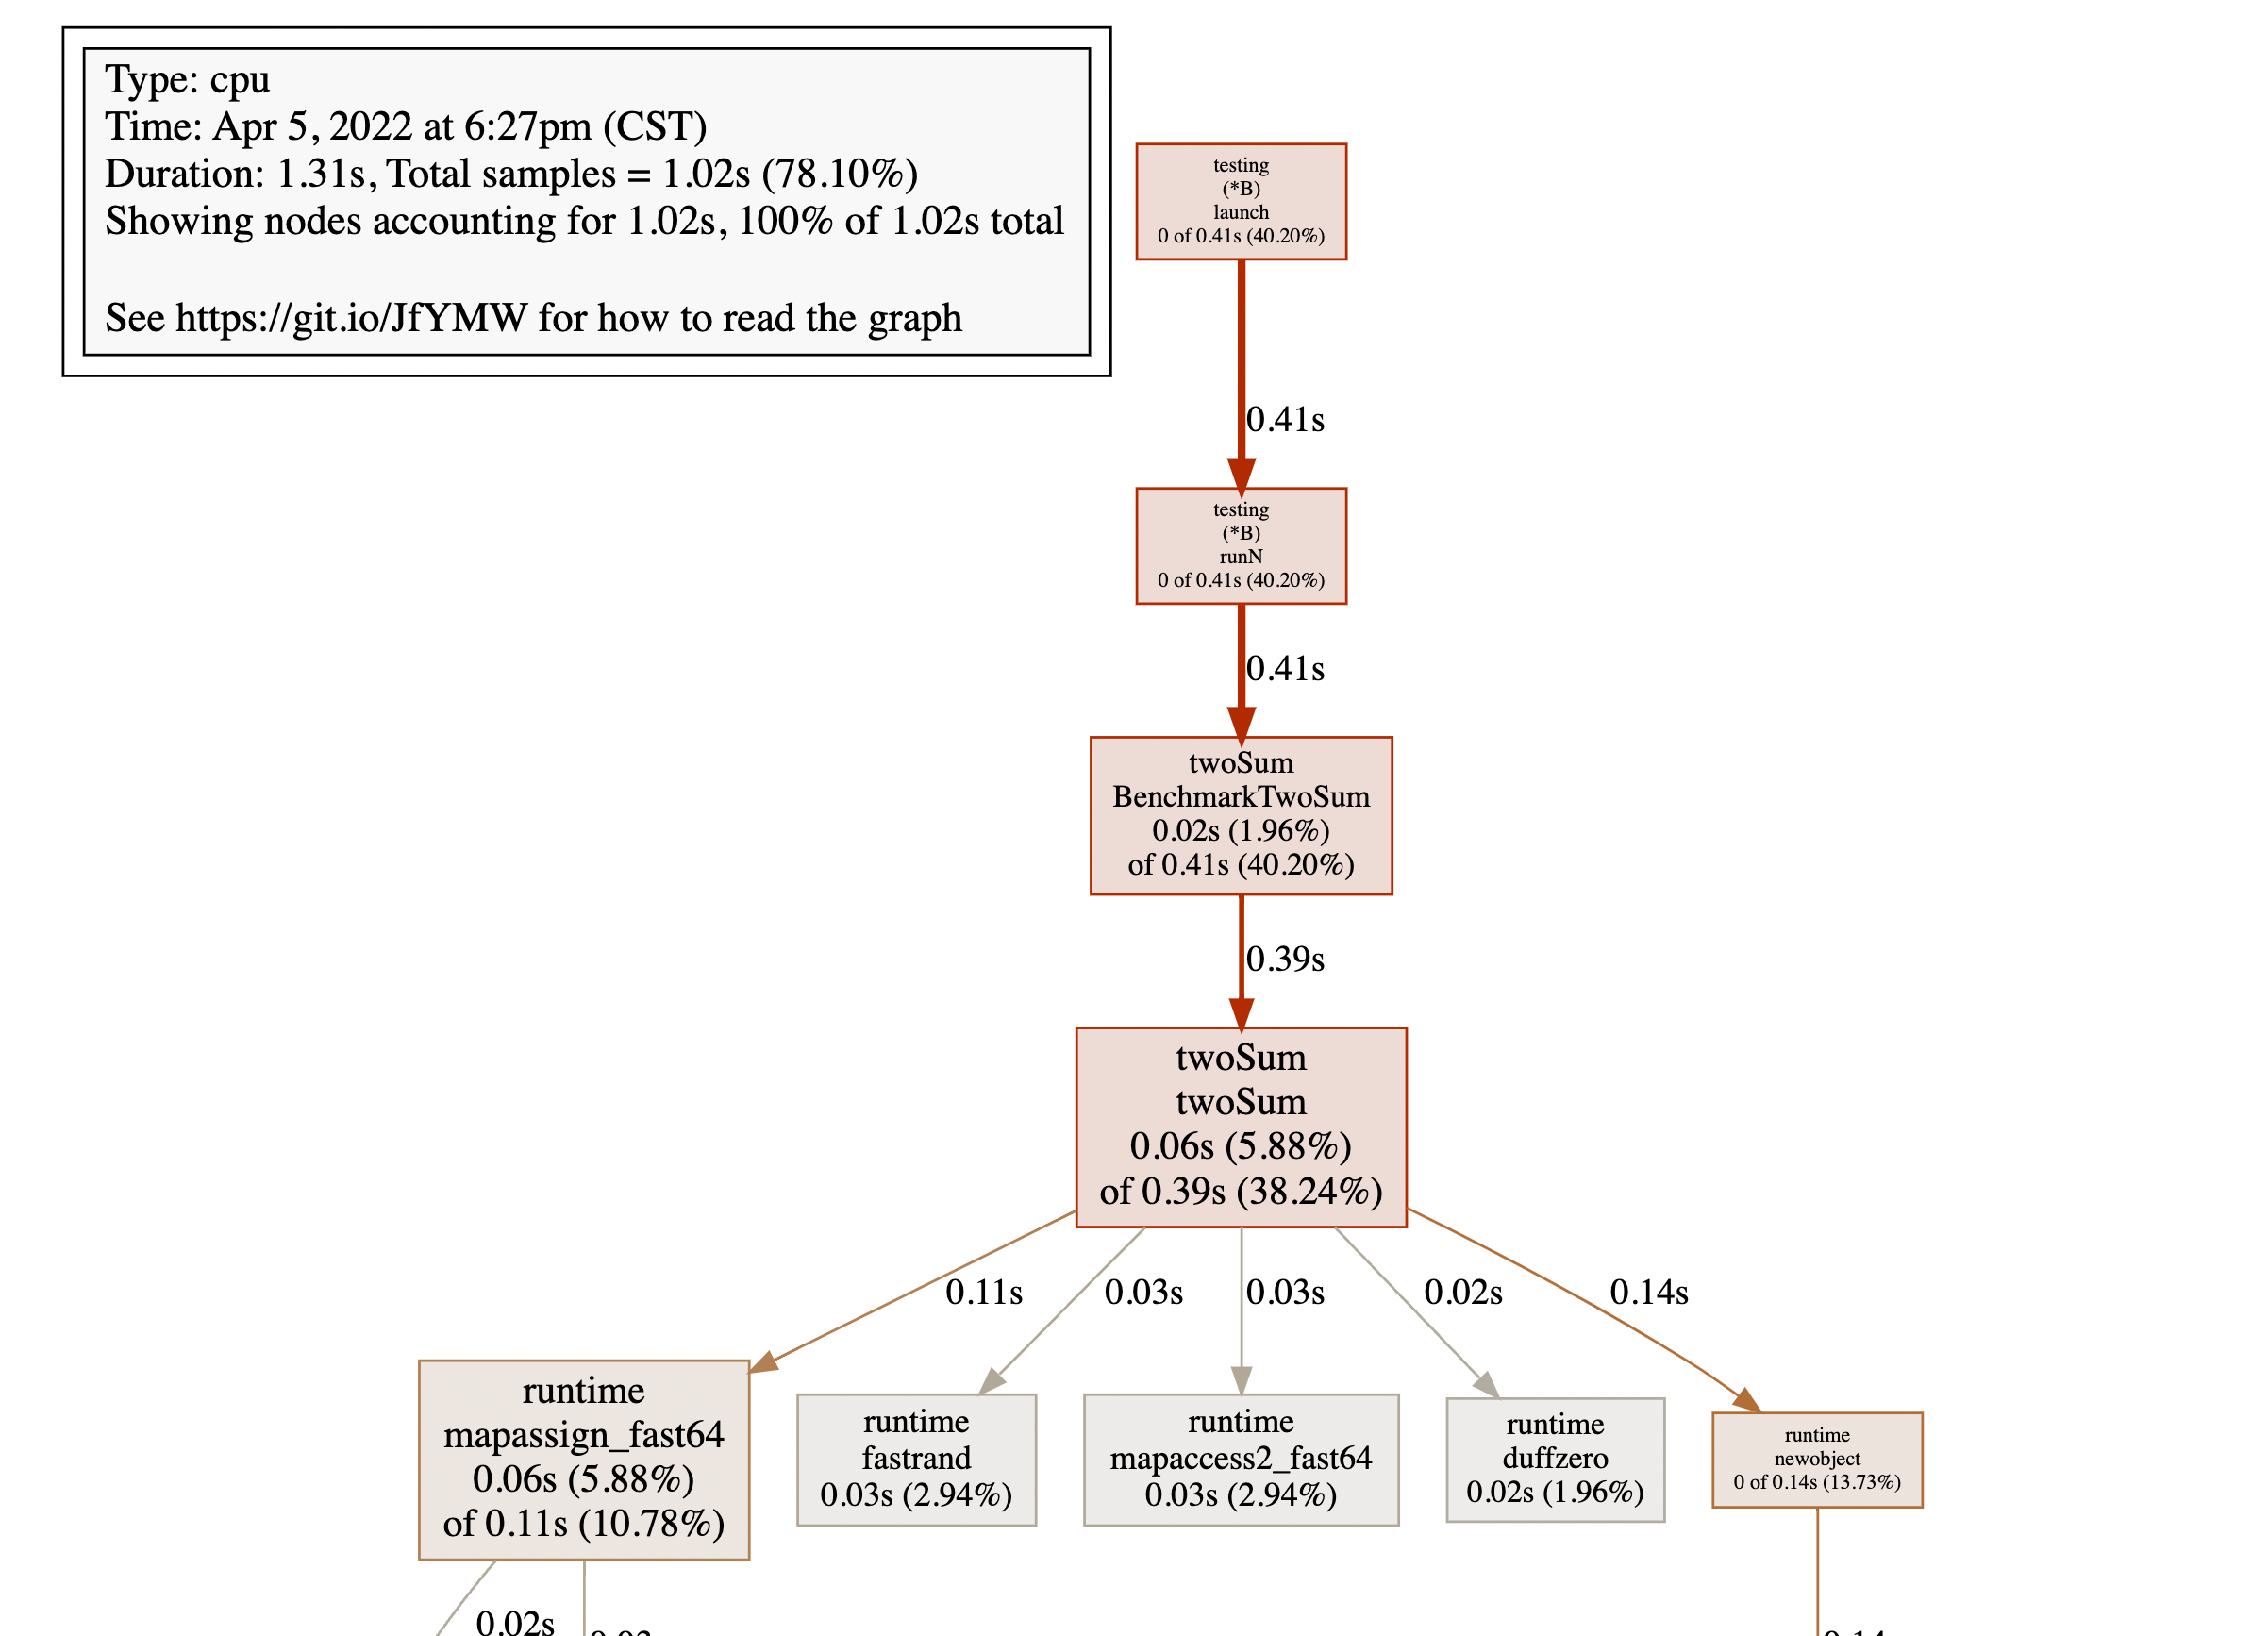
通過網頁我們可以更直觀的看到性能瓶頸在那。
如果想要查看性能文件必須提前安裝:graphviz
關注公眾號,隨時獲取最新資訊

細節決定成敗!
個人愚見,如有不對,懇請斧正!


