帶你十天輕鬆搞定 Go 微服務系列(八、服務監控)
序言
我們通過一個系列文章跟大家詳細展示一個 go-zero 微服務示例,整個系列分十篇文章,目錄結構如下:
- 環境搭建
- 服務拆分
- 用戶服務
- 產品服務
- 訂單服務
- 支付服務
- RPC 服務 Auth 驗證
- 服務監控(本文)
- 鏈路追蹤
- 分散式事務
期望通過本系列帶你在本機利用 Docker 環境利用 go-zero 快速開發一個商城系統,讓你快速上手微服務。
完整示例程式碼://github.com/nivin-studio/go-zero-mall
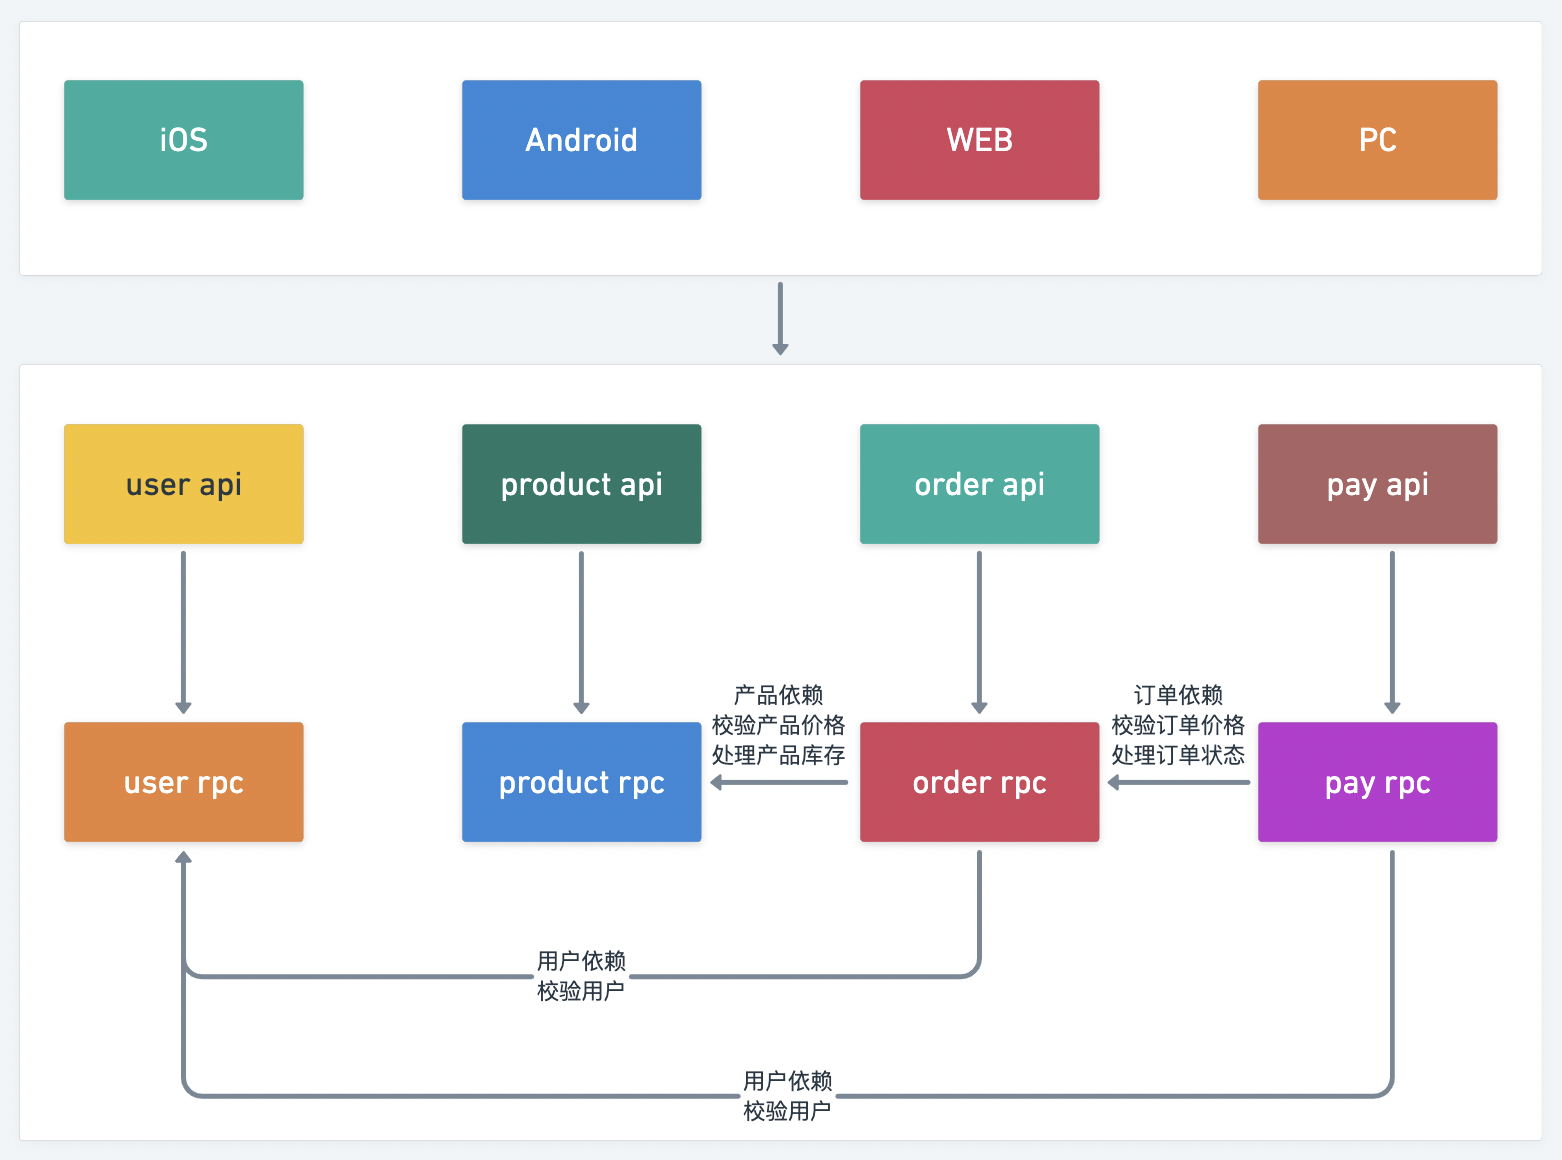
首先,我們來看一下整體的服務拆分圖:
8.1 Prometheus 介紹
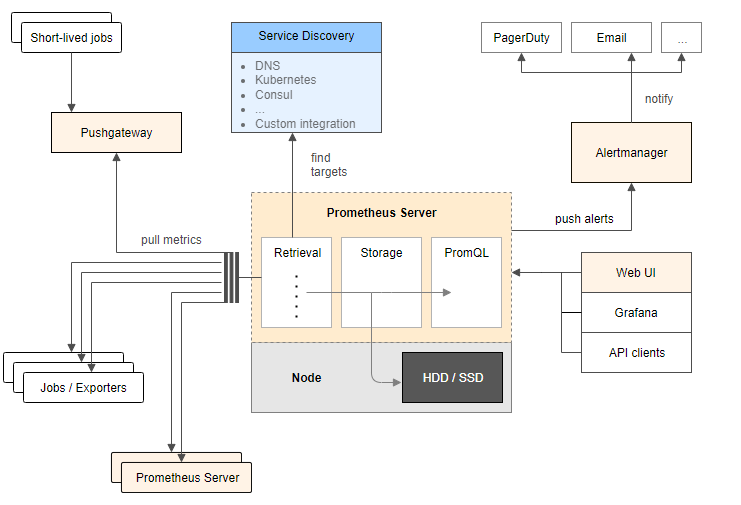
Prometheus 是一款基於時序資料庫的開源監控告警系統,基本原理是通過 HTTP 協議周期性抓取被監控服務的狀態,任意服務只要提供對應的 HTTP 介面就可以接入監控。不需要任何 SDK 或者其他的集成過程,輸出被監控服務資訊的 HTTP 介面被叫做 exporter 。目前互聯網公司常用的服務大部分都有 exporter 可以直接使用,比如 Varnish、Haproxy、Nginx、MySQL、Linux 系統資訊(包括磁碟、記憶體、CPU、網路等等)。Promethus 有以下特點:
- 支援多維數據模型(由度量名和鍵值對組成的時間序列數據)
- 支援
PromQL查詢語言,可以完成非常複雜的查詢和分析,對圖表展示和告警非常有意義 - 不依賴分散式存儲,單點伺服器也可以使用
- 支援
HTTP協議主動拉取方式採集時間序列數據 - 支援
PushGateway推送時間序列數據 - 支援服務發現和靜態配置兩種方式獲取監控目標
- 支援接入
Grafana
8.2 go-zero 使用 Prometheus 監控服務
go-zero 框架中集成了基於 Prometheus 的服務指標監控,go-zero 目前在 http 的中間件和 rpc 的攔截器中添加了對請求指標的監控。
主要從 請求耗時 和 請求錯誤 兩個維度,請求耗時採用了 Histogram 指標類型定義了多個 Buckets 方便進行分位統計,請求錯誤採用了 Counter 類型,並在 http metric 中添加了 path 標籤,rpc metric 中添加了 method 標籤以便進行細分監控。
接下來我們分別為前面幾章實現的服務添加 Prometheus 監控,首先我們先回顧下 第二章 服務拆分,為了模擬服務的分散式部署,我們是在一個容器里啟動了所有的服務,並為其分配了不同的埠號。下面我們再為這些服務分配一個 Prometheus 採集指標數據的埠號。
| 服務 | api 服務埠號 |
rpc 服務埠號 |
api 指標採集埠號 |
rpc 指標採集埠號 |
|---|---|---|---|---|
user |
8000 | 9000 | 9080 | 9090 |
product |
8001 | 9001 | 9081 | 9091 |
order |
8002 | 9002 | 9082 | 9092 |
pay |
8003 | 9003 | 9083 | 9093 |
8.2.1 添加 user api 服務 Prometheus 配置
$ vim mall/service/user/api/etc/user.yaml
Name: User
Host: 0.0.0.0
Port: 8000

...

Prometheus:
  Host: 0.0.0.0
  Port: 9080
  Path: /metrics
8.2.2 添加 user rpc 服務 Prometheus 配置
$ vim mall/service/user/rpc/etc/user.yaml
Name: user.rpc
ListenOn: 0.0.0.0:9000

...

Prometheus:
  Host: 0.0.0.0
  Port: 9090
  Path: /metrics
8.2.3 添加 product api 服務 Prometheus 配置
$ vim mall/service/product/api/etc/product.yaml
Name: Product
Host: 0.0.0.0
Port: 8001

...

Prometheus:
  Host: 0.0.0.0
  Port: 9081
  Path: /metrics
8.2.4 添加 product rpc 服務 Prometheus 配置
$ vim mall/service/product/rpc/etc/product.yaml
Name: product.rpc
ListenOn: 0.0.0.0:9001

...

Prometheus:
  Host: 0.0.0.0
  Port: 9091
  Path: /metrics
8.2.5 添加 order api 服務 Prometheus 配置
$ vim mall/service/order/api/etc/order.yaml
Name: Order
Host: 0.0.0.0
Port: 8002

...

Prometheus:
  Host: 0.0.0.0
  Port: 9082
  Path: /metrics
8.2.6 添加 order rpc 服務 Prometheus 配置
$ vim mall/service/order/rpc/etc/order.yaml
Name: order.rpc
ListenOn: 0.0.0.0:9002

...

Prometheus:
  Host: 0.0.0.0
  Port: 9092
  Path: /metrics
8.2.7 添加 pay api 服務 Prometheus 配置
$ vim mall/service/pay/api/etc/pay.yaml
Name: Pay
Host: 0.0.0.0
Port: 8003

...

Prometheus:
  Host: 0.0.0.0
  Port: 9083
  Path: /metrics
8.2.8 添加 pay rpc 服務 Prometheus 配置
$ vim mall/service/pay/rpc/etc/pay.yaml
Name: pay.rpc
ListenOn: 0.0.0.0:9003

...

Prometheus:
  Host: 0.0.0.0
  Port: 9093
  Path: /metrics
提示:配置修改後,需要重啟服務才會生效。
8.2.9 修改 Prometheus 配置
在 第一章 環境搭建 中我們集成了 Prometheus 服務,在prometheus 目錄下有個 prometheus.yml 的配置文件,我們現在需要修改這個配置文件。
# my global config
global:
  scrape_interval: 15s # Set the scrape interval to every 15 seconds. Default is every 1 minute.
  evaluation_interval: 15s # Evaluate rules every 15 seconds. The default is every 1 minute.
  # scrape_timeout is set to the global default (10s).

# Alertmanager configuration
alerting:
  alertmanagers:
    - static_configs:
        - targets:
          # - alertmanager:9093

# Load rules once and periodically evaluate them according to the global 'evaluation_interval'.
rule_files:
  # - "first_rules.yml"
  # - "second_rules.yml"

# A scrape configuration containing exactly one endpoint to scrape:
# Here it's Prometheus itself.
scrape_configs:
  # The job name is added as a label `job=<job_name>` to any timeseries scraped from this config.
  - job_name: "prometheus"

    # metrics_path defaults to '/metrics'
    # scheme defaults to 'http'.

    static_configs:
      - targets: ["localhost:9090"]

  # 我們自己的商城項目配置
  - job_name: 'mall'
    static_configs:
      # 目標的採集地址
      - targets: ['golang:9080']
        labels:
          # 自定義標籤
          app: 'user-api'
          env: 'test'

      - targets: ['golang:9090']
        labels:
          app: 'user-rpc'
          env: 'test'

      - targets: ['golang:9081']
        labels:
          app: 'product-api'
          env: 'test'

      - targets: ['golang:9091']
        labels:
          app: 'product-rpc'
          env: 'test'

      - targets: ['golang:9082']
        labels:
          app: 'order-api'
          env: 'test'

      - targets: ['golang:9092']
        labels:
          app: 'order-rpc'
          env: 'test'

      - targets: ['golang:9083']
        labels:
          app: 'pay-api'
          env: 'test'

      - targets: ['golang:9093']
        labels:
          app: 'pay-rpc'
          env: 'test'
提示:配置文件修改好後,需要重啟
Prometheus服務容器才能生效。
8.2.10 訪問 Prometheus 可視化介面
- 在 第一章 環境搭建 中我們集成了
Prometheus服務,並為其埠號9090做了宿主機埠3000的映射關係,所以在瀏覽器中輸入//127.0.0.1:3000/訪問Prometheus介面。
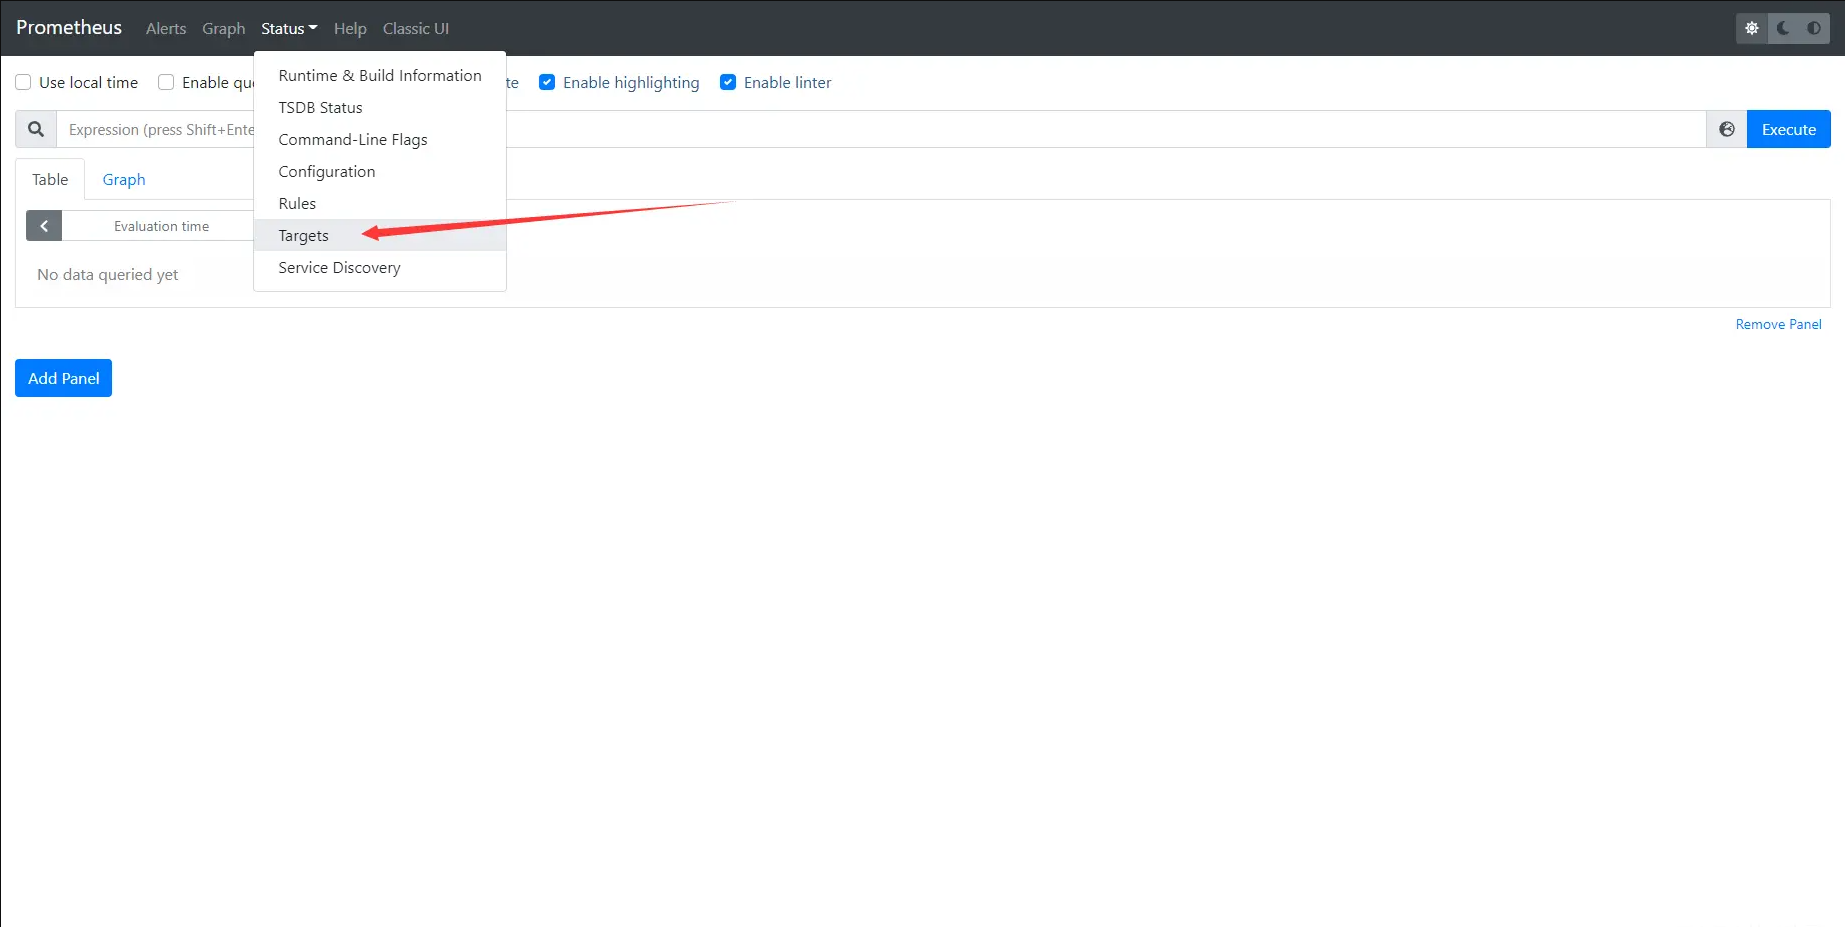
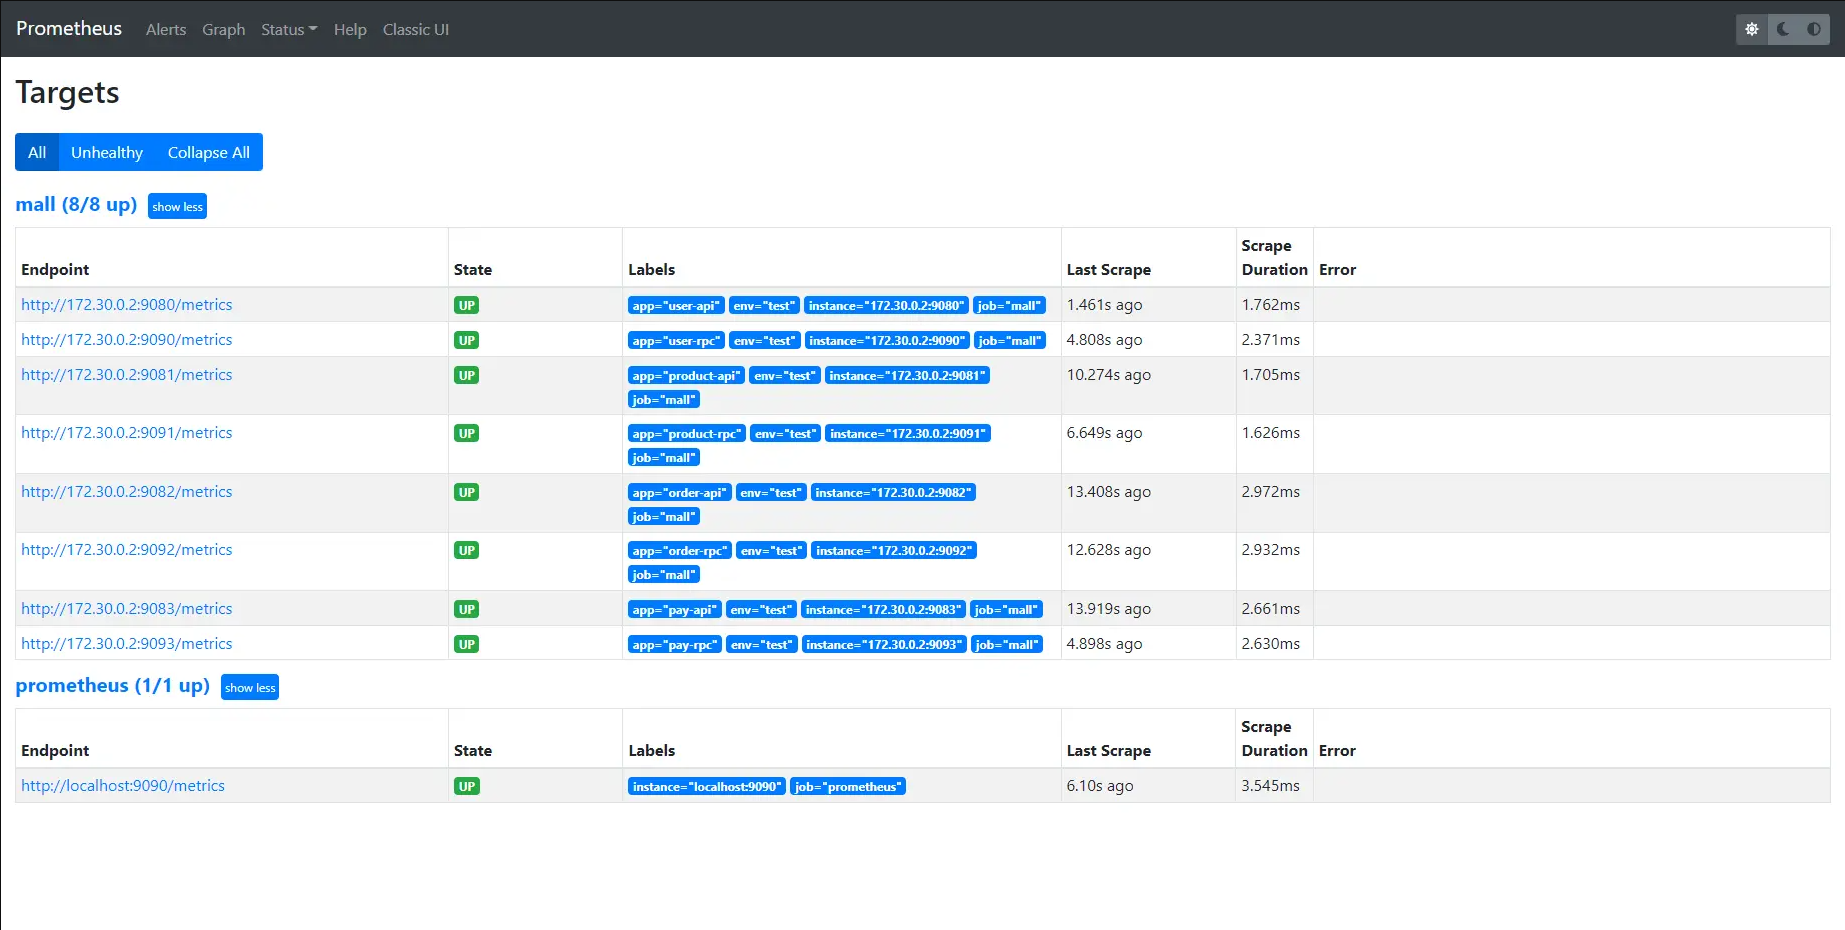
- 選擇
Status->Targets菜單,即可看到我們配置的採集目標的狀態和自定義的標籤。
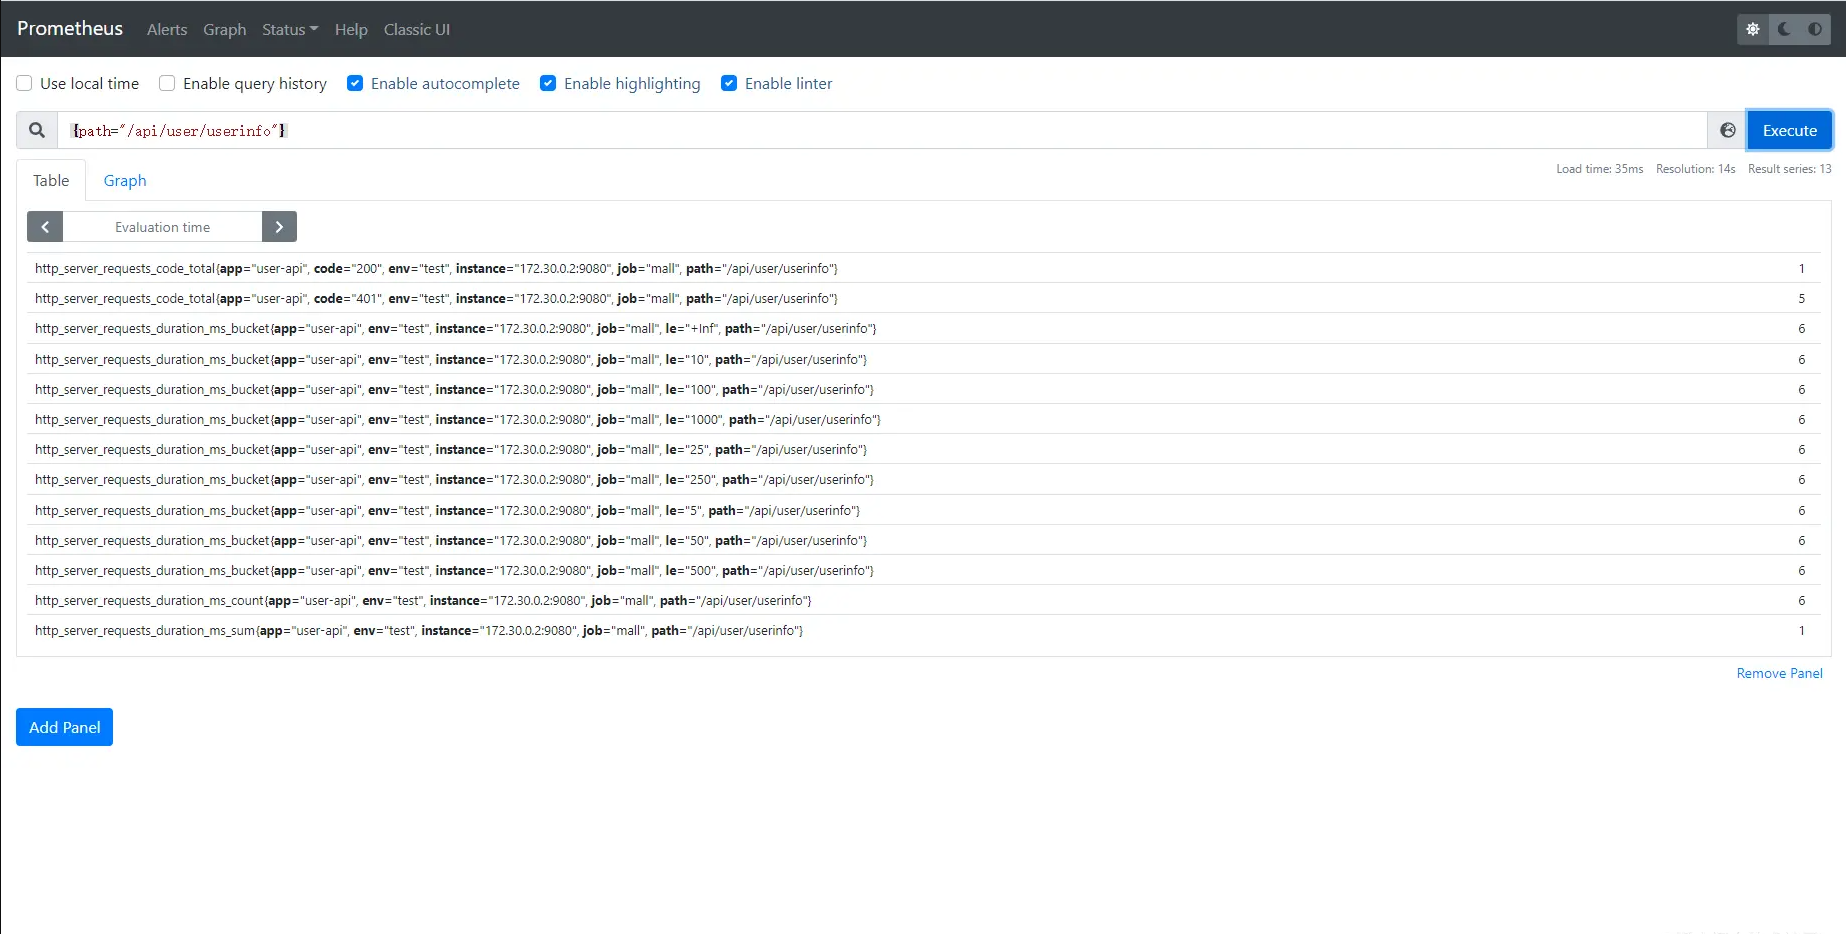
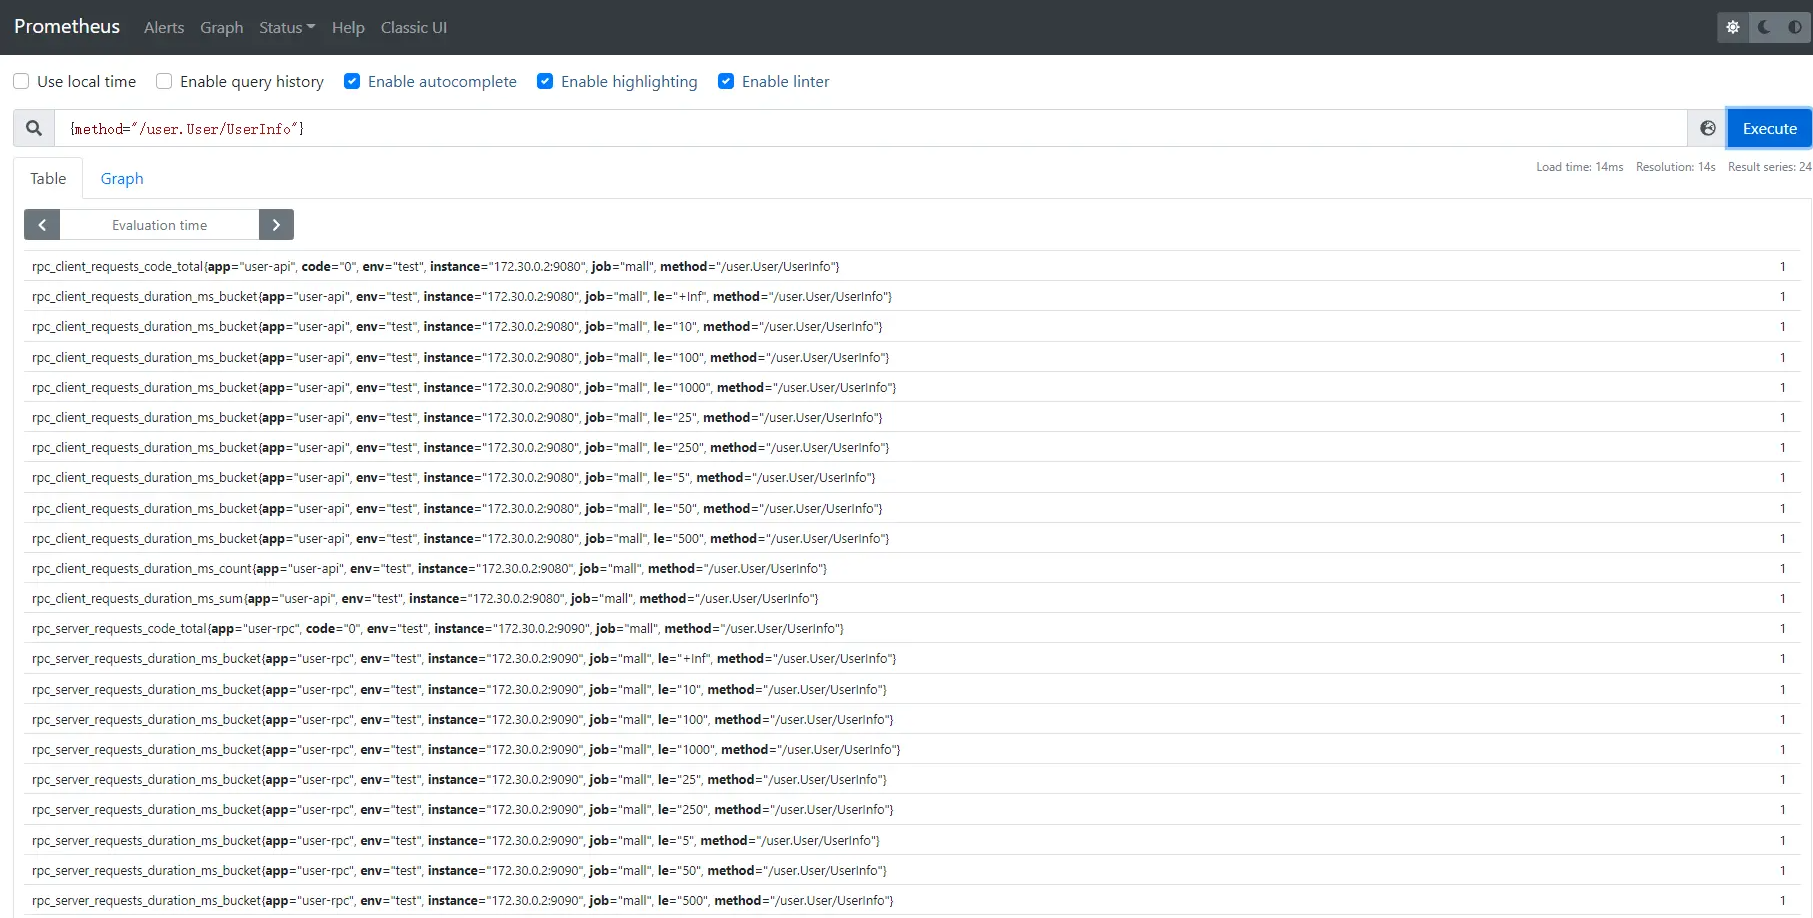
- 我們多次訪問
api服務的介面後,選擇Graph菜單,在查詢輸入框中輸入{path="api介面地址"}或者{method="rpc介面方法"}指令,即可查看監控指標。
8.3 使用 Grafana 可視化 Prometheus 指標數據
8.3.1 添加 Prometheus 數據源
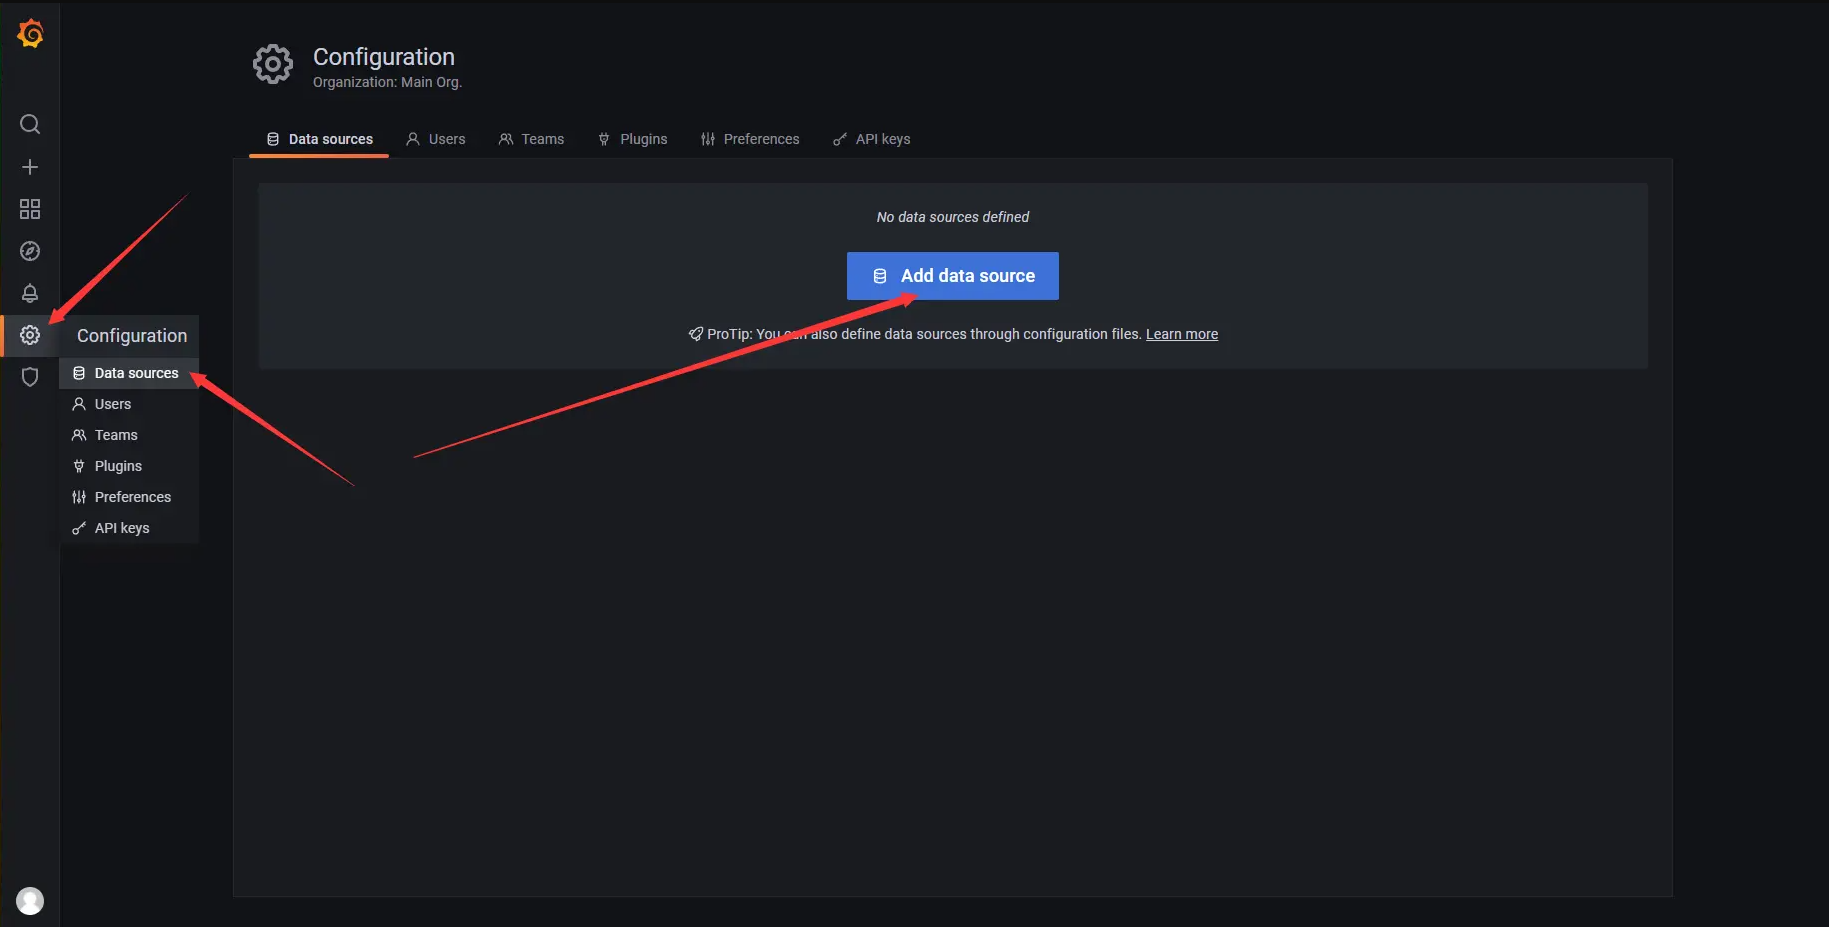
- 在 第一章 環境搭建 中我們集成了
Grafana服務,並為其埠號3000做了宿主機埠4000的映射關係,所以在瀏覽器中輸入//127.0.0.1:4000/訪問Grafana介面。點擊左側邊欄Configuration->Data Source->Add data source進行數據源添加。
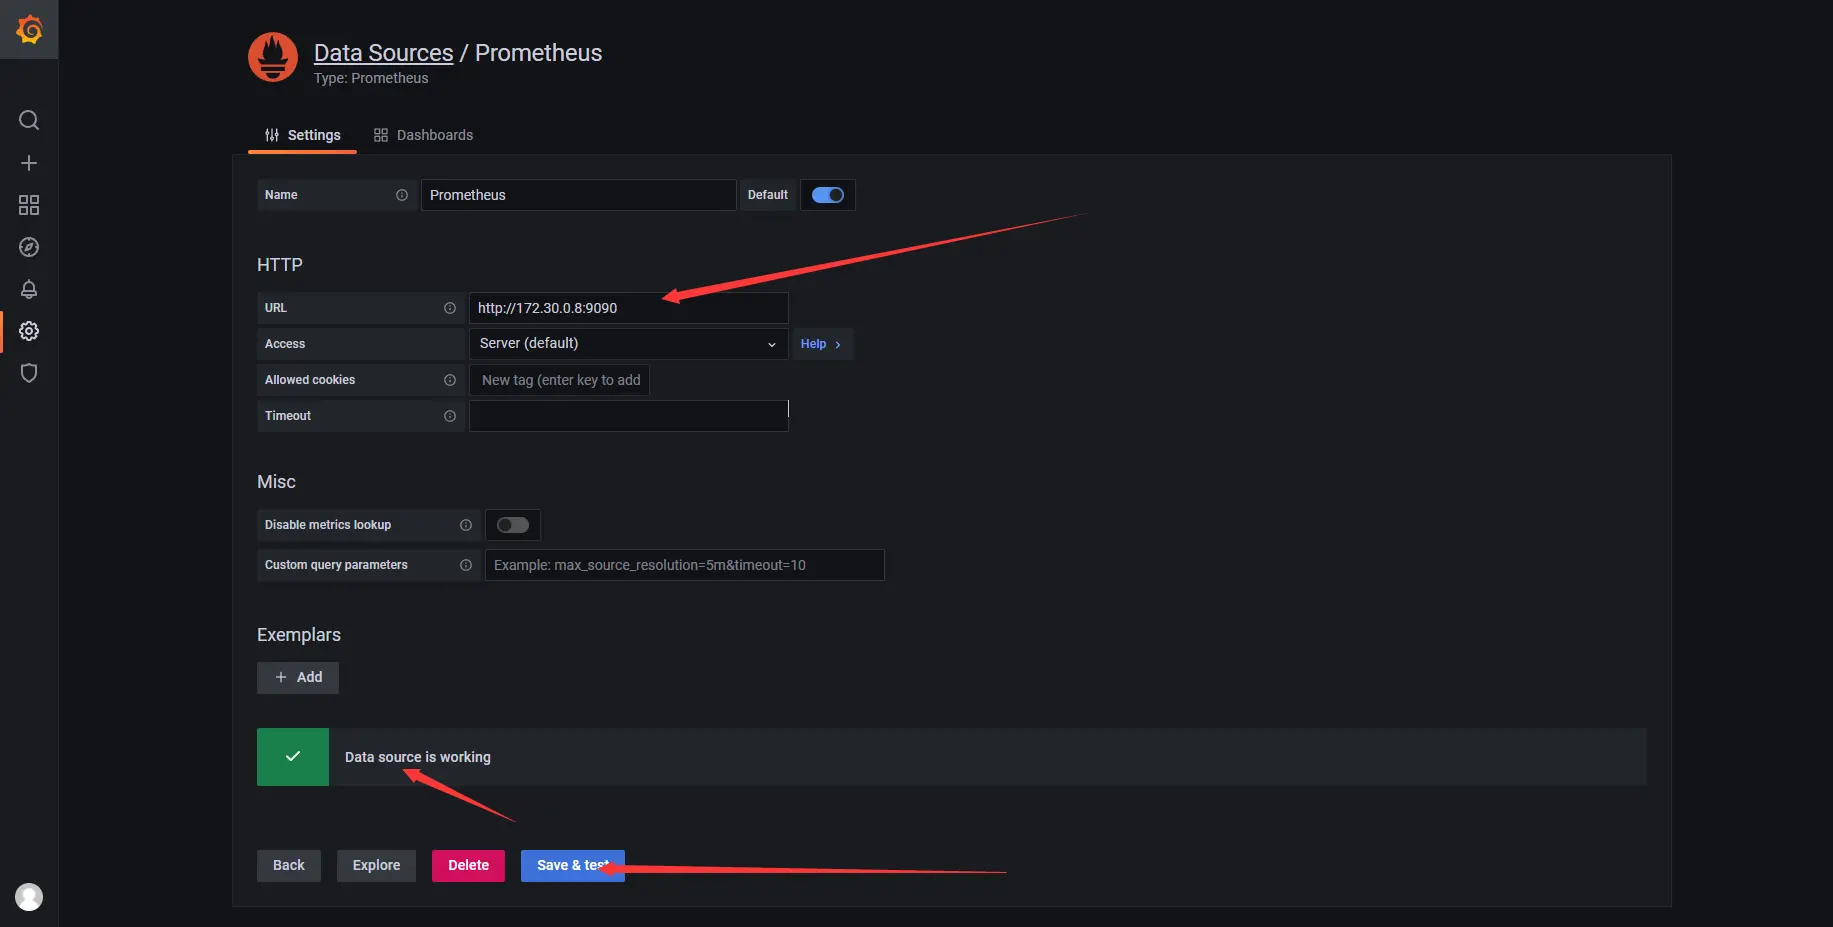
- 然後選擇
Prometheus數據源

- 填寫
HTTP配置中URL地址(我這裡的IP地址是Prometheus所在容器的IP地址),然後點擊Save & test按,上方會提示Data source is working,說明我們數據源添加成功且正常工作。
8.3.2 添加 Variables 用於服務篩選
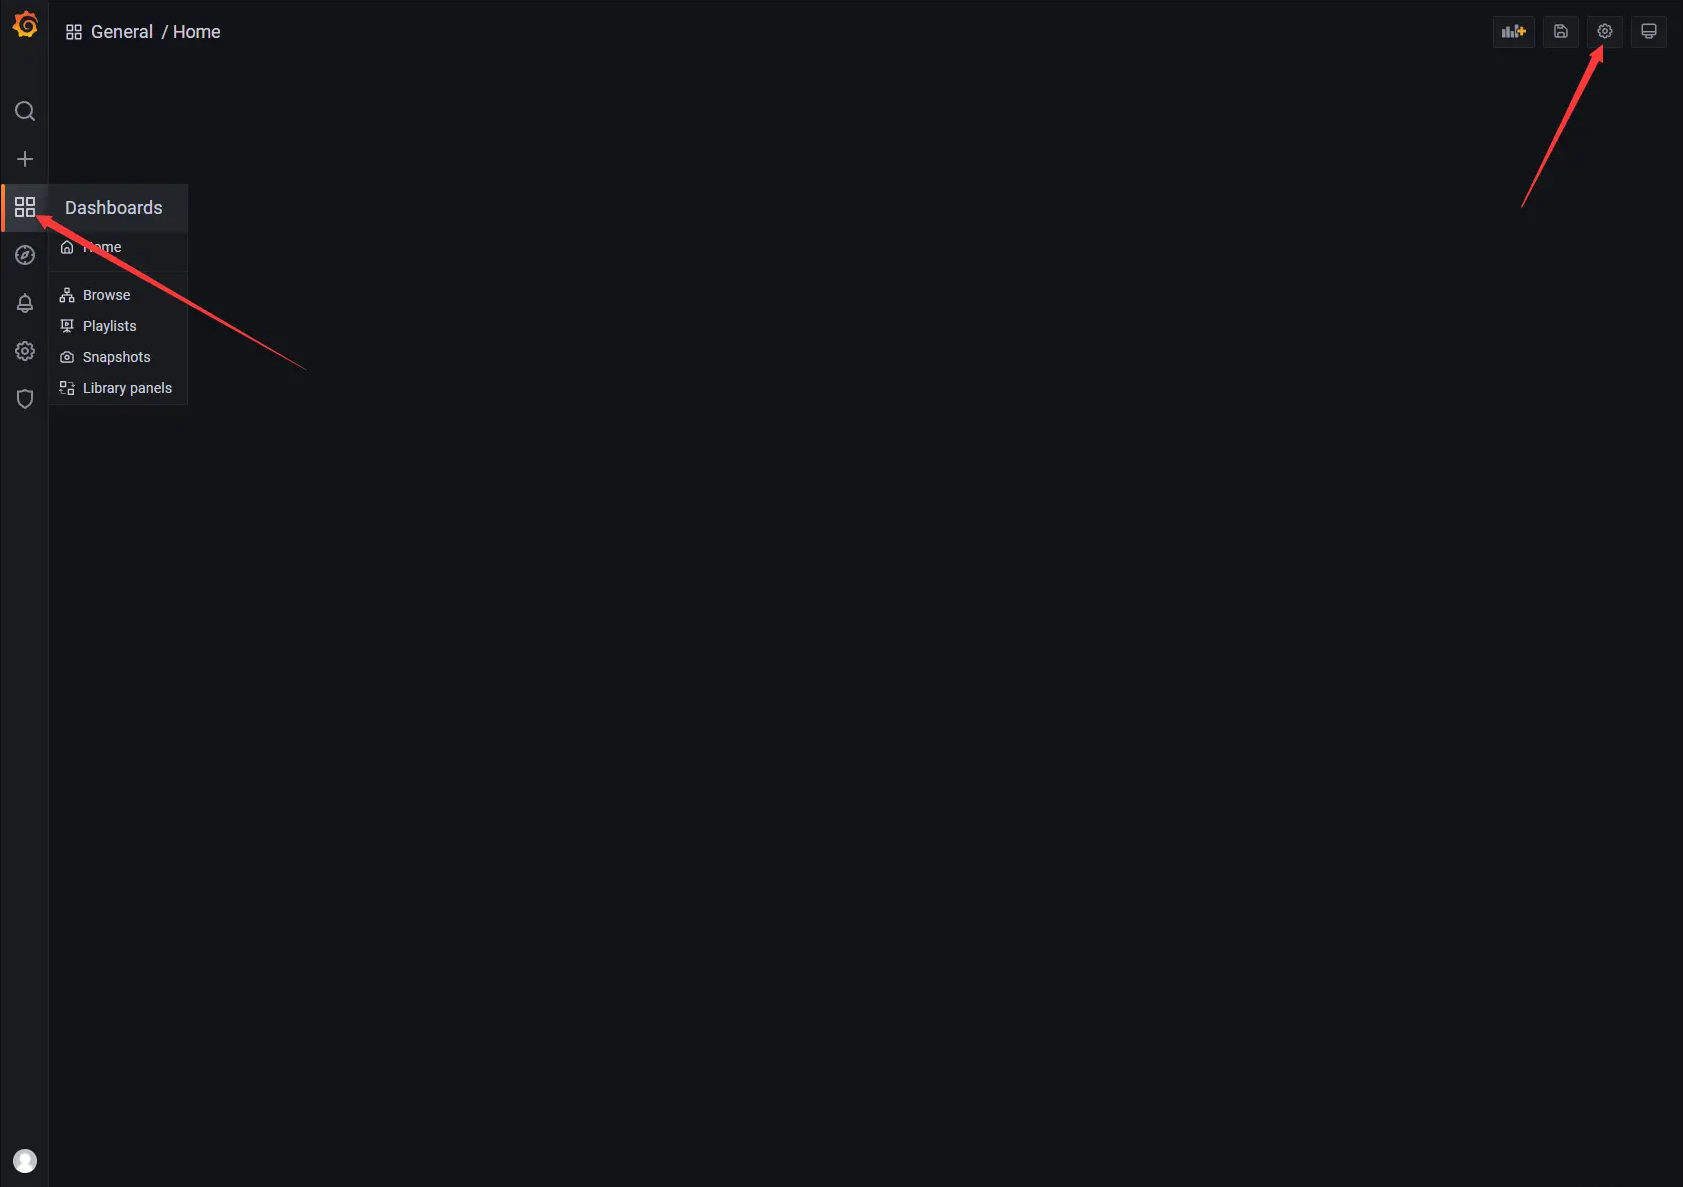
- 點擊左側邊欄
Dashboard選擇右上角Dashboard settings按鈕,在Settings頁面選擇Variables->Add variable添加變數,方便針對不同的標籤進行過濾篩選。
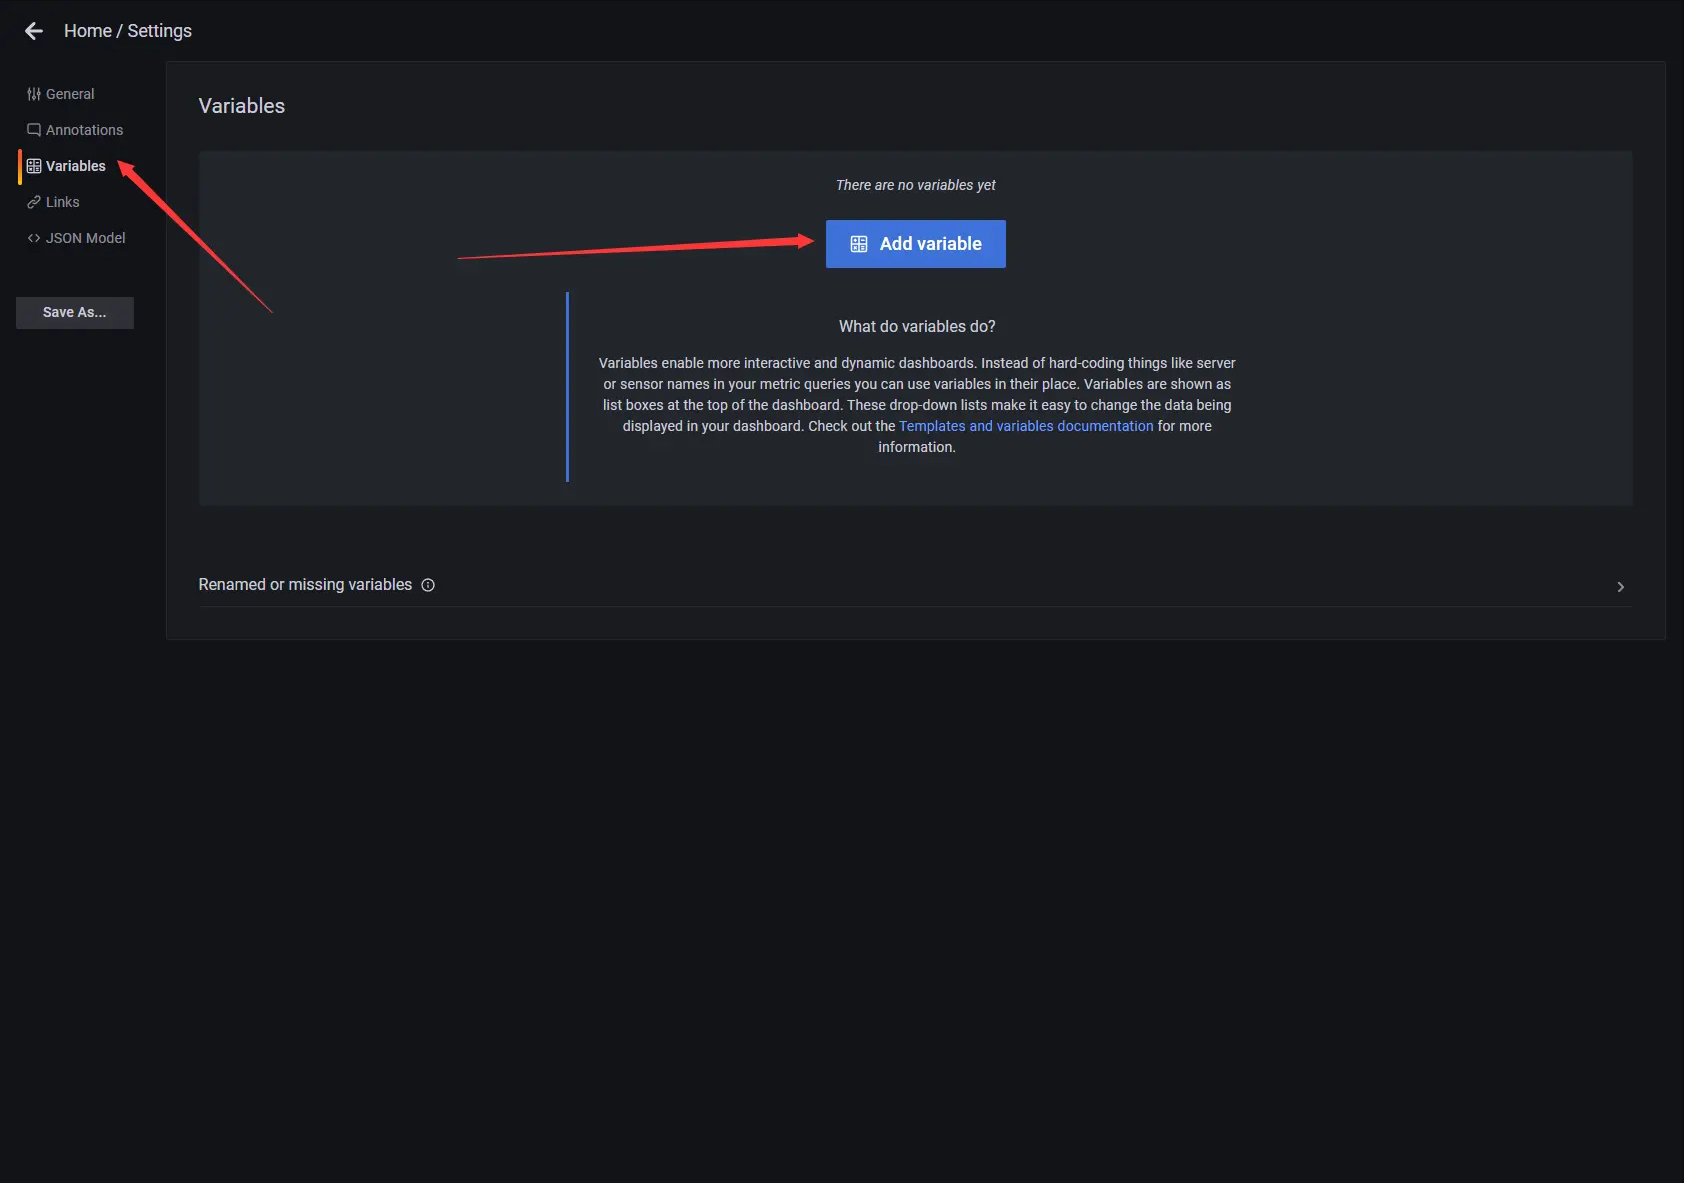
- 分別添加
api_appAPI服務名稱,rpc_appRPC服務名稱變數,用於不同服務的篩選。變數數據源選擇Prometheus數據源,使用正則表達式提取出對應的app標籤。


8.3.3 添加 api 介面 qps 儀錶盤
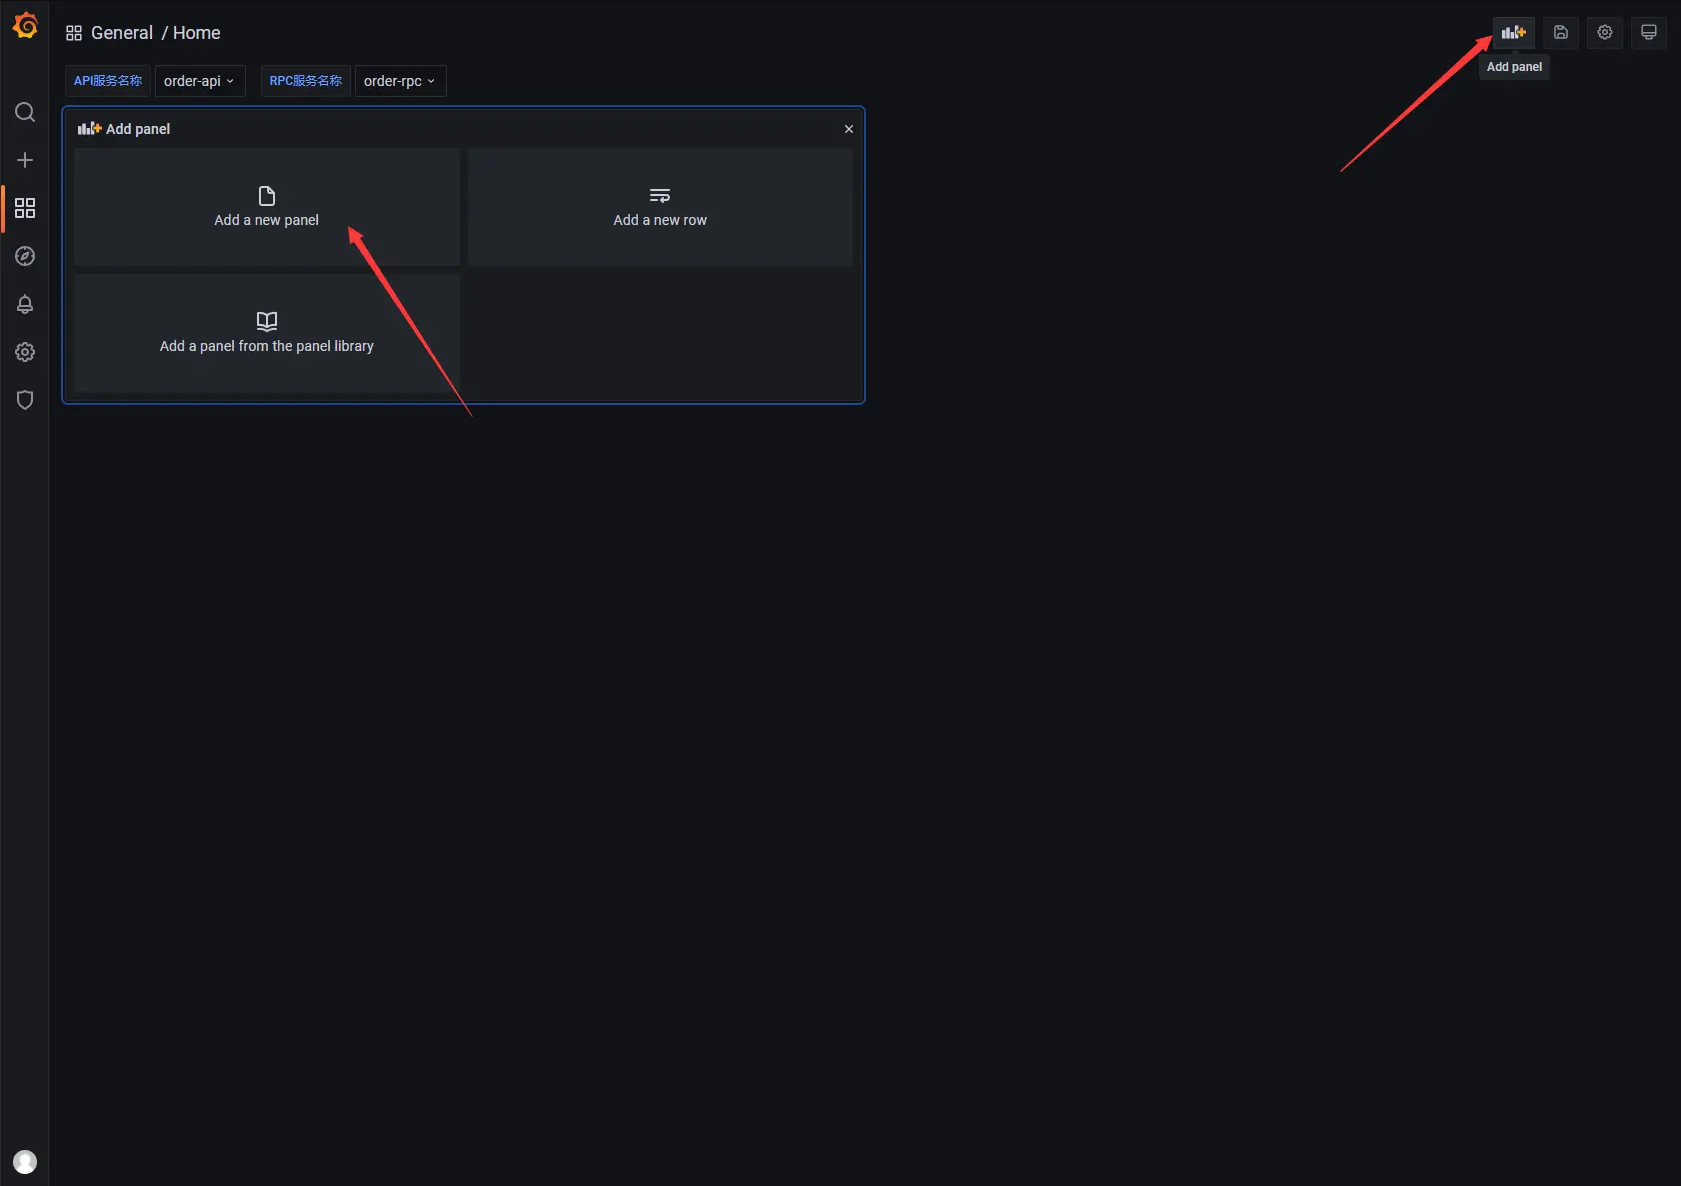
- 回到
Dashboard頁面選擇右上角Add panel按鈕,然後再選擇Add an empty panel添加一個空的面板。
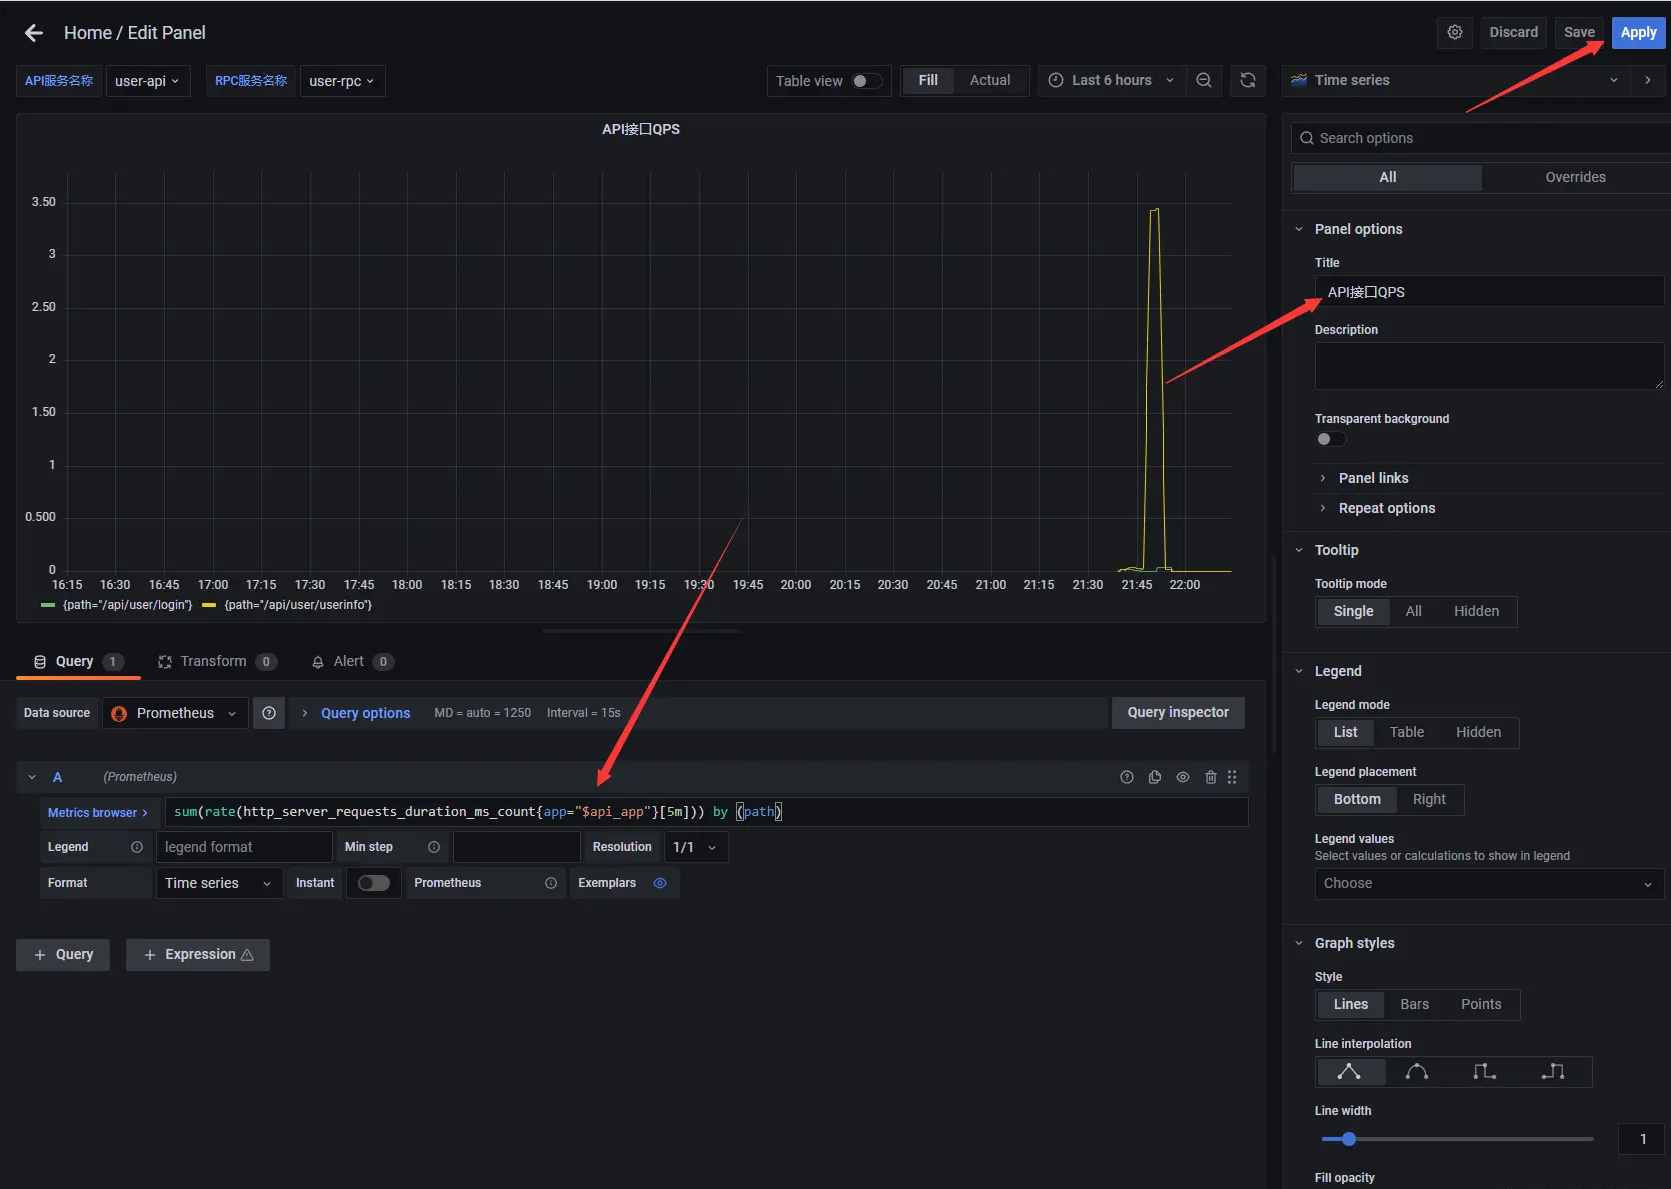
- 面板編輯頁,修改面板標題為
API介面QPS,在Metrics中輸入sum(rate(http_server_requests_duration_ms_count{app="$api_app"}[5m])) by (path)以path維度統計api介面的qps
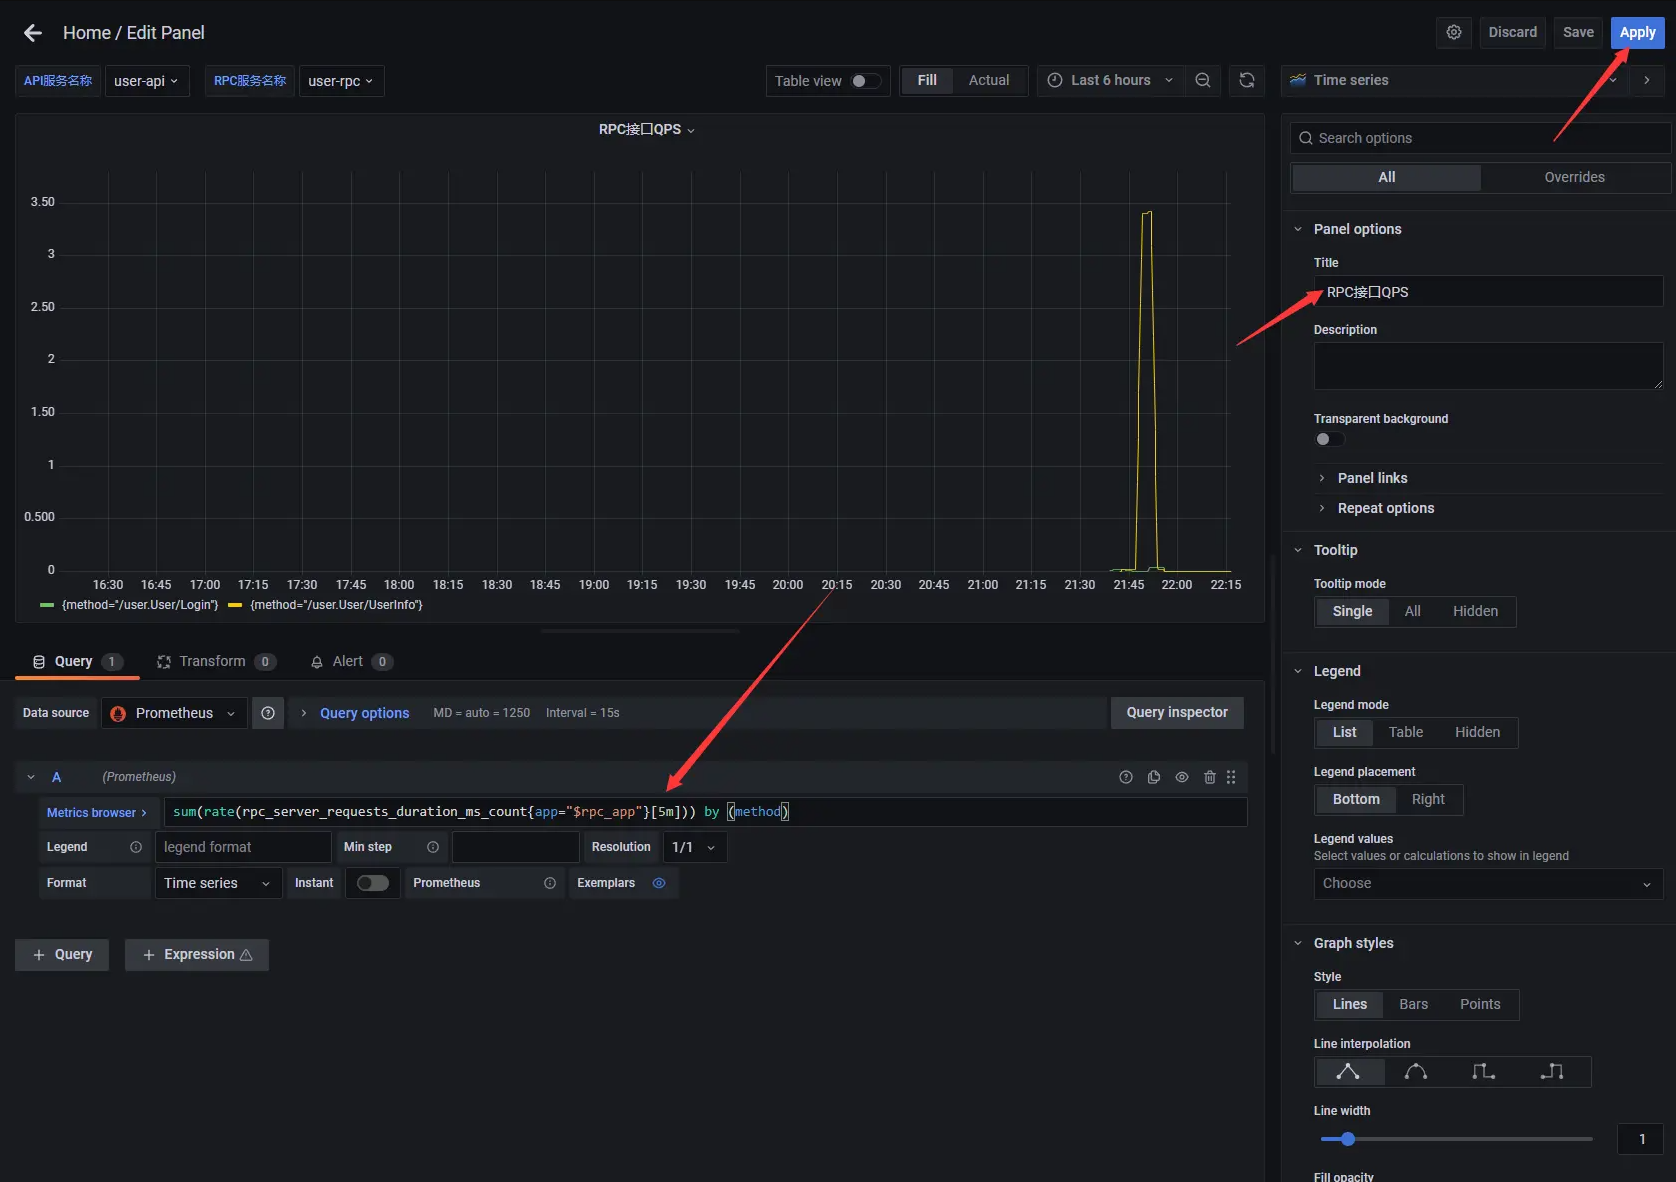
8.3.4 添加 rpc 介面 qps 儀錶盤
- 再新建一個面板,修改面板標題為
RPC介面QPS,在Metrics中輸入sum(rate(rpc_server_requests_duration_ms_count{app="$rpc_app"}[5m])) by (method)以method維度統計rpc介面的qps
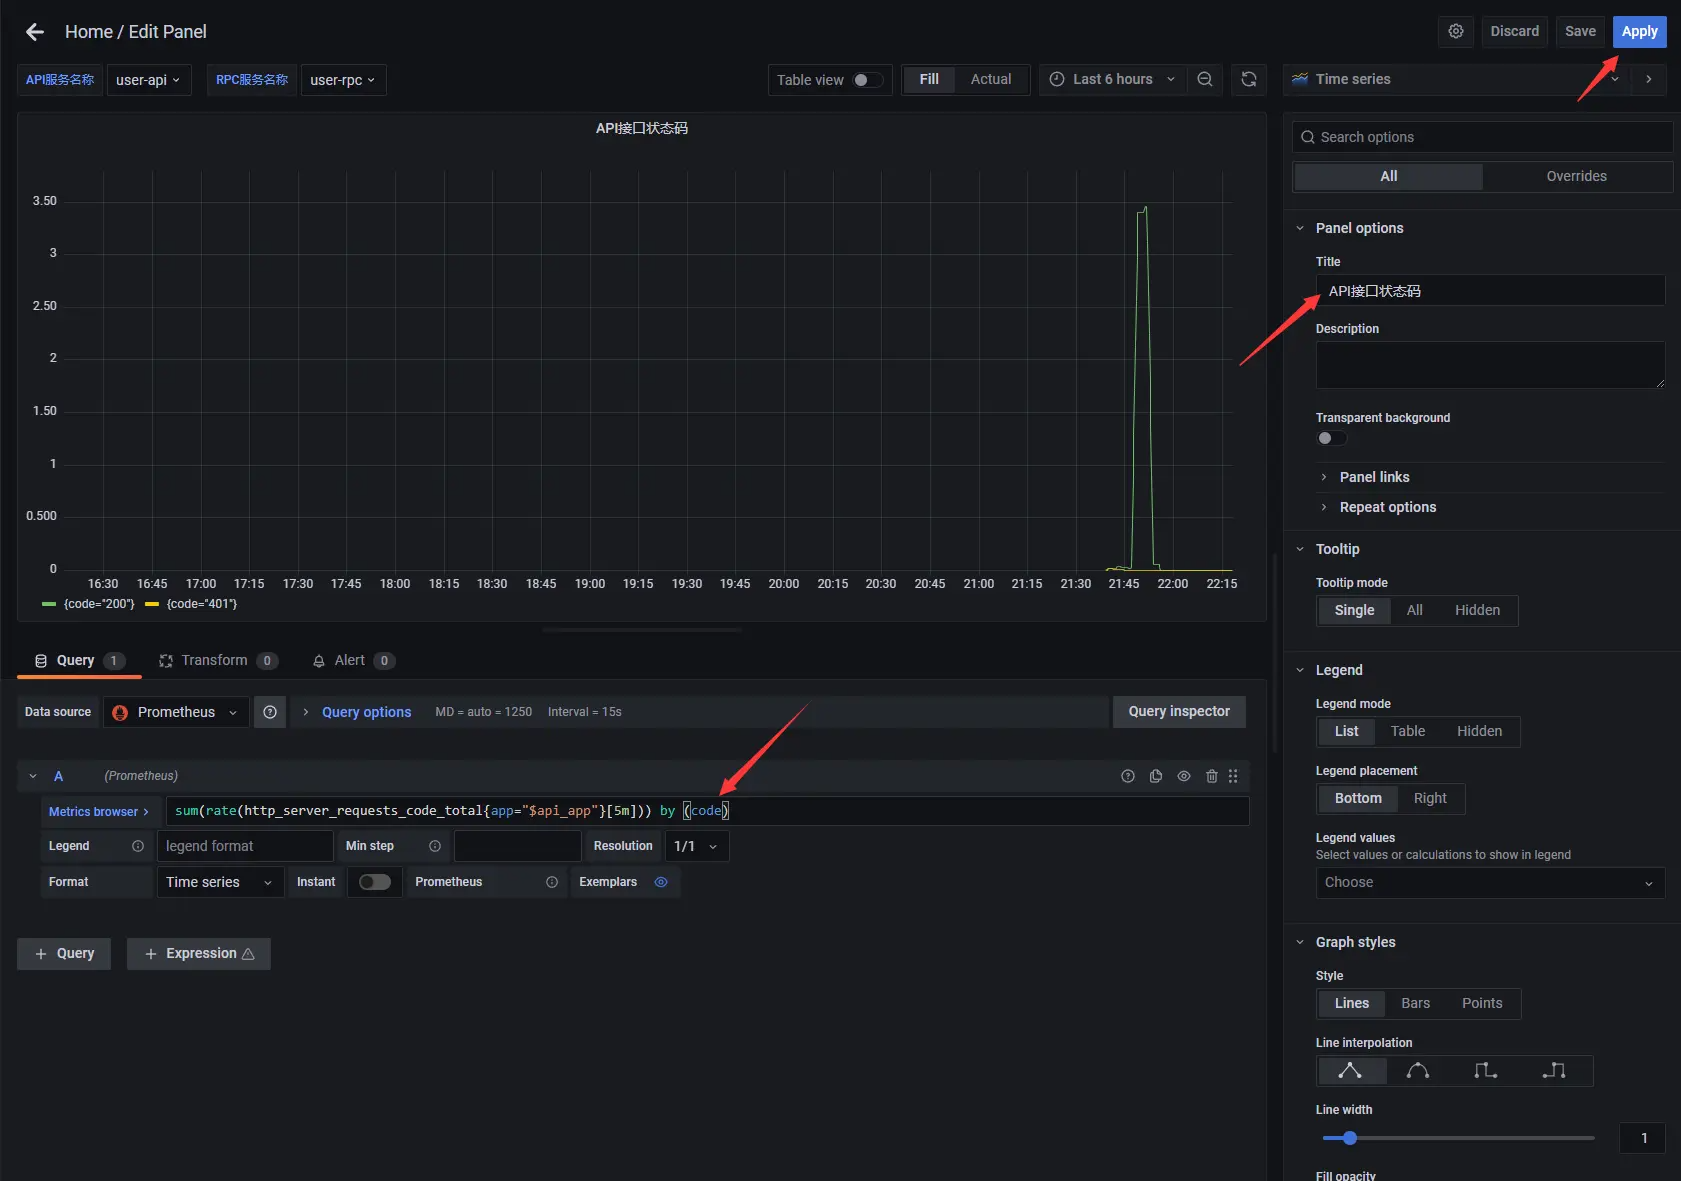
8.3.5 添加 api 介面狀態碼儀錶盤
- 再新建一個面板,修改面板標題為
API介面狀態碼,在Metrics中輸入sum(rate(http_server_requests_code_total{app="$api_app"}[5m])) by (code)以code維度統計api介面的狀態碼
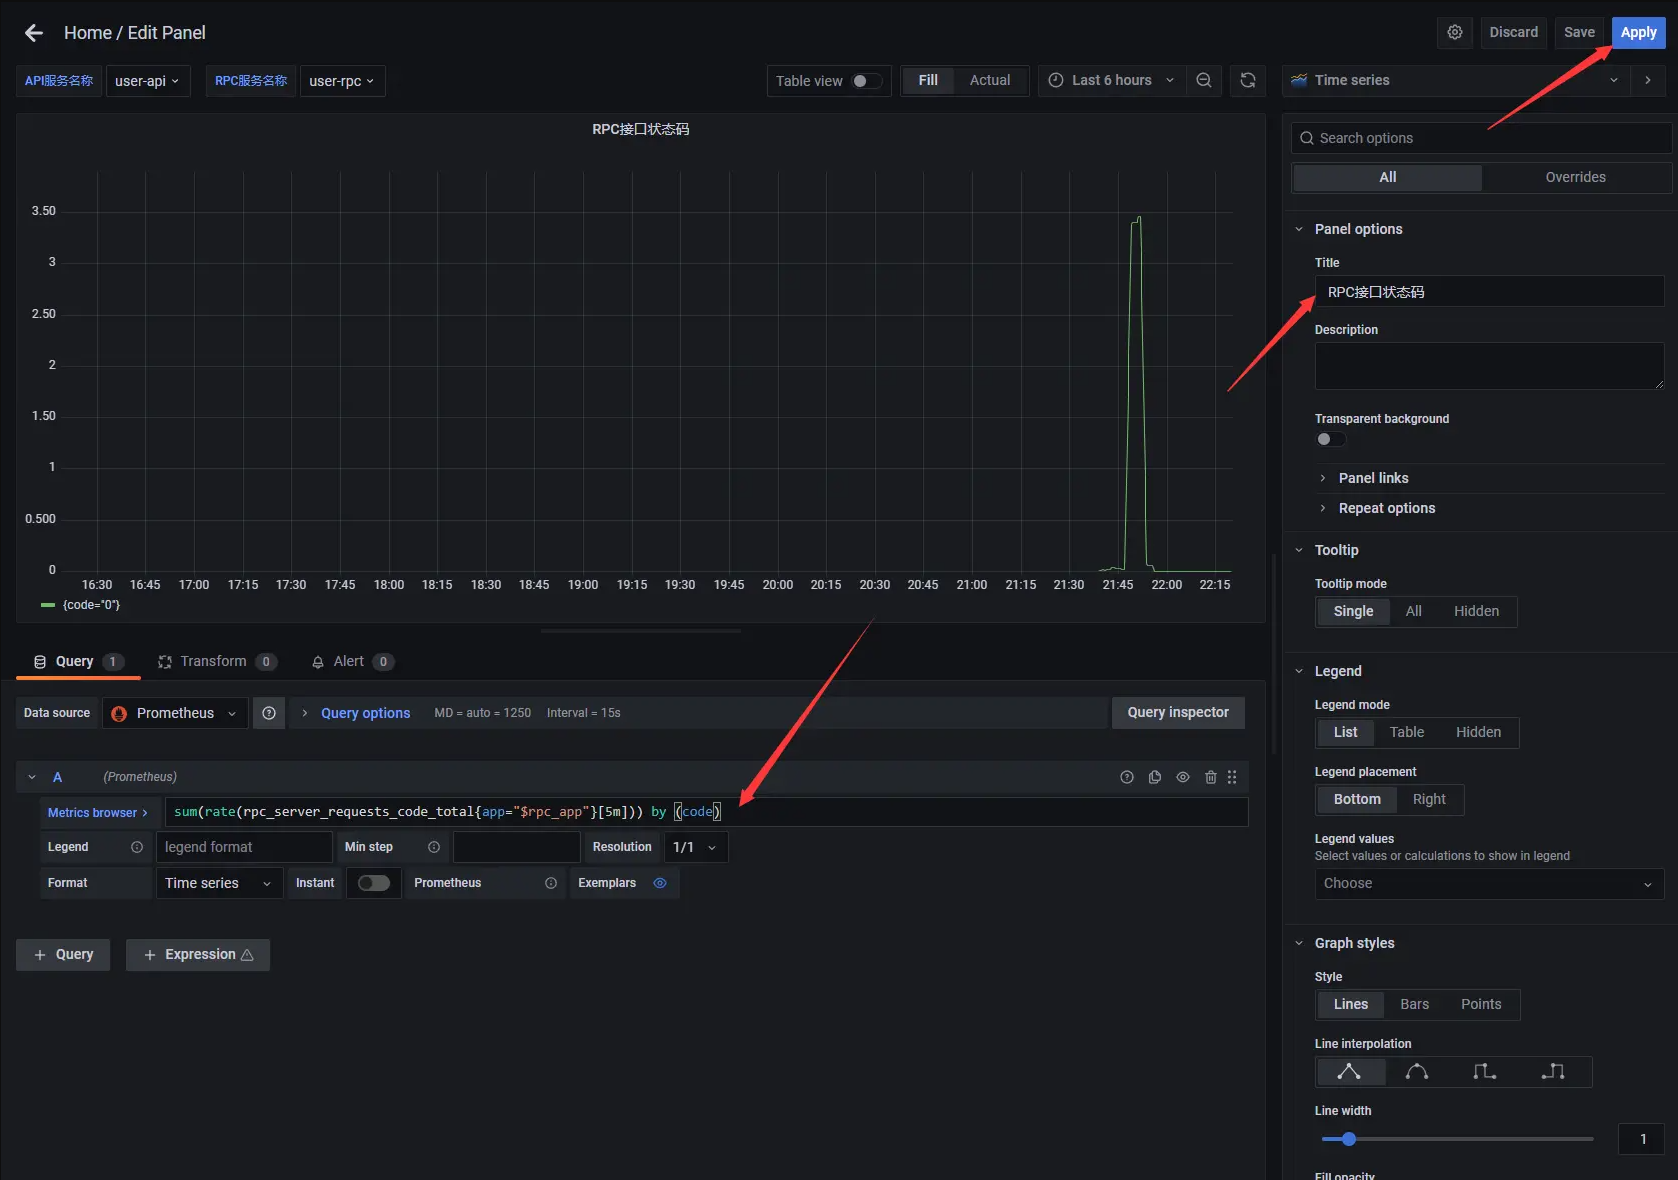
8.3.6 添加 rpc 介面狀態碼儀錶盤
- 再新建一個面板,修改面板標題為
RPC介面狀態碼,在Metrics中輸入sum(rate(rpc_server_requests_code_total{app="$rpc_app"}[5m])) by (code)以code維度統計rpc介面的狀態碼
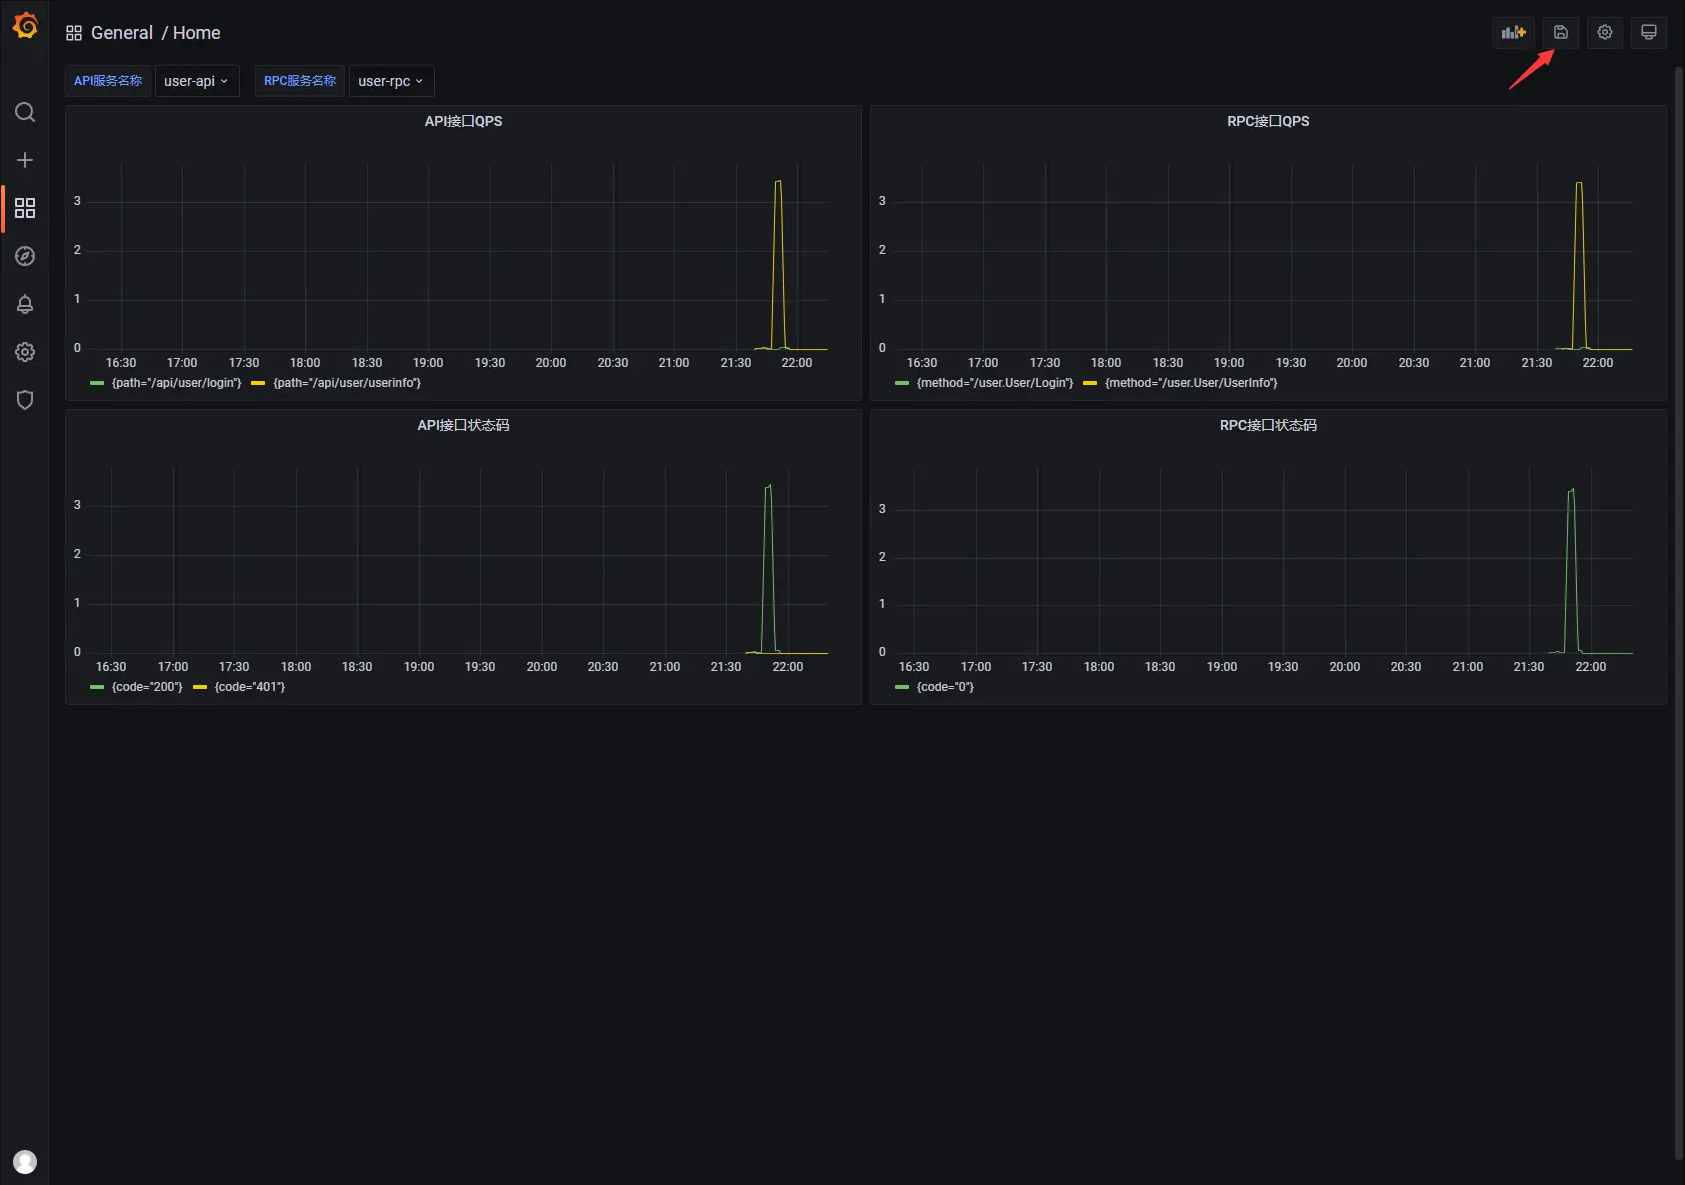
8.3.7 保存儀錶盤
- 調整下面板位置,選擇右上角
Save dashboard按鈕保存儀錶盤。
項目地址
//github.com/zeromicro/go-zero
歡迎使用 go-zero 並 star 支援我們!
微信交流群
關注『微服務實踐』公眾號並點擊 交流群 獲取社區群二維碼。