一類骰子遊戲中的概率計算
一個骰子,一個跑道,停在某個格子上有獎勵。含有這種模式的遊戲不要太多,拿「大富翁」作個圖示:

在玩的時候時常在問自己:
- 我停在前方第n格的概率是多少?
- 我停在前方第n格的期望擲骰子數是多少?
- 感性上說,我停在前方第100格的概率,應該和我停在前方第1000格的概率是一樣的,那麼這個概率是多少?
不妨就來編程解決這些個疑問。
Q1:停在前方第n格的概率是多少?
不妨先考慮簡單的情形:
n = 1,那麼我們至多能擲1次骰子,且僅值為1時滿足條件,那麼概率是 1 / 6 = 0.166667。
n = 2,那麼我們至多能擲2次骰子,點數為 (1, 1) 或 (2) 時滿足條件。所有擲骰子的情況是:{ (1, 1) (1, 2) (1, 3) (1, 4) (1, 5) (1, 6) (2) (3) (4) (5) (6) } 一共11種情況,那麼概率是 2 / 11 = 0.181818。
我們可以總結出這樣的公式:
- 停在前方第n格的概率 = 正好停在第n格的情況數 ÷ 給定最多投擲數的情況下,停留的位置大於等於第n格的情況數 = F(n) / G(n)
Step1:計算F(n)
方法一:動態規劃
顯然,停在n格的情況數 = 停在n-1格的情況數 + 停在n-2格的情況數 + … + 停在n-6格的情況數,所以有:
- 轉移方程:F(n) = F(n-1) + F(n-2) + F(n-3) + F(n-4) + F(n-5) + F(n-6)
- 邊界條件:F(0) = 1,F(n<0) = 0
程式碼如下:
def calF(n):
    F_list = [0 for i in range(n+1)]
    for i in range(n+1):
        for j in range(1,7):
            if i - j == 0: F_list[i] += 1 # 即F(0)=1
            elif i - j < 0: F_list[i] += 0 # 即F(n<0)=0
            else: F_list[i] += F_list[i-j]
    return F_list[-1]
方法二:遞歸演算法
動態規劃與遞歸都有著「分而治之」的思想,在某些情況下是能相互轉換的。遞歸演算法是這麼看這個問題的:於當前位置,重複地執行擲骰子這一動作。若正好停在第n格,則計數器+1,函數返回;若大於第n格,則函數返回;若小於第n格,則繼續擲骰子。
程式碼如下:
def calF_with_RA(n, counter):
    # n:到目標的距離
    # counter:達成條件的情況計數器
    for i in range(1,7):
        if i == n:
            counter += 1
            return counter
        elif i < n:
            counter = calF_with_RA(n-i, counter)
    return counter
Step2:計算G(n)
如果在Step1中採用了遞歸演算法,那麼只要改寫一下函數中計數器的達成條件,和函數退出的位置即可,程式碼如下:
def calG_with_RA(n, counter):
    # n:到目標的距離
    # counter:達成條件的情況計數器
    for i in range(1,7):
        if i >= n:
            counter += 1
        else: counter = calG_with_RA(n-i, counter)
    return counter
Step3:計算並畫圖
於是計算概率的函數有:
def calF_divide_G(n):
    F = calF_with_DP(n)
    G = calG_with_RA(n, 0)
    return F/G
把n=1到20的概率畫出來:


if __name__ == '__main__':
    prob = []
    for i in range(1,21):
        prob.append(calF_divide_G(i))
    n = np.arange(1, 21).astype(dtype=np.str_) # 轉換數據類型 否則plot中會顯示浮點數
    plt.plot(n,prob,linewidth=2,color='r',marker='o', markerfacecolor='blue',markersize=8)
    plt.xlabel('n')
    plt.ylabel('P(n)')
    plt.show()
View Code
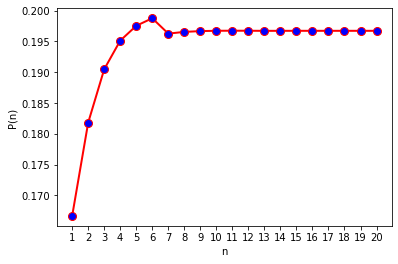
可以看出確實有收斂的趨勢(n取大於25時,程式會變得異常難算,難以展示),收斂到的概率是0.196717(保留6位小數),這也正好回答了Q3。另外,n=6時概率最大,值為0.198758(保留6位小數)。
Q2:停在前方第n格的期望擲骰子數是多少?
一個思路是,記錄所有到達第n格的擲骰子「軌跡」,然後對所有軌跡進行統計。遞歸演算法本身就有列印軌跡的能力,順便再統計點相關的數據自然不在話下,於是改寫遞歸函數:
def throw_dice(n, track, record):
    # n:到目標的距離
    # track:骰子的軌跡
    # record:記錄所有軌跡的長度(即擲骰子次數)
    for i in range(1,7):
        if i == n:
            track.append(i)
            print(track)
            record.append(len(track))
            return record
        elif i < n:
            track_ = track.copy()
            track_.append(i)
            throw_dice(n-i, track_, record)
    return record
遍歷所有擲骰子軌跡,求出擲骰子數的概率分布和期望:
def get_dice_distribution(n):
    record = throw_dice(n, [], [])
    Min = min(record)
    Max = max(record)
    distribution = [0 for i in range(Max - Min + 1)]
    for num in record:
        distribution[num - Min] += 1
    Sum = sum(distribution)
    for i, num in enumerate(distribution): # 求擲骰子數的概率分布
        distribution[i] = num / Sum

    expectation = 0 # 求期望擲骰子數
    for i in range(Max - Min +1):
        expectation += (Min + i) * distribution[i]
    print(expectation)

    return Min, Max, distribution, expectation
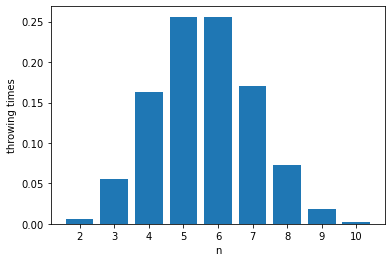
畫出擲骰子數的概率分布(以n=10為例):
def plotDistribution(n):
    Min, Max, distribution, expectation = get_dice_distribution(n)
    N = np.arange(Min, Max+1).astype(dtype=np.str_)
    plt.bar(N, distribution)
    plt.xlabel('n')
    plt.ylabel('throwing times')
    plt.show()
View Code
畫出n=1到20的期望擲骰子數:
def plotExpectation():
    expectation_list = []
    for i in range(1,21):
        Min, Max, distribution, expectation = get_dice_distribution(i)
        expectation_list.append(expectation)
    n = np.arange(1, 21).astype(dtype=np.str_)
    plt.plot(n, expectation_list, linewidth=2, color='r', marker='o', markerfacecolor='blue', markersize=8)
    plt.xlabel('n')
    plt.ylabel('E(n)')
    plt.show()
    return expectation_list
View Code
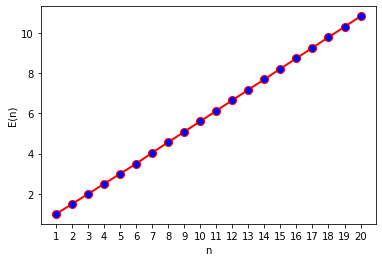
可以看出,大致上是一個線性的關係,列印出具體的數據:
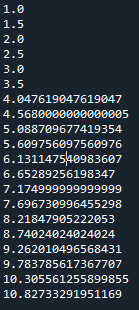
可以看出,當n小於等於6時,是線性的;大於6時,大致上是線性的。
整體程式碼:
import numpy as np
from matplotlib import pyplot as plt


def calF_with_DP(n):
    F_list = [0 for i in range(n+1)]
    for i in range(n+1):
        for j in range(1,7):
            if i - j == 0: F_list[i] += 1 # 即F(0)=1
            elif i - j < 0: F_list[i] += 0 # 即F(n<0)=0
            else: F_list[i] += F_list[i-j]
    return F_list[-1]


def calF_with_RA(n, counter):
    # n:到目標的距離
    # counter:達成條件的情況計數器
    for i in range(1,7):
        if i == n:
            counter += 1
            return counter
        elif i < n:
            counter = calF_with_RA(n-i, counter)
    return counter


def calG_with_RA(n, counter):
    # n:到目標的距離
    # counter:達成條件的情況計數器
    for i in range(1,7):
        if i >= n:
            counter += 1
        else: counter = calG_with_RA(n-i, counter)
    return counter


def calF_divide_G(n):
    F = calF_with_RA(n, 0)
    G = calG_with_RA(n, 0)
    return F/G


def plotPn():
    prob = []
    for i in range(1,21):
        prob.append(calF_divide_G(i))
    n = np.arange(1, 21).astype(dtype=np.str_) # 轉換數據類型 否則plot中會顯示浮點數
    plt.plot(n, prob, linewidth=2, color='r', marker='o', markerfacecolor='blue', markersize=8)
    plt.xlabel('n')
    plt.ylabel('P(n)')
    plt.show()


def throw_dice(n, track, record):
    # n:到目標的距離
    # track:骰子的軌跡
    # record:記錄所有軌跡的長度(即擲骰子次數)
    for i in range(1,7):
        if i == n:
            track.append(i)
            record.append(len(track))
            return record
        elif i < n:
            track_ = track.copy()
            track_.append(i)
            throw_dice(n-i, track_, record)
    return record


def get_dice_distribution(n):
    record = throw_dice(n, [], [])
    Min = min(record)
    Max = max(record)
    distribution = [0 for i in range(Max - Min + 1)]
    for num in record:
        distribution[num - Min] += 1
    Sum = sum(distribution)
    for i, num in enumerate(distribution): # 求擲骰子數的概率分布
        distribution[i] = num / Sum

    expectation = 0 # 求期望擲骰子數
    for i in range(Max - Min +1):
        expectation += (Min + i) * distribution[i]
    print(expectation)

    return Min, Max, distribution, expectation


def plotDistribution(n):
    Min, Max, distribution, expectation = get_dice_distribution(n)
    N = np.arange(Min, Max+1).astype(dtype=np.str_)
    plt.bar(N, distribution)
    plt.xlabel('n')
    plt.ylabel('throwing times')
    plt.show()


def plotExpectation():
    expectation_list = []
    for i in range(1,21):
        Min, Max, distribution, expectation = get_dice_distribution(i)
        expectation_list.append(expectation)
    n = np.arange(1, 21).astype(dtype=np.str_)
    plt.plot(n, expectation_list, linewidth=2, color='r', marker='o', markerfacecolor='blue', markersize=8)
    plt.xlabel('n')
    plt.ylabel('E(n)')
    plt.show()
    return expectation_list

if __name__ == '__main__':
    # plotPn()
    # plotDistribution(10)
    expectation_list = plotExpectation()
View Code
小結
使用動態規劃和遞歸演算法解決了問題(實際上可以完全依靠遞歸)。遞歸函數由於具有列印軌跡的能力,攜帶資訊多,可拓展性強,稍微改寫就能滿足需要。


