flask+layui+echarts實現前端動態圖展示數據
- 2019 年 10 月 3 日
- 筆記
效果圖:
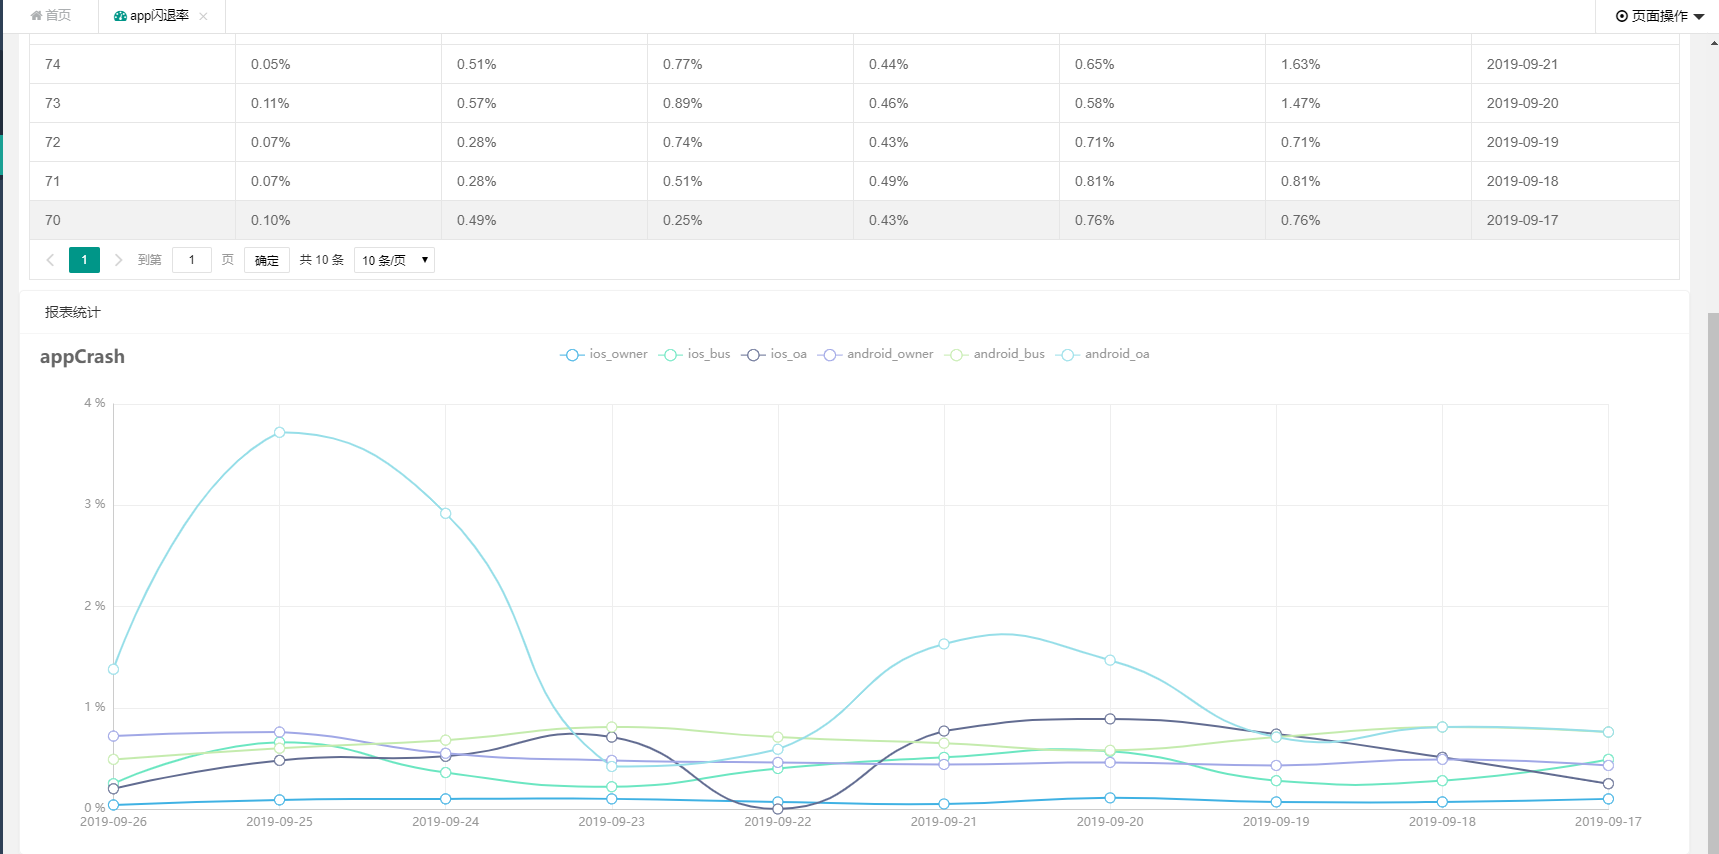
該效果主要實現一個table展示數據,並在下方生成一個折線圖。
實現方式:
1、首先需要對表格進行一個數據載入,這裡用到了layui的table.render,具體用法可以參考
https://www.layui.com/doc/modules/table.html
html部分:
1 <table class="layui-hide" id="reportTableId" lay-filter="currentTableFilter"></table>
js部分:
1 <script> 2 layui.use(['form', 'table', 'echarts'], function () { 3 var $ = layui.jquery, 4 form = layui.form, 5 table = layui.table; 6 echarts = layui.echarts; 7 8 //table.render()方法返回一個對象:var tableIns = table.render(options),可用於對當前表格進行“重載”等操作 9 tableIns = table.render({ 10 elem: '#reportTableId', 11 url: '/api/dataFactory/onlineReport/searchAppCrash', 12 method: 'post', 13 toolbar: '#toolbarDemo', 14 defaultToolbar: ['filter', 'exports', 'print', { //自定義頭部工具欄右側圖標。如無需自定義,去除該參數即可 15 title: '提示' 16 , layEvent: 'LAYTABLE_TIPS' 17 , icon: 'layui-icon-tips' 18 }], 19 request: { 20 pageName: 'page' //頁碼的參數名稱,默認:page 21 , limitName: 'limit', //每頁數據量的參數名,默認:limit 22 }, 23 cols: [[ 24 {field: 'id', Width: 80, title: 'ID', sort: true}, 25 { 26 field: 'ios_owner', minWidth: 120, title: '業主-ios', sort: true, templet: function (d) { 27 return d.ios_owner + '%' 28 } 29 }, 30 { 31 field: 'ios_bus', minWidth: 120, title: '商家-ios', sort: true, templet: function (d) { 32 return d.ios_bus + '%' 33 } 34 }, 35 { 36 field: 'ios_oa', minWidth: 100, title: 'OA-ios', templet: function (d) { 37 return d.ios_oa + '%' 38 } 39 }, 40 { 41 field: 'android_owner', minWidth: 100, title: '業主-android', templet: function (d) { 42 return d.android_owner + '%' 43 } 44 }, 45 { 46 field: 'android_bus', minWidth: 100, title: '商家-android', templet: function (d) { 47 return d.android_bus + '%' 48 } 49 }, 50 { 51 field: 'android_oa', minWidth: 130, title: 'OA-android', templet: function (d) { 52 return d.android_oa + '%' 53 } 54 }, 55 {field: 'crash_day', minWidth: 110, title: '統計時間', sort: true}, 56 ]], 57 limits: [10, 15, 20, 25, 50, 100], 58 limit: 10, 59 page: true, 60 }); 61 62 // 監聽搜索操作 63 form.on('submit(data-search-btn)', function (data) { 64 var form_result = JSON.stringify(data.field); 65 //執行搜索重載 66 table.reload('reportTableId', { 67 page: { 68 curr: 1 69 } 70 , where: { 71 searchParams: form_result 72 } 73 }, 'data'); 74 return false; 75 76 }); 77 </script>
此時已經基本實現了表格從後台抓取數據實現動態渲染表格。接下來需要實現的是,將表格裡面的數據渲染成折線圖
2、首先html中寫一個放折線圖的div,具體的html程式碼如下:
1 <div class="layui-card"> 2 <div class="layui-card-header"><i class="fa fa-line-chart icon"></i>報表統計</div> 3 <div class="layui-card-body"> 4 <div id="echarts-records" style="width: 100%;min-height:500px"></div> 5 </div> 6 </div>
3、然後在表格渲染完成後,渲染一個折線圖出來,這個時候需要在table.render()後添加一個回調函數 done: function ,具體用法如下:
1 table.render({ //其它參數在此省略 2 done: function(res, curr, count){ 3 //如果是非同步請求數據方式,res即為你介面返回的資訊。 4 //如果是直接賦值的方式,res即為:{data: [], count: 99} data為當前頁數據、count為數據總長度 5 console.log(res); 6 7 //得到當前頁碼 8 console.log(curr); 9 10 //得到數據總量 11 console.log(count); 12 } 13 });
4、然後我們需要將done: function添加到我們已經寫到的table.render()中去。

5、此時的resu就是你渲染表格時,拿到的後台返回的數據,但是這個地方需要注意的是,因為表格渲染數據的格式和折線圖渲染數據的格式,是不一樣的,所以後台需要返回兩種格式的數據,以便於一種用於table展示,一種用於折線圖展示。

上圖中就是在查詢介面的最後添加一個操作把數據在轉換一份用於折線圖展示,並且動態生成橫坐標Xtitle
6、此時後台的數據已經準備完畢,需要在前端渲染折線圖,具體的echarts的用法,請參考https://www.echartsjs.com/examples/zh/index.html ,此處只是描述如何應用折線圖。
此處我用的方法是先行在介面上渲染一個橫坐標和縱坐標出來,然後在渲染數據進去。程式碼如下:
1 /** 2 * 報表功能 3 */ 4 var echartsRecords = echarts.init(document.getElementById('echarts-records'), 'walden'); 5 // 顯示標題,圖例和空的坐標軸 6 echartsRecords.setOption({ 7 title: { 8 text: 'appCrash' 9 }, 10 tooltip: { 11 trigger: 'axis' 12 }, 13 legend: { 14 data: ['ios_owner', 'ios_bus', 'ios_oa', 'android_owner', 'android_bus', 'android_oa'] 15 }, 16 grid: { 17 left: '3%', 18 right: '4%', 19 bottom: '3%', 20 containLabel: true 21 }, 22 toolbox: { 23 feature: { 24 saveAsImage: {} 25 } 26 }, 27 xAxis: { 28 type: 'category', 29 boundaryGap: false, 30 data: [] 31 }, 32 yAxis: [ 33 { 34 //設置類別 35 type: 'value', 36 //y軸刻度 37 axisLabel: { 38 //設置y軸數值為% 39 formatter: '{value} %', 40 }, 41 } 42 ], 43 });
此處因為我需要的縱坐標是百分比類型的,所以添加了百分號,不需要的可以去掉。此時沒有數據的坐標已經渲染好了,然後就是渲染數據
7、渲染數據。
前面在done: function函數中我們得到三個返回值,其中第一個返回值resu就是介面的返回值,我們需要拿到其中的渲染數據進行渲染,程式碼如下:
1 //渲染折線圖 2 echartsRecords.setOption({ 3 xAxis: { 4 data: resu.Xtitle 5 }, 6 series: resu.appCrashZhexiantu 7 });
Xtitle代表的是折線圖的橫坐標,appCrashZhexiantu代表的是具體的數據。數據格式為:
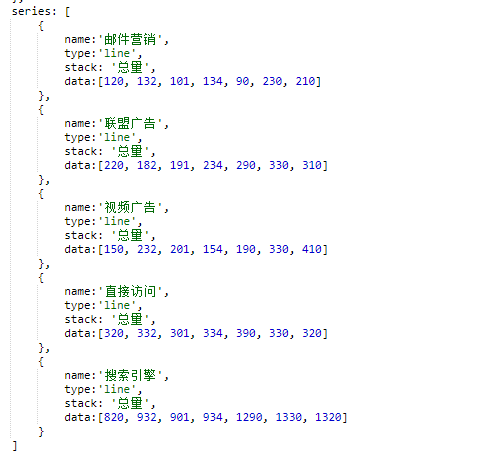
OK,此時所有功能已經完成,介面上已經可以完美的展示出折線圖。
綜上的所有js:
1 <script> 2 3 layui.use(['form', 'table', 'echarts'], function () { 4 var $ = layui.jquery, 5 form = layui.form, 6 table = layui.table; 7 echarts = layui.echarts; 8 9 //table.render()方法返回一個對象:var tableIns = table.render(options),可用於對當前表格進行“重載”等操作 10 tableIns = table.render({ 11 elem: '#reportTableId', 12 url: '/api/dataFactory/onlineReport/searchAppCrash', 13 method: 'post', 14 toolbar: '#toolbarDemo', 15 defaultToolbar: ['filter', 'exports', 'print', { //自定義頭部工具欄右側圖標。如無需自定義,去除該參數即可 16 title: '提示' 17 , layEvent: 'LAYTABLE_TIPS' 18 , icon: 'layui-icon-tips' 19 }], 20 request: { 21 pageName: 'page' //頁碼的參數名稱,默認:page 22 , limitName: 'limit', //每頁數據量的參數名,默認:limit 23 }, 24 cols: [[ 25 {field: 'id', Width: 80, title: 'ID', sort: true}, 26 { 27 field: 'ios_owner', minWidth: 120, title: '業主-ios', sort: true, templet: function (d) { 28 return d.ios_owner + '%' 29 } 30 }, 31 { 32 field: 'ios_bus', minWidth: 120, title: '商家-ios', sort: true, templet: function (d) { 33 return d.ios_bus + '%' 34 } 35 }, 36 { 37 field: 'ios_oa', minWidth: 100, title: 'OA-ios', templet: function (d) { 38 return d.ios_oa + '%' 39 } 40 }, 41 { 42 field: 'android_owner', minWidth: 100, title: '業主-android', templet: function (d) { 43 return d.android_owner + '%' 44 } 45 }, 46 { 47 field: 'android_bus', minWidth: 100, title: '商家-android', templet: function (d) { 48 return d.android_bus + '%' 49 } 50 }, 51 { 52 field: 'android_oa', minWidth: 130, title: 'OA-android', templet: function (d) { 53 return d.android_oa + '%' 54 } 55 }, 56 {field: 'crash_day', minWidth: 110, title: '統計時間', sort: true}, 57 ]], 58 limits: [10, 15, 20, 25, 50, 100], 59 limit: 10, 60 page: true, 61 done: function (resu, curr, count) { 62 //回調渲染折線圖 63 /** 64 * 報表功能 65 */ 66 var echartsRecords = echarts.init(document.getElementById('echarts-records'), 'walden'); 67 // 顯示標題,圖例和空的坐標軸 68 echartsRecords.setOption({ 69 title: { 70 text: 'appCrash' 71 }, 72 tooltip: { 73 trigger: 'axis' 74 }, 75 legend: { 76 data: ['ios_owner', 'ios_bus', 'ios_oa', 'android_owner', 'android_bus', 'android_oa'] 77 }, 78 grid: { 79 left: '3%', 80 right: '4%', 81 bottom: '3%', 82 containLabel: true 83 }, 84 toolbox: { 85 feature: { 86 saveAsImage: {} 87 } 88 }, 89 xAxis: { 90 type: 'category', 91 boundaryGap: false, 92 data: [] 93 }, 94 yAxis: [ 95 { 96 //設置類別 97 type: 'value', 98 //y軸刻度 99 axisLabel: { 100 //設置y軸數值為% 101 formatter: '{value} %', 102 }, 103 } 104 ], 105 }); 106 //渲染折線圖 107 echartsRecords.setOption({ 108 xAxis: { 109 data: resu.Xtitle 110 }, 111 series: resu.appCrashZhexiantu 112 }); 113 } 114 }); 115 116 117 // 監聽搜索操作 118 form.on('submit(data-search-btn)', function (data) { 119 var form_result = JSON.stringify(data.field); 120 //執行搜索重載 121 table.reload('reportTableId', { 122 page: { 123 curr: 1 124 } 125 , where: { 126 searchParams: form_result 127 } 128 }, 'data'); 129 return false; 130 131 }); 132 }); 133 </script>
註:轉載請註明出處。謝謝合作~
