SpringCloud學習筆記(5):Hystrix Dashboard可視化監控數據
- 2019 年 10 月 3 日
- 筆記
簡介
上篇文章中講了使用Hystrix實現容錯,除此之外,Hystrix還提供了近乎實時的監控。本文將介紹如何進行服務監控以及使用Hystrix Dashboard來讓監控數據圖形化。
項目介紹
- sc-parent,父模組(請參照SpringCloud學習筆記(1):Eureka註冊中心)
- sc-eureka,註冊中心(請參照SpringCloud學習筆記(1):Eureka註冊中心)
- sc-consumer-hystrix-ribbon,使用Hystrix+Ribbon的消費者(請參照SpringCloud學習筆記(4):Hystrix容錯機制)
- sc-consumer-hystrix-feign,使用Hystrix+Feign的消費者(請參照SpringCloud學習筆記(4):Hystrix容錯機制)
- sc-hystrix-dashboard,用於可視化監控數據
- sc-turbine,用於聚合監控數據
開啟消費者服務監控
1.修改消費者sc-consumer-hystrix-ribbon和sc-consumer-hystrix-feign的pom.xml,新增如下依賴:
<dependency> <groupId>org.springframework.boot</groupId> <artifactId>spring-boot-starter-actuator</artifactId> </dependency>2.修改消費者sc-consumer-hystrix-ribbon和sc-consumer-hystrix-feign的application.yml,新增如下配置:
management: endpoints: web: exposure: include: 'hystrix.stream' #暴露hystrix.stream端點3.測試訪問消費者sc-consumer-hystrix-feign的監控數據
依次啟動註冊中心sc-eureka和消費者sc-consumer-hystrix-feign,並訪問http://localhost:8084/actuator/hystrix.stream,結果顯示如下:
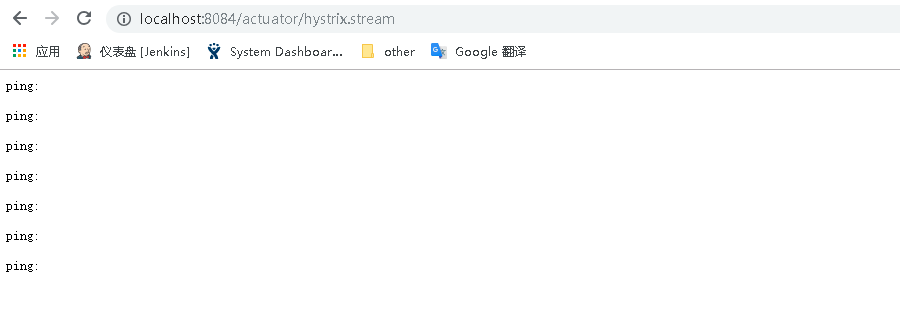
出現上圖是因為消費者服務沒有被訪問,所以這裡先調用下消費者服務:http://localhost:8084/feign/getBookList,然後再訪問http://localhost:8084/actuator/hystrix.stream:
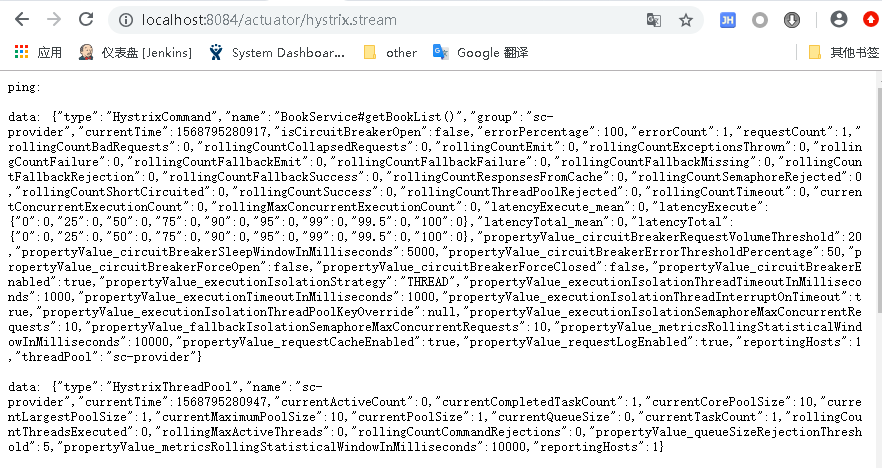
可以看到監控數據是以文字的形式展示的,並不直觀,下面將介紹使用Hystrix Dashboard可視化監控數據。
使用Hystrix Dashboard可視化監控數據
1.在父模組下創建子模組項目sc-hystrix-dashboard,pom.xml:
<project xmlns="http://maven.apache.org/POM/4.0.0" xmlns:xsi="http://www.w3.org/2001/XMLSchema-instance" xsi:schemaLocation="http://maven.apache.org/POM/4.0.0 http://maven.apache.org/xsd/maven-4.0.0.xsd"> <modelVersion>4.0.0</modelVersion> <parent> <groupId>com.cf</groupId> <artifactId>sc-parent</artifactId> <version>0.0.1-SNAPSHOT</version> </parent> <artifactId>sc-hystrix-dashboard</artifactId> <dependencies> <dependency> <groupId>org.springframework.cloud</groupId> <artifactId>spring-cloud-starter-netflix-hystrix-dashboard</artifactId> </dependency> </dependencies> </project>2.創建啟動類dashboard.DashBoardApplication:
package dashboard; import org.springframework.boot.SpringApplication; import org.springframework.boot.autoconfigure.SpringBootApplication; import org.springframework.cloud.netflix.hystrix.dashboard.EnableHystrixDashboard; @SpringBootApplication @EnableHystrixDashboard public class DashBoardApplication { public static void main(String[] args) { SpringApplication.run(DashBoardApplication.class, args); } }3.創建application.yml:
server: port: 8086 spring: application: name: sc-hystrix-dashboard4.測試
啟動sc-hystrix-dashboard後,訪問http://localhost:8086/hystrix將會顯示Hystrix Dashboard的主介面:
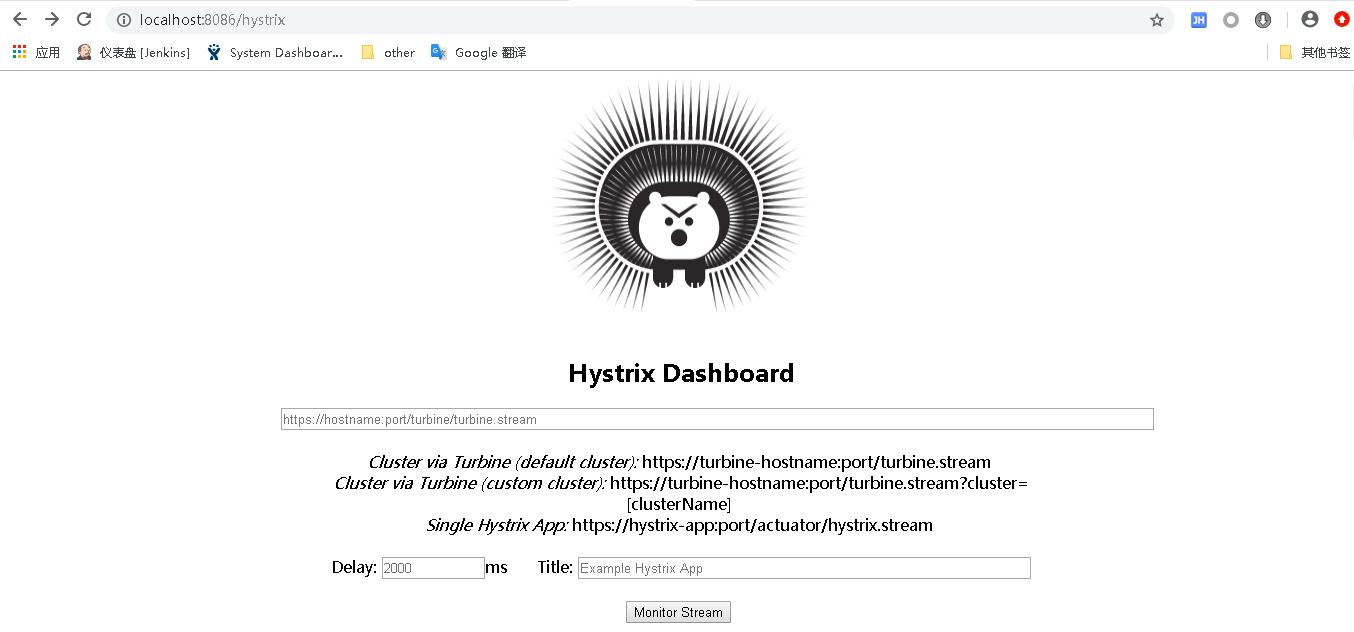
然後需要將消費者sc-consumer-hystrix-feign的監控數據添加到Hystrix Dashboard中。依次啟動註冊中心sc-eureka和消費者sc-consumer-hystrix-feign,將監控數據的地址輸入到Hystrix Dashboard主介面的文本框中,點擊Monitor Stream,然後重複訪問消費者服務http://localhost:8084/feign/getBookList,Hystrix Dashboard顯示如下:
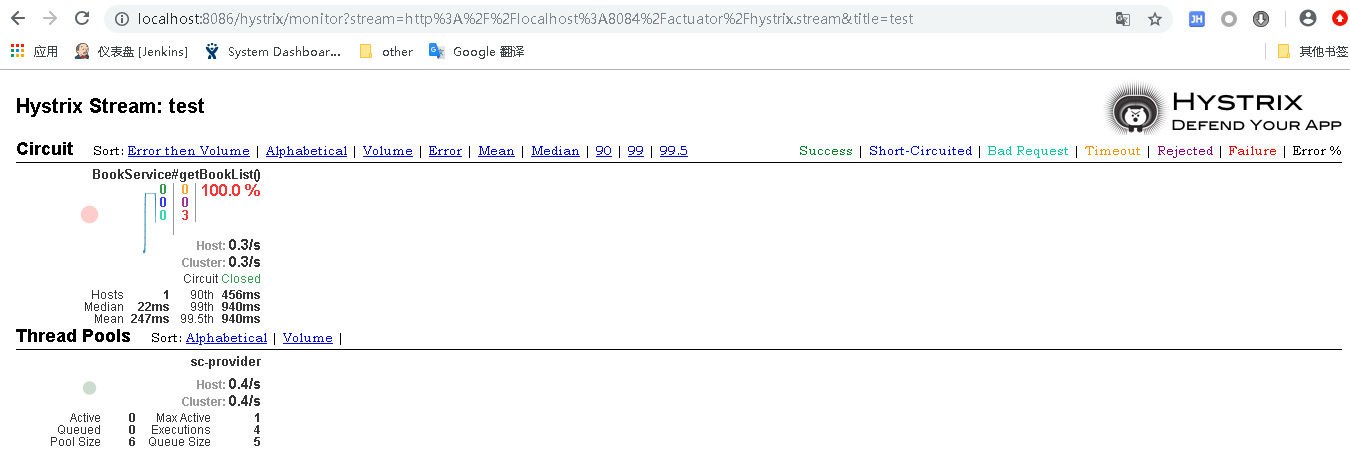
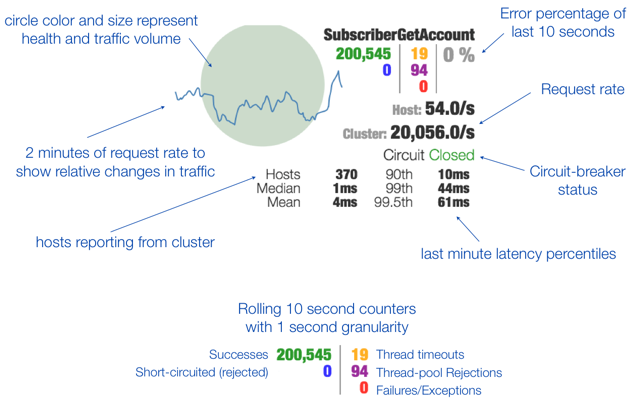
關於介面上指標表示的內容可以參考下圖:
使用Turbine聚合監控數據
/hystrix.stream端點只能監控到單個服務實例,如果需要查看其他服務實例監控資訊則需要在Hystrix Dashboard切換想要監控的地址。通過Turbine可以將所有/hystrix.stream端點的數據聚合到一個組合的/turbine.stream中,然後在Hystrix Dashboard中就可以查看所有服務的監控資訊。
1.修改消費者sc-consumer-hystrix-ribbon和sc-consumer-hystrix-feign的application.yml,將registerWithEureka設為true或者直接去掉該配置(默認為true)。因為Turbine需要從Eureka上獲取服務的地址資訊,然後才能獲取到服務的監控數據,所以消費者服務需要到Eureka註冊中心註冊。
eureka: client: #registerWithEureka: false serviceUrl: defaultZone: http://localhost:8080/eureka/ 2.在父模組下創建子模組項目sc-turbine,pom.xml:
<project xmlns="http://maven.apache.org/POM/4.0.0" xmlns:xsi="http://www.w3.org/2001/XMLSchema-instance" xsi:schemaLocation="http://maven.apache.org/POM/4.0.0 http://maven.apache.org/xsd/maven-4.0.0.xsd"> <modelVersion>4.0.0</modelVersion> <parent> <groupId>com.cf</groupId> <artifactId>sc-parent</artifactId> <version>0.0.1-SNAPSHOT</version> </parent> <artifactId>sc-turbine</artifactId> <dependencies> <dependency> <groupId>org.springframework.cloud</groupId> <artifactId>spring-cloud-starter-netflix-turbine</artifactId> </dependency> </dependencies> </project>3.創建啟動類turbine.TurbineApplication:
package turbine; import org.springframework.boot.SpringApplication; import org.springframework.boot.autoconfigure.SpringBootApplication; import org.springframework.cloud.netflix.turbine.EnableTurbine; @SpringBootApplication @EnableTurbine public class TurbineApplication { public static void main(String[] args) { SpringApplication.run(TurbineApplication.class, args); } }4.創建application.yml:
server: port: 8087 spring: application: name: sc-turbine eureka: client: registerWithEureka: false serviceUrl: defaultZone: http://localhost:8080/eureka/ turbine: appConfig: sc-consumer-hystrix-ribbon,sc-consumer-hystrix-feign #指定要監控的服務名 clusterNameExpression: "'default'"5.測試
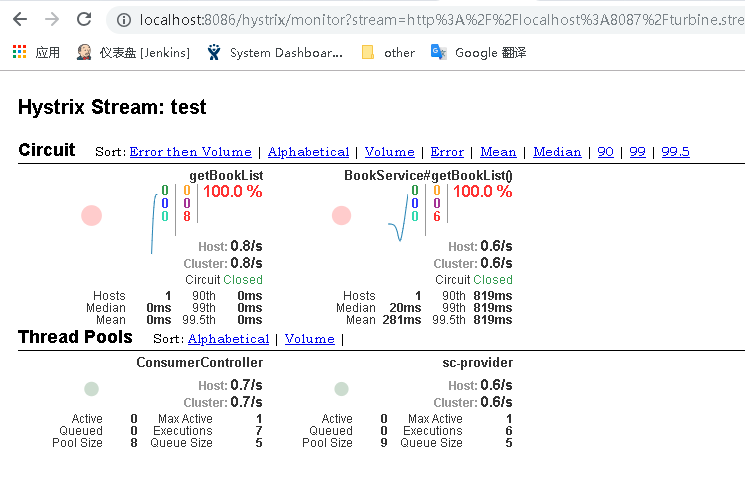
依次啟動註冊中心sc-eureka、消費者sc-consumer-hystrix-feign、消費者sc-consumer-hystrix-ribbon、sc-turbine、sc-hystrix-dashboard,訪問http://localhost:8086/hystrix進入到Hystrix Dashboard主介面中,然後在Hystrix Dashboard主介面的文本框中輸入http://localhost:8087/turbine.stream,點擊Monitor Stream進入監控介面,重複訪問兩個消費者服務,監控介面上將顯示兩個消費者的監控資訊: