Sentry(v20.12.1) K8S 雲原生架構探索,1分鐘上手 JavaScript 性能監控
- 2021 年 1 月 21 日
- 筆記
系列
- Sentry-Go SDK 中文實踐指南
- 一起來刷 Sentry For Go 官方文檔之 Enriching Events
- Snuba:Sentry 新的搜索基礎設施(基於 ClickHouse 之上)
- Sentry 10 K8S 雲原生架構探索,Vue App 1 分鐘快速接入
- Sentry(v20.12.1) K8S雲原生架構探索,玩轉前/後端監控與事件日誌大數據分析,高性能高可用+可擴展可伸縮集群部署
- Sentry(v20.12.1) K8S 雲原生架構探索,Sentry JavaScript SDK 三種安裝載入方式
- Sentry(v20.12.1) K8S 雲原生架構探索,SENTRY FOR JAVASCRIPT SDK 配置詳解
- Sentry(v20.12.1) K8S 雲原生架構探索, SENTRY FOR JAVASCRIPT 手動捕獲事件基本用法
- Sentry(v20.12.1) K8S 雲原生架構探索,SENTRY FOR JAVASCRIPT Source Maps 詳解
- Sentry(v20.12.1) K8S 雲原生架構探索,SENTRY FOR JAVASCRIPT 故障排除
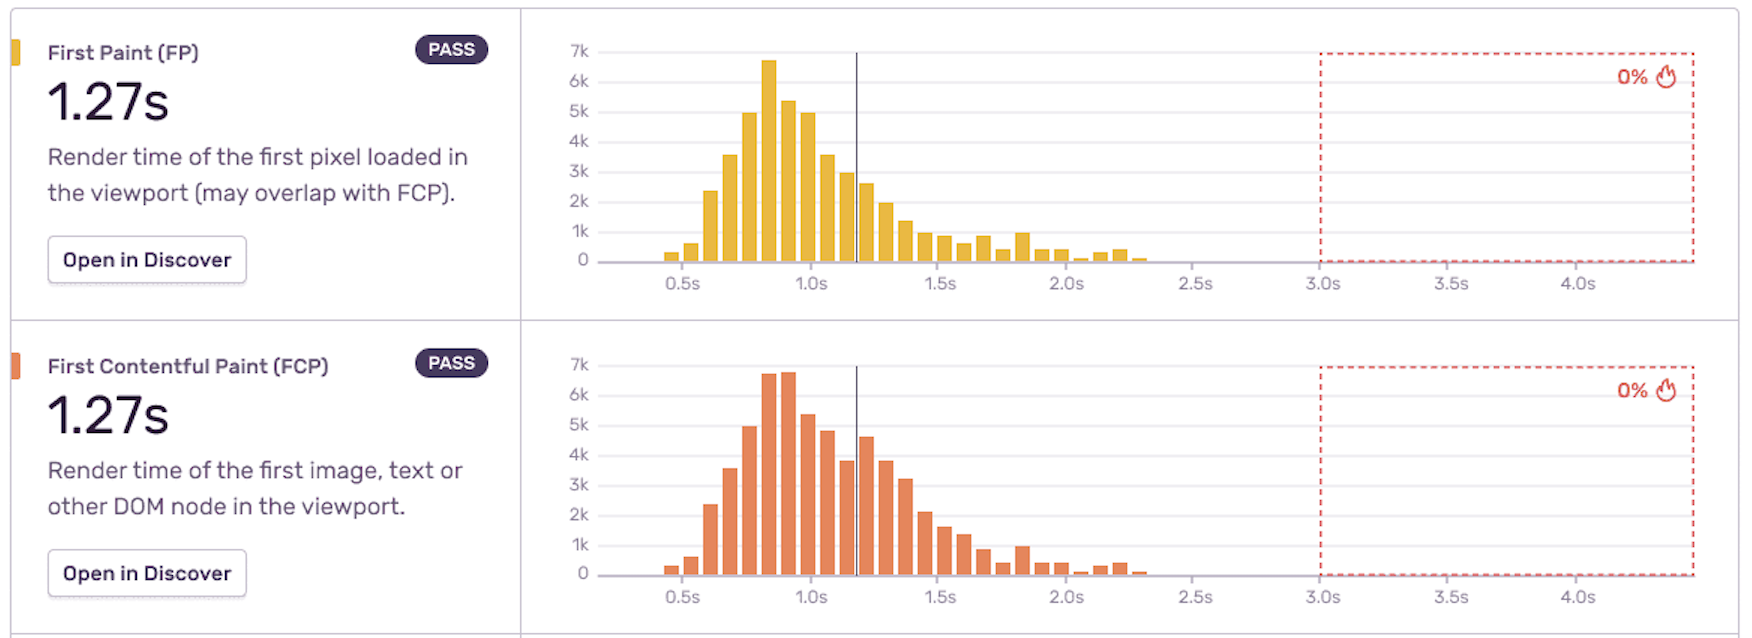
通過性能監視,Sentry 可以跟蹤您的軟體性能,測量吞吐量和延遲等指標,並顯示多個系統之間的錯誤影響。
安裝
安裝跟蹤軟體包:
ESM
# Using yarn
yarn add @sentry/tracing

# Using npm
npm install @sentry/tracing
CDN
<script
  <!--
    Note that `bundle.tracing.min.js` contains both `@sentry/browser` AND
    `@sentry/tracing`, and should therefore be used in place of
    `@sentry/browser`'s bundle rather than in addition to it.
  -->
  src="//browser.sentry-cdn.com/5.29.2/bundle.tracing.min.js"
  integrity="sha384-4zxA5Bnxor/VkZae20EqPP3A/6vDlw1ZhqF7EvpmeTfWYFjPIDdaUSOk/q7G/bYw"
  crossorigin="anonymous"
></script>
配置
通過以下兩種方式在您的應用中啟用性能監控:
- 使用 SDK 配置中的
tracesSampleRate選項將所有transactions的統一取樣率設置為0到1之間的數字。(例如,要發送20%的transactions,請將tracesSampleRate設置為0.2。) - 通過為
tracesSampler配置選項提供功能,基於 transaction 本身及其捕獲的上下文動態控制取樣率。
ESM
// If you're using one of our integration packages, like `@sentry/react` or
// `@sentry/angular`, substitute its name for `@sentry/browser` here
import * as Sentry from "@sentry/browser";

// If taking advantage of automatic instrumentation (highly recommended)
import { Integrations as TracingIntegrations } from "@sentry/tracing";
// Or, if only manually tracing
// import * as _ from "@sentry/tracing"
// Note: You MUST import the package in some way for tracing to work

Sentry.init({
  dsn: "//[email protected]/0",

  // This enables automatic instrumentation (highly recommended), but is not
  // necessary for purely manual usage
  integrations: [new TracingIntegrations.BrowserTracing()],

  // To set a uniform sample rate
  tracesSampleRate: 0.2

  // Alternatively, to control sampling dynamically
  tracesSampler: samplingContext => { ... }
});
CDN
Sentry.init({
  dsn: "//[email protected]/0",

  // This enables automatic instrumentation (highly recommended), but is not
  // necessary for purely manual usage
  integrations: [new Sentry.Integrations.BrowserTracing()],

  // To set a uniform sample rate
  tracesSampleRate: 0.2

  // Alternatively, to control sampling dynamically
  tracesSampler: samplingContext => { ... }
});
如果設置了這些選項之一,則將在您的應用程式中啟用跟蹤。雖然這些選項是互斥的,但是如果您同時設置了這兩個選項,tracesSampler 將具有優先權。您可以在 Sampling Transactions 中了解有關它們如何工作的更多資訊。
驗證
首次啟用跟蹤時,通過將 tracesSampleRate 設置為 1.0 來驗證其是否正常運行,因為這可以確保將每個事務發送到 Sentry。
一旦測試完成,我們建議在生產中降低這個值,方法是降低您的 tracesSampleRate 值,或者切換到使用 tracesSampler 來動態取樣和過濾您的 transaction。
在沒有取樣的情況下,我們的自動檢測將在任何用戶載入任何頁面或在應用程式中的任何位置導航時發送 transaction。那是很多 transactions!取樣可以實現代表性數據,而無需佔用系統或 Sentry transaction 配額。
中文文檔陸續同步到:
我是為少。
微信:uuhells123。
公眾號:黑客下午茶。
謝謝點贊支援👍👍👍!


