部署 Prometheus 和 Grafana 到 k8s
- 2020 年 12 月 5 日
- 筆記
- Soluntions
在 k8s 中部署 Prometheus 和 Grafana
Intro
上次我們主要分享了 asp.net core 集成 prometheus,以及簡單的 prometheus 使用,在實際在 k8s 中部署的時候就不能在使用前面講的靜態配置的方式來部署了,需要使用 Prometheus 的服務發現。
部署規劃
Prometheus 和 Grafana 的部署放在一個單獨的 namespace —— monitoring 下面,這樣的好處在於可以屏蔽掉一些細節,別的 namespace 無感知,也不需要知道它們的存在
可以使用 kubectl create namespace monitoring 來創建命名空間或者 kubectl apply 執行下面的 yaml 配置
apiVersion: v1
kind: Namespace
metadata:
  name: monitoring
希望 prometheus 和 grafana 可以公網訪問,所以需要配置一下埠號,NodePort 31100~31200 保留為基礎設施使用的埠,31110 保留為 prometheus 需要的埠,31120 保留為 Grafana 埠,埠規劃好後,就可以先配置 nginx 了,增加 nginx 配置如下:
server {
    listen 443;
    server_name monitoring.weihanli.xyz;
    location / {
        proxy_pass //172.18.0.2:31110;
        proxy_set_header X-Real-IP $remote_addr;
        proxy_set_header X-Forwarded-For $proxy_add_x_forwarded_for;
    }
}
server {
    listen 443;
    server_name grafana.weihanli.xyz;
    location / {
        proxy_pass //172.18.0.2:31120;
        proxy_set_header X-Real-IP $remote_addr;
        proxy_set_header X-Forwarded-For $proxy_add_x_forwarded_for;
    }
}
Grafana 比較簡單,部署一個 service,部署一個 deployment 就可以了,Prometheus 要把配置文件放到 ConfigMap 里單獨管理,另外 Prometheus 涉及到要使用 k8s 服務發現,需要創建一個 serviceAccount 以有許可權來獲取 k8s 中的資源
部署 Grafana
部署 deployment,deployment yaml 如下,可以根據自己需要進行調整
apiVersion: apps/v1
kind: Deployment
metadata:
  name: grafana
  namespace: monitoring
  labels:
    app: grafana
spec:
  replicas: 1
  revisionHistoryLimit: 2
  selector:
    matchLabels:
      app: grafana
  minReadySeconds: 0
  strategy:
    type: RollingUpdate
    rollingUpdate:
      maxUnavailable: 1
      maxSurge: 1
  template:
    metadata:
      labels:
        app: grafana
    spec:
      containers:
        - name: grafana
          image: grafana/grafana
          imagePullPolicy: IfNotPresent
          resources:
            limits:
              memory: "128Mi"
              cpu: "50m"
          readinessProbe:
            httpGet:
              path: /api/health
              port: 3000
            initialDelaySeconds: 60
            periodSeconds: 10
          livenessProbe:
            tcpSocket:
              port: 3000
            initialDelaySeconds: 60
            periodSeconds: 10
          ports:
            - containerPort: 3000
根據上面的 yaml 定義創建 Grafana 的 deploy,創建之後再創建 service
apiVersion: v1
kind: Service
metadata:
  name: grafana
  namespace: monitoring
spec:
  selector:
    app: grafana
  type: NodePort
  ports:
  - protocol: TCP
    port: 3000
    targetPort: 3000
    nodePort: 31120
創建之後就可以在 k8s 集群外部訪問到 Grafana 了,通過前面 nginx 的配置我們就可以直接通過域名訪問了
部署 Prometheus
ServiceAccount
首先我們先創建一個 Service Account,k8s 使用基於角色的 RBAC 授權機制,創建 ServiceAccount 之後還需要創建一個 ClusterRole 和 ClusterRoleBinding,ClusterRole 用於指定許可權,ClusteRoleBinding 用來給 serviceAccount 關聯角色,為了方便這幾個都定義在了一個 yaml 文件中
apiVersion: v1
kind: ServiceAccount
metadata:
  name: prometheus
  namespace: monitoring

---
apiVersion: rbac.authorization.k8s.io/v1
kind: ClusterRole
metadata:
  name: prometheus
rules:
- apiGroups: [""]
  resources:
  - nodes
  - services
  - endpoints
  - pods
  verbs: ["get", "list", "watch"]
- apiGroups: [""]
  resources:
  - configmaps
  verbs: ["get"]
- nonResourceURLs: ["/metrics"]
  verbs: ["get"]


---
apiVersion: rbac.authorization.k8s.io/v1
kind: ClusterRoleBinding
metadata:
  name: prometheus
roleRef:
  apiGroup: rbac.authorization.k8s.io
  kind: ClusterRole
  name: prometheus
subjects:
- kind: ServiceAccount
  name: prometheus
  namespace: monitoring
ConfigMap
創建 ServiceAccount 之後,我們創建 Prometheus 的配置文件,放在 ConfigMap 中掛載在 Prometheus 里
apiVersion: v1
kind: ConfigMap
metadata:
  name: prometheus-config
  namespace: monitoring
data:
  default: |
    # my global config
    global:
      scrape_interval:     10s # Set the scrape interval to every 15 seconds. Default is every 1 minute.
      evaluation_interval: 15s # Evaluate rules every 15 seconds. The default is every 1 minute.

    # Load rules once and periodically evaluate them according to the global 'evaluation_interval'.
    rule_files:
      # - "first_rules.yml"
      # - "second_rules.yml"

    # A scrape configuration containing exactly one endpoint to scrape:
    scrape_configs:
      - job_name: 'kubernetes-service-endpoints'
        kubernetes_sd_configs:
        - role: endpoints
        relabel_configs:
        - source_labels: [__meta_kubernetes_service_annotation_prometheus_io_should_be_scraped]
          action: keep
          regex: true
        - action: labelmap
          regex: __meta_kubernetes_pod_label_(.+)
        - source_labels: [__meta_kubernetes_namespace]
          action: replace
          target_label: k8s_namespace
        - source_labels: [__meta_kubernetes_service_name]
          action: replace
          target_label: k8s_service
        - source_labels: [__meta_kubernetes_pod_name]
          separator: ;
          regex: (.*)
          replacement: $1
          target_label: k8s_pod
          action: replace
執行上面的 yaml 配置以部署 prometheus 需要的配置
我們可以利用 prometheus 的 relabel 的機制將一些元數據資訊應用的 metrics 資訊上,這樣我們就可以知道這個 metrics 資訊是來自哪一個 namespace 下面哪一個 service 哪一個 Pod 里,在 Prometheus targets 的介面可以看到所有的 metadata label,或者參考文檔上的介紹 //prometheus.io/docs/prometheus/latest/configuration/configuration#kubernetes_sd_config
__meta_kubernetes_service_annotation_prometheus_io_should_be_scraped 是我後面加上的,不加這個的話,會嘗試從所有的 k8s 資源中獲取 metrics 資訊,這回導致很多沒有集成 Prometheus metrics 的資源也會被持續訪問,所以增加了這個配置,如果 service 里的 annotation 里有 prometheus.io/should_be_scraped 配置的話 Prometheus 才會去拉取 metrics 資訊
需要 Prometheus 抓取 metrics 的 service 配置實力:
apiVersion: v1
kind: Service
metadata:
  name: reservation-server
  annotations:
    prometheus.io/should_be_scraped: "true"
spec:
  selector:
    app: reservation-server
  type: NodePort
  ports:
  - protocol: TCP
    port: 80
    targetPort: 80
    nodePort: 31220
如果後面需要配置不同的 metrics_path,也可以使用類似的模式來增加一個 prometheus.io/metrics-path 類似的配置轉換成真正要拉取 metrics 資訊的 path 即可
Deployment
前面 Prometheus 部署所需要的 serviceAccount 和 config 我們都已經準備好了,執行下面的 yaml 配置就可以部署應用了
apiVersion: apps/v1
kind: Deployment
metadata:
  name: prometheus
  namespace: monitoring
  labels:
    app: prometheus
spec:
  replicas: 1
  revisionHistoryLimit: 2 # how many old ReplicaSets for this Deployment you want to retain, //kubernetes.io/docs/concepts/workloads/controllers/deployment/#clean-up-policy
  selector:
    matchLabels:
      app: prometheus
  minReadySeconds: 0
  strategy:
    type: RollingUpdate
    rollingUpdate:
      maxUnavailable: 1
      maxSurge: 1
  template:
    metadata:
      labels:
        app: prometheus
    spec:
      serviceAccountName: prometheus
      containers:
        - name: prometheus
          image: prom/prometheus
          imagePullPolicy: IfNotPresent
          resources:
            limits:
              memory: "512Mi"
              cpu: "200m"
          readinessProbe:
            httpGet:
              path: /-/ready
              port: 9090
            initialDelaySeconds: 60
            periodSeconds: 10
          livenessProbe:
            httpGet:
              path: /-/healthy
              port: 9090
            initialDelaySeconds: 60
            periodSeconds: 10
          ports:
            - containerPort: 80
          volumeMounts:
          - name: config
            mountPath: /etc/prometheus/prometheus.yml
            subPath: default

      volumes:
        - name: config
          configMap:
            name: prometheus-config
Service
deployment 創建之後,只要根據下面的配置創建 service 就可以訪問了
apiVersion: v1
kind: Service
metadata:
  name: prometheus
  namespace: monitoring
spec:
  selector:
    app: prometheus
  type: NodePort
  ports:
  - protocol: TCP
    port: 9090
    targetPort: 9090
    nodePort: 31110
Sample
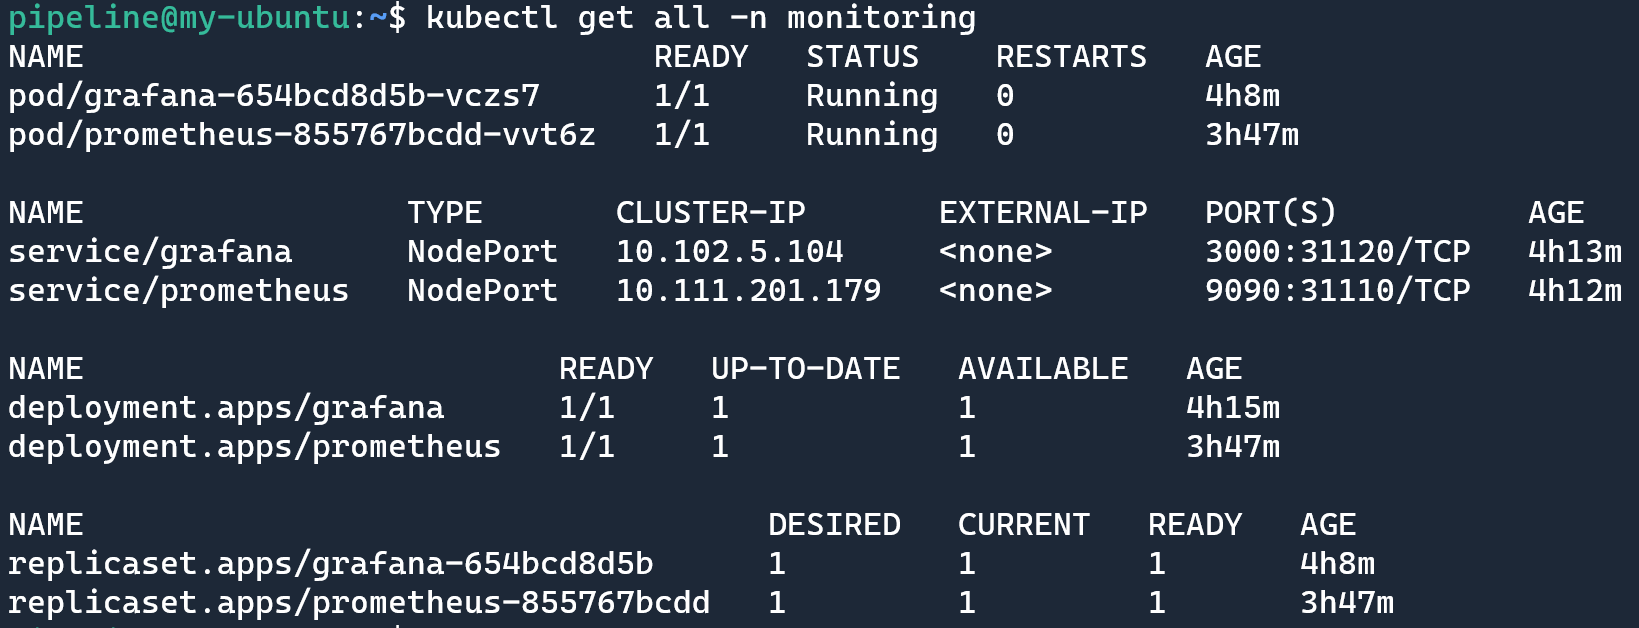
運行 kubectl get all -n monitoring 查看部署之後的資源情況:
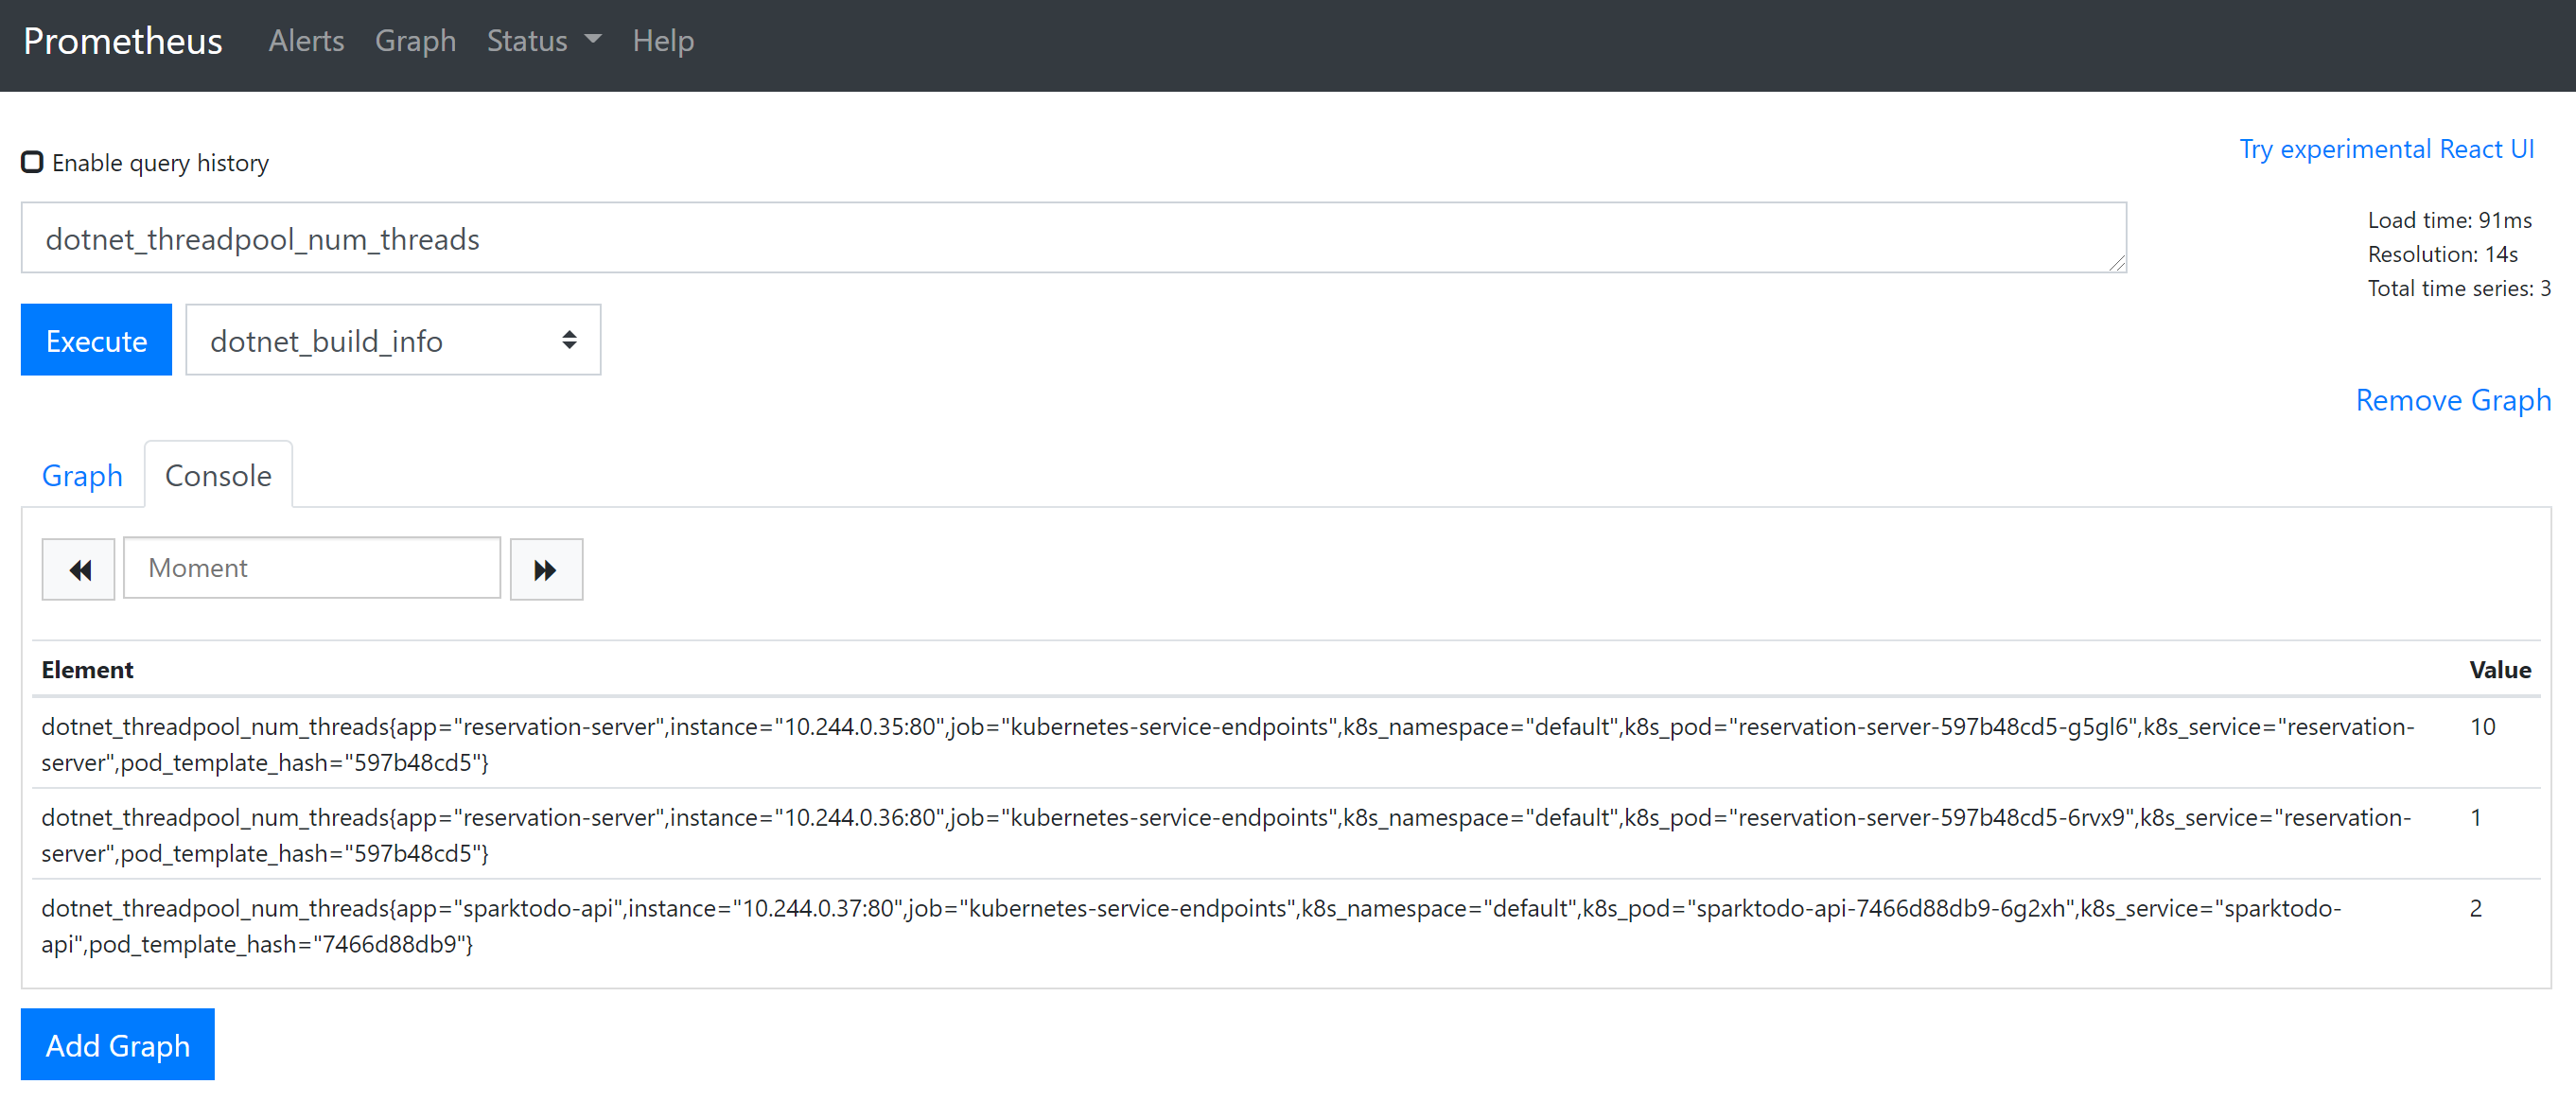
打開 prometheus 可以執行一個簡單的查詢,看一下
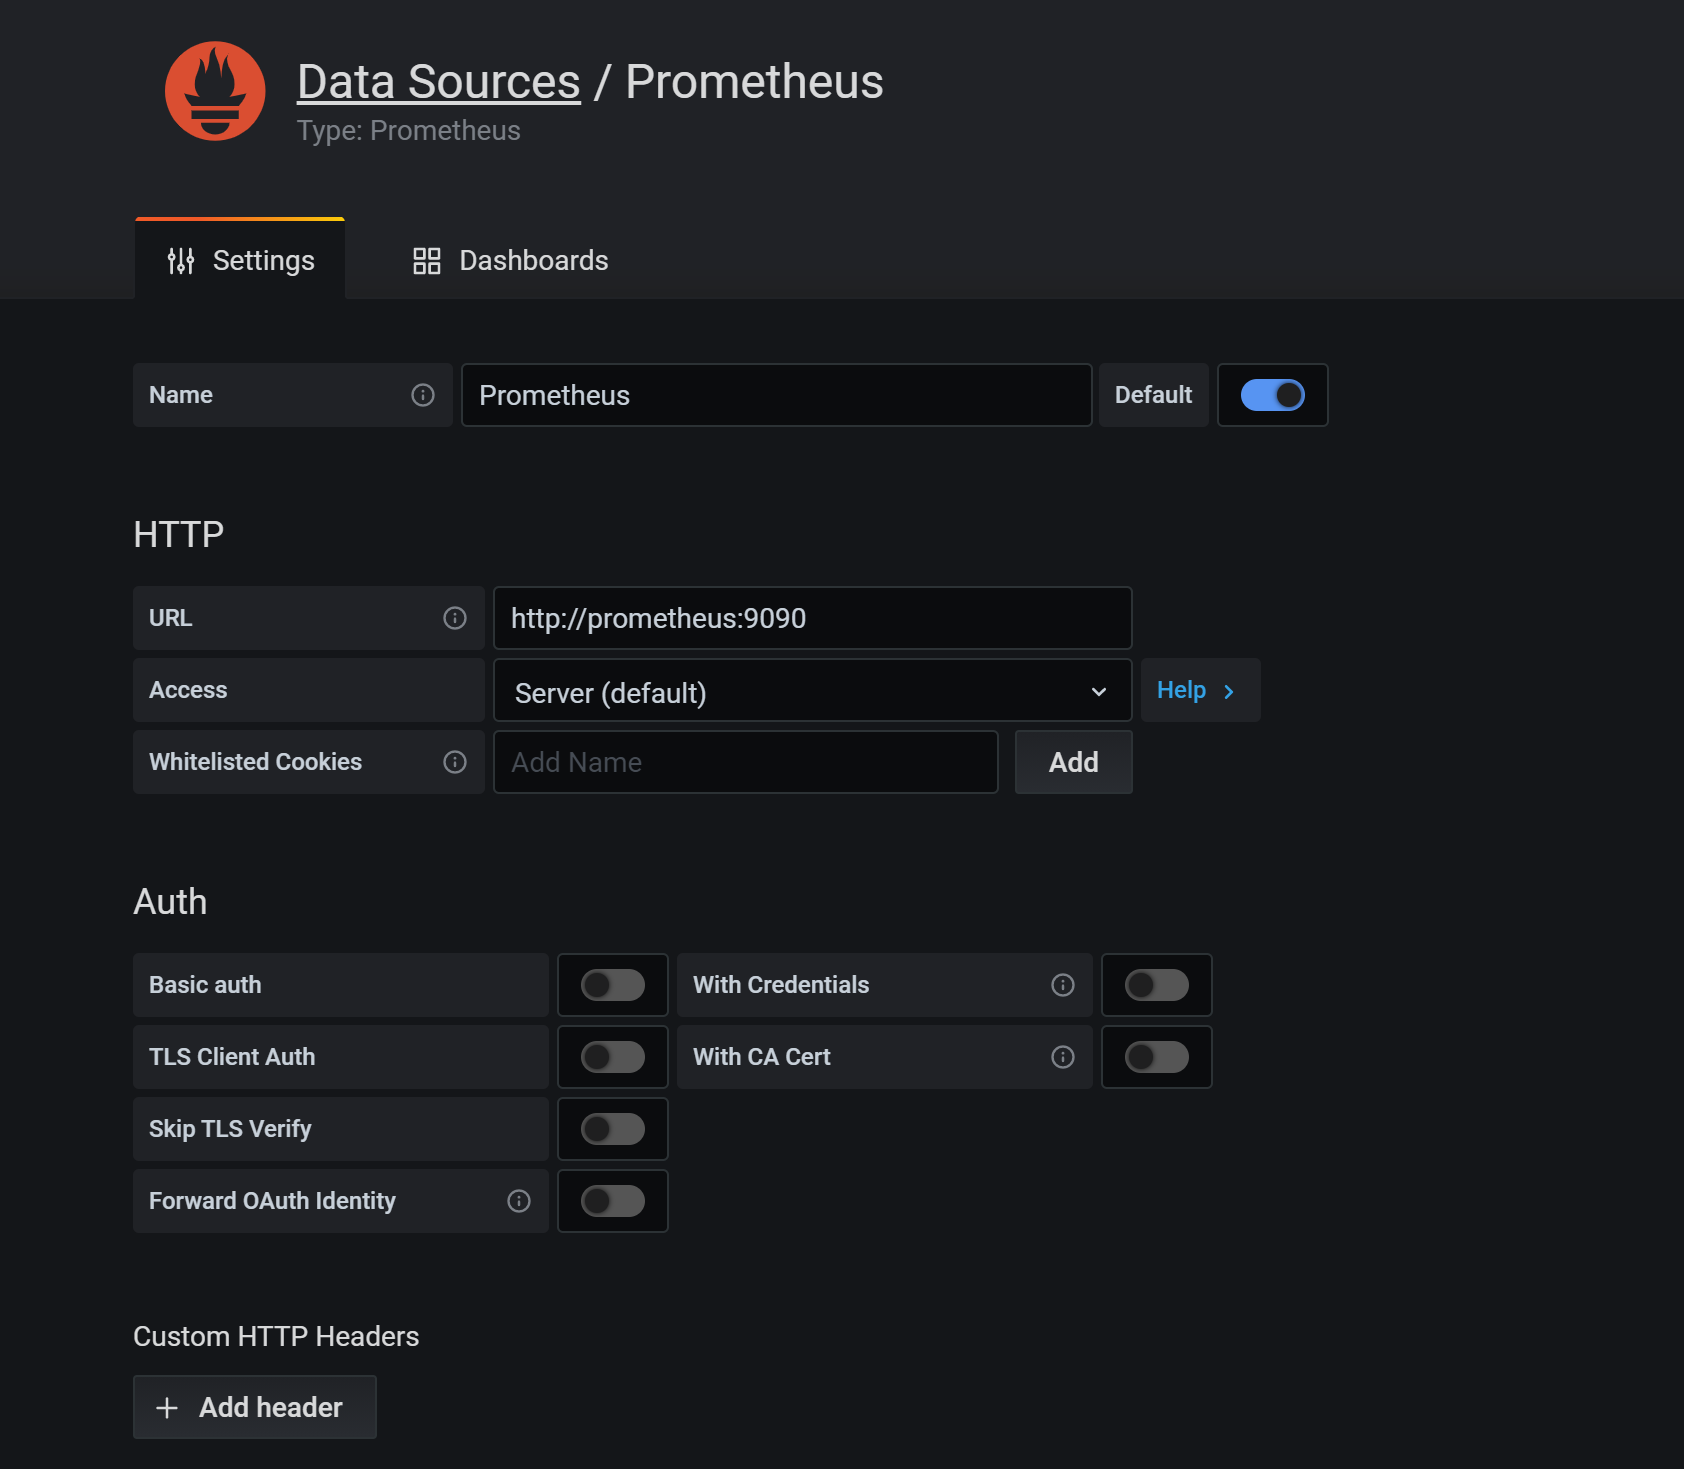
在 Grafana 中添加 DataSource,域名使用 service name prometheus 即可,這樣可以通過內網去訪問,就不需要繞公網走一圈了
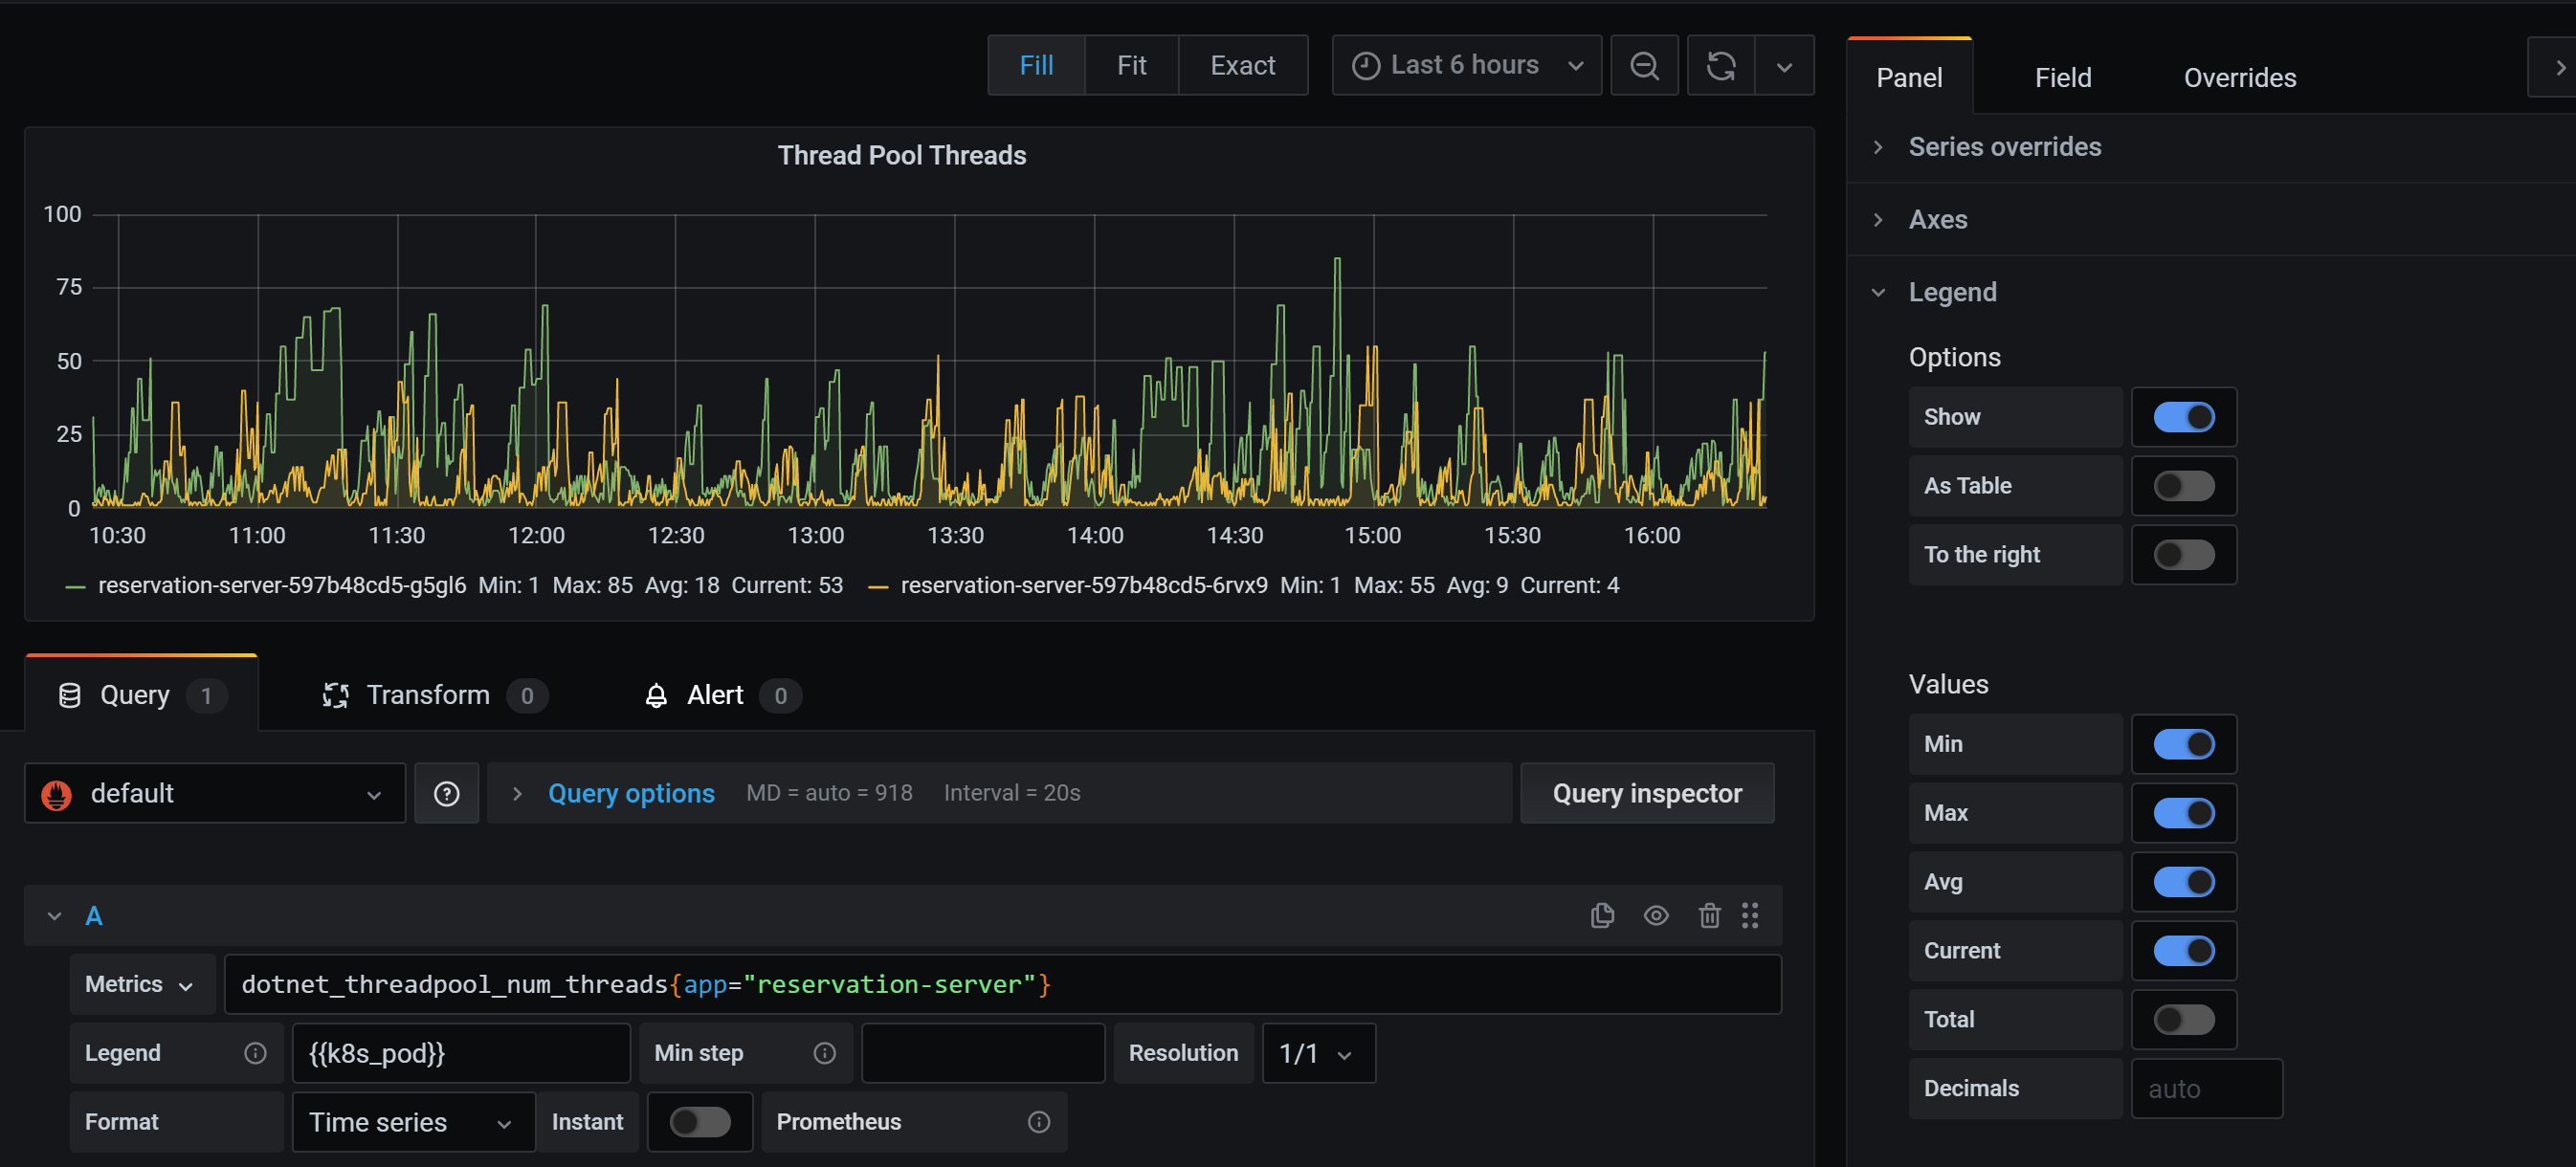
新建一個 Dashboard 把剛才的查詢通過 Grafana 來做一個展示,新建一個 Panel,輸入剛才我們執行的查詢

Legend 中可以使用 lable,使用語法可以用 {{label_name}}
可以在右側方便設置顯示最小值,最大值,平均值,當前值和總計

如果要添加篩選條件如只看某一個 app 的數據,可以在查詢表達式中添加條件,使用語法 metrics_name{label_name=”label_value”}
更多查詢語法可以參考官方文檔的介紹 //prometheus.io/docs/prometheus/latest/querying/basics/
More
上面部署的時候沒有做數據的掛載,實際部署的時候需要考慮掛載數據目錄,這樣即使服務重啟,數據還是在的,如果不關心數據問題的話可以忽略
Reference
- //github.com/OpenReservation/ReservationServer/blob/dev/k8s/prometheus/deployment.yaml
- //github.com/OpenReservation/ReservationServer/blob/dev/k8s/prometheus/configMap.yaml
- //github.com/OpenReservation/ReservationServer/blob/dev/k8s/grafana/deployment.yaml
- //github.com/OpenReservation/ReservationServer/blob/dev/k8s/grafana/service.yaml
- //medium.com/kubernetes-tutorials/monitoring-your-kubernetes-deployments-with-prometheus-5665eda54045
- //prometheus.io/docs/prometheus/latest/configuration/configuration
- //prometheus.io/docs/prometheus/latest/querying/basics/


