Python之Matplot——01.堆疊柱狀圖的繪製
- 2020 年 11 月 15 日
- 筆記
- ,數據可視化, matplotlib, Python
1.Matplotlib是python的一個繪圖庫,可以方便的繪製各種圖標,是數據可視化的利器。
2.本文我就給大家介紹一下條形圖或者說柱狀圖的繪製
3.程式碼如下:
《1》首先導入模組
1 import matplotlib.pyplot as plt
《2》準備數據
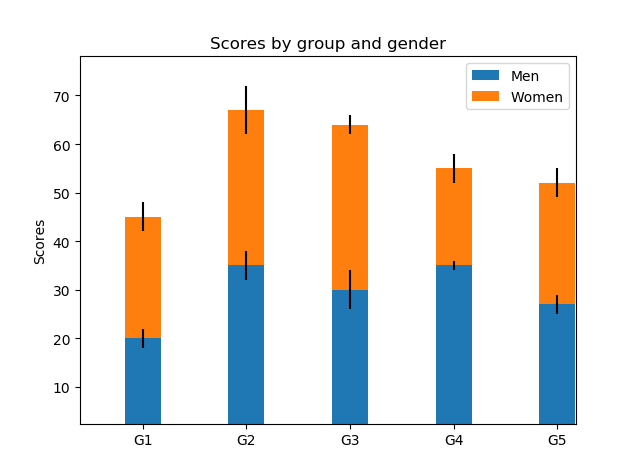
labels = ['G1', 'G2', 'G3', 'G4', 'G5']

men_means = [20, 35, 30, 35, 27]
women_means = [25, 32, 34, 20, 25]
men_std = [2, 3, 4, 1, 2]
women_std = [3, 5, 2, 3, 3]
《3》設置寬度
width = 0.35 # 條形圖的寬度
《4》獲取子圖對象
fig,ax = plt.subplots()
《5》繪製第一層柱狀圖和第二層柱狀圖
ax.bar(labels, men_means,width,yerr=men_std,label='Men')
ax.bar(labels,women_means,width,yerr=women_std,bottom=men_means,label='Women')
《6》設置標題和標籤
ax.set_ylabel('Scores')
ax.set_title('Scores by group and gender')
《7》圖例和顯示
ax.legend()

plt.show()
4.全部程式碼如下
import matplotlib.pyplot as plt
#條形圖的繪製
labels = ['G1', 'G2', 'G3', 'G4', 'G5']

men_means = [20, 35, 30, 35, 27]
women_means = [25, 32, 34, 20, 25]
men_std = [2, 3, 4, 1, 2]
women_std = [3, 5, 2, 3, 3]
width = 0.35  # 條形圖的寬度
fig,ax = plt.subplots()
ax.bar(labels, men_means,width,yerr=men_std,label='Men')
ax.bar(labels,women_means,width,yerr=women_std,bottom=men_means,label='Women')

ax.set_ylabel('Scores')
ax.set_title('Scores by group and gender')
ax.legend()

plt.show()
5.效果展示