Spring Boot 2.X(十六):應用監控之 Spring Boot Actuator 使用及配置
- 2019 年 11 月 13 日
- 筆記
Actuator 簡介
Actuator 是 Spring Boot 提供的對應用系統的自省和監控功能。通過 Actuator,可以使用數據化的指標去度量應用的運行情況,比如查看伺服器的磁碟、記憶體、CPU等資訊,系統的執行緒、gc、運行狀態等等。
Actuator 通常通過使用 HTTP 和 JMX 來管理和監控應用,大多數情況使用 HTTP 的方式。
Actuator 端點說明
| 端點 | 描述 |
|---|---|
| auditevents | 獲取當前應用暴露的審計事件資訊 |
| beans | 獲取應用中所有的 Spring Beans 的完整關係列表 |
| caches | 獲取公開可以用的快取 |
| conditions | 獲取自動配置條件資訊,記錄哪些自動配置條件通過和沒通過的原因 |
| configprops | 獲取所有配置屬性,包括默認配置,顯示一個所有 @ConfigurationProperties 的整理列版本 |
| env | 獲取所有環境變數 |
| flyway | 獲取已應用的所有Flyway資料庫遷移資訊,需要一個或多個 Flyway Bean |
| liquibase | 獲取已應用的所有Liquibase資料庫遷移。需要一個或多個 Liquibase Bean |
| health | 獲取應用程式健康指標(運行狀況資訊) |
| httptrace | 獲取HTTP跟蹤資訊(默認情況下,最近100個HTTP請求-響應交換)。需要 HttpTraceRepository Bean |
| info | 獲取應用程式資訊 |
| integrationgraph | 顯示 Spring Integration 圖。需要依賴 spring-integration-core |
| loggers | 顯示和修改應用程式中日誌的配置 |
| logfile | 返回日誌文件的內容(如果已設置logging.file.name或logging.file.path屬性) |
| metrics | 獲取系統度量指標資訊 |
| mappings | 顯示所有@RequestMapping路徑的整理列表 |
| scheduledtasks | 顯示應用程式中的計劃任務 |
| sessions | 允許從Spring Session支援的會話存儲中檢索和刪除用戶會話。需要使用Spring Session的基於Servlet的Web應用程式 |
| shutdown | 關閉應用,要求endpoints.shutdown.enabled設置為true,默認為 false |
| threaddump | 獲取系統執行緒轉儲資訊 |
| heapdump | 返回hprof堆轉儲文件 |
| jolokia | 通過HTTP公開JMX bean(當Jolokia在類路徑上時,不適用於WebFlux)。需要依賴 jolokia-core |
| prometheus | 以Prometheus伺服器可以抓取的格式公開指標。需要依賴 micrometer-registry-prometheus |
Actuator 使用及配置
快速使用
項目依賴
<dependencies> <dependency> <groupId>org.springframework.boot</groupId> <artifactId>spring-boot-starter-web</artifactId> </dependency> <!-- actuator --> <dependency> <groupId>org.springframework.boot</groupId> <artifactId>spring-boot-starter-actuator</artifactId> </dependency> </dependencies>配置文件
management.endpoints.enabled-by-default=true #啟動所有端點 management.endpoints.web.exposure.include=* #自定義管理端點路徑 #management.endpoints.web.base-path=/manageSpring Boot 2.X 中,Actuator 默認只開放 health 和 info 兩個端點。
添加management.endpoints.web.exposure.include=*配置後啟動應用,訪問 http://127.0.0.1:8080/actuator 我們可以看到所有的 Actuator 端點列表。
如果將management.endpoints.enabled-by-default設置為false,則禁用所有端點,如需啟用則如下:
management.endpoints.enabled-by-default=false management.endpoint.info.enabled=true禁用的端點將從應用程式上下文中完全刪除。如果只想更改公開端點,使用include和exclude屬性。使用如下:
management.endpoints.web.exposure.include=* management.endpoints.web.exposure.exclude=env,beansmanagement.endpoints.web.base-path=/manage 配置表示將 /actuator 路徑重定義為 /manage。
常用端點詳解
health
主要用來檢測應用的運行狀況,是使用最多的一個監控點。監控軟體通常使用該介面實時監測應用運行狀況,在系統出現故障時把報警資訊推送給相關人員,如磁碟空間使用情況、資料庫和快取等的一些健康指標。
默認情況下 health 端點是開放的,訪問 http://127.0.0.1:8080/actuator/health 即可看到應用運行狀態。
{"status":"UP"}如果需要看到詳細資訊,則需要做添加配置:
management.endpoint.health.show-details=always訪問返回資訊如下:
{"status":"UP","details":{"diskSpace":{"status":"UP","details":{"total":180002725888,"free":8687988736,"threshold":10485760}}}}info
查看應用資訊是否在 application.properties 中配置。如我們在項目中配置是:
info.app.name=Spring Boot Actuator Demo info.app.version=v1.0.0 info.app.description=Spring Boot Actuator Demo啟動項目,訪問 http://127.0.0.1:8080/actuator/info 返回資訊如下:
{"app":{"name":"Spring Boot Actuator Demo","version":"v1.0.0","description":"Spring Boot Actuator Demo"}}env
通過 env 可以獲取到所有關於當前 Spring Boot 應用程式的運行環境資訊,如:作業系統資訊(systemProperties)、環境變數資訊、JDK 版本及 ClassPath 資訊、當前啟用的配置文件(activeProfiles)、propertySources、應用程式配置資訊(applicationConfig)等。
可以通過 http://127.0.0.1:8080/actuator/env/{name} ,name表示想要查看的資訊,可以獨立顯示。
beans
訪問 http://127.0.0.1:8080/actuator/beans 返回部分資訊如下:
{ "contexts": { "Spring Boot Actuator Demo": { "beans": { "endpointCachingOperationInvokerAdvisor": { "aliases": [ ], "scope": "singleton", "type": "org.springframework.boot.actuate.endpoint.invoker.cache.CachingOperationInvokerAdvisor", "resource": "class path resource [org/springframework/boot/actuate/autoconfigure/endpoint/EndpointAutoConfiguration.class]", "dependencies": [ "environment" ] }, "defaultServletHandlerMapping": { "aliases": [ ], "scope": "singleton", "type": "org.springframework.web.servlet.HandlerMapping", "resource": "class path resource [org/springframework/boot/autoconfigure/web/servlet/WebMvcAutoConfiguration$EnableWebMvcConfiguration.class]", "dependencies": [ ] }, ... } } } }從返回的資訊中我們可以看出主要展示了 bean 的別名、類型、是否單例、類的地址、依賴等資訊。
conditions
通過 conditions 可以在應用運行時查看程式碼了某個配置在什麼條件下生效,或者某個自動配置為什麼沒有生效。
訪問 http://127.0.0.1:8080/actuator/conditions 返回部分資訊如下:
{ "contexts": { "Spring Boot Actuator Demo": { "positiveMatches": { "SpringBootAdminClientAutoConfiguration": [ { "condition": "OnWebApplicationCondition", "message": "@ConditionalOnWebApplication (required) found 'session' scope" }, { "condition": "SpringBootAdminClientEnabledCondition", "message": "matched" } ], "SpringBootAdminClientAutoConfiguration#metadataContributor": [ { "condition": "OnBeanCondition", "message": "@ConditionalOnMissingBean (types: de.codecentric.boot.admin.client.registration.metadata.CompositeMetadataContributor; SearchStrategy: all) did not find any beans" } ], ... } } } }loggers
獲取系統的日誌資訊。
訪問 http://127.0.0.1:8080/actuator/loggers 返回部分資訊如下:
{ "levels": [ "OFF", "ERROR", "WARN", "INFO", "DEBUG", "TRACE" ], "loggers": { "ROOT": { "configuredLevel": "INFO", "effectiveLevel": "INFO" }, "cn": { "configuredLevel": null, "effectiveLevel": "INFO" }, "cn.zwqh": { "configuredLevel": null, "effectiveLevel": "INFO" }, "cn.zwqh.springboot": { "configuredLevel": null, "effectiveLevel": "INFO" }, ... } }mappings
查看所有 URL 映射,即所有 @RequestMapping 路徑的整理列表。
訪問 http://127.0.0.1:8080/actuator/mappings 返回部分資訊如下:
{ "contexts": { "Spring Boot Actuator Demo": { "mappings": { "dispatcherServlets": { "dispatcherServlet": [ { "handler": "ResourceHttpRequestHandler [class path resource [META-INF/resources/], class path resource [resources/], class path resource [static/], class path resource [public/], ServletContext resource [/], class path resource []]", "predicate": "/**/favicon.ico", "details": null }, ... ] } } } } }heapdump
訪問:http://127.0.0.1:8080/actuator/heapdump會自動生成一個 GZip 壓縮的 Jvm 的堆文件 heapdump,我們可以使用 JDK 自帶的 Jvm 監控工具 VisualVM 打開此文件查看。如圖:
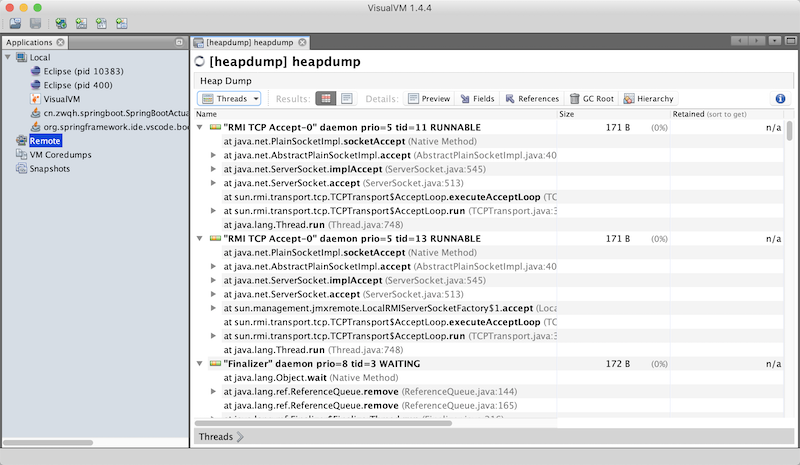
VisualVM下載:https://visualvm.github.io/download.html
threaddump
獲取系統執行緒的轉儲資訊,主要展示了執行緒名、執行緒ID、執行緒的狀態、是否等待鎖資源等資訊。在工作中,我們可以通過查看執行緒的情況來排查相關問題。
訪問 http://127.0.0.1:8080/actuator/threaddump 返回部分資訊如下:
{ "threads": [ { "threadName": "DestroyJavaVM", "threadId": 40, "blockedTime": -1, "blockedCount": 0, "waitedTime": -1, "waitedCount": 0, "lockName": null, "lockOwnerId": -1, "lockOwnerName": null, "inNative": false, "suspended": false, "threadState": "RUNNABLE", "stackTrace": [ ], "lockedMonitors": [ ], "lockedSynchronizers": [ ], "lockInfo": null }, ... ] }shutdown
開啟可以介面關閉 Spring Boot 應用,要使用這個功能需要做如下配置:
management.endpoint.shutdown.enabled=true可以通過 post(僅支援 post) 請求訪問 http://127.0.0.1:8080/actuator/shutdown 關閉應用。
metrics
訪問 http://127.0.0.1:8080/actuator/metrics 可以獲取系統度量指標資訊項如下:
{ "names": [ "jvm.memory.max", "jvm.threads.states", "jvm.gc.pause", "http.server.requests", "process.files.max", "jvm.gc.memory.promoted", "system.load.average.1m", "jvm.memory.used", "jvm.gc.max.data.size", "jvm.memory.committed", "system.cpu.count", "logback.events", "tomcat.global.sent", "jvm.buffer.memory.used", "tomcat.sessions.created", "jvm.threads.daemon", "system.cpu.usage", "jvm.gc.memory.allocated", "tomcat.global.request.max", "tomcat.global.request", "tomcat.sessions.expired", "jvm.threads.live", "jvm.threads.peak", "tomcat.global.received", "process.uptime", "tomcat.sessions.rejected", "process.cpu.usage", "tomcat.threads.config.max", "jvm.classes.loaded", "jvm.classes.unloaded", "tomcat.global.error", "tomcat.sessions.active.current", "tomcat.sessions.alive.max", "jvm.gc.live.data.size", "tomcat.threads.current", "process.files.open", "jvm.buffer.count", "jvm.buffer.total.capacity", "tomcat.sessions.active.max", "tomcat.threads.busy", "process.start.time" ] }對應訪問 names 中的指標,可以查看具體的指標資訊。如訪問 http://127.0.0.1:8080/actuator/metrics/jvm.memory.used 返回資訊如下:
{ "name": "jvm.memory.used", "description": "The amount of used memory", "baseUnit": "bytes", "measurements": [ { "statistic": "VALUE", "value": 1.16828136E8 } ], "availableTags": [ { "tag": "area", "values": [ "heap", "nonheap" ] }, { "tag": "id", "values": [ "Compressed Class Space", "PS Survivor Space", "PS Old Gen", "Metaspace", "PS Eden Space", "Code Cache" ] } ] }示例程式碼
參考文檔
https://docs.spring.io/spring-boot/docs/2.2.1.RELEASE/reference/html/production-ready-features.html
非特殊說明,本文版權歸 朝霧輕寒 所有,轉載請註明出處.
原文標題:Spring Boot 2.X(十六):應用監控之 Spring Boot Actuator 使用及配置
原文地址:https://www.zwqh.top/article/info/25
如果文章對您有幫助,請掃碼關注下我的公眾號,文章持續更新中…
![]()