phpstorm 使用xdebug
- 2020 年 10 月 19 日
- 筆記
一、在phpstudy配置
開啟xdebug的zend擴展,在php.ini 中添加下面的程式碼:
[xdebug]
zend_extension = "D:\phpstudy_pro\Extensions\php\php7.3.4nts\ext\php_xdebug.dll"
xdebug.trace_output_dir=D:/phpstudy_pro/Extensions/php_log/php7.3.4nts.xdebug.trace
xdebug.profiler_output_dir=D:/phpstudy_pro/Extensions/php_log/php7.3.4nts.xdebug.profiler
xdebug.remote_enable = On
xdebug.remote_port=9010
xdebug.remote_autostart=1
xdebug.auto_trace=1
xdebug.remote_log=D:\phpstudy_pro\Extensions\php\php7.3.4nts\xdebug.log
保存後,重啟nginx服務。
二、設置PHPstorm中的配置
1、在phpstorm中設置 php相對應的版本 File | Settings | Languages & Frameworks | PHP

2、設置 Debug File | Settings | Languages & Frameworks | PHP | Debug
修改埠號 將9000修改為在php.ini中設置的port 9010。因為9000這個埠有執行緒埠的衝突,所以需要修改一下。

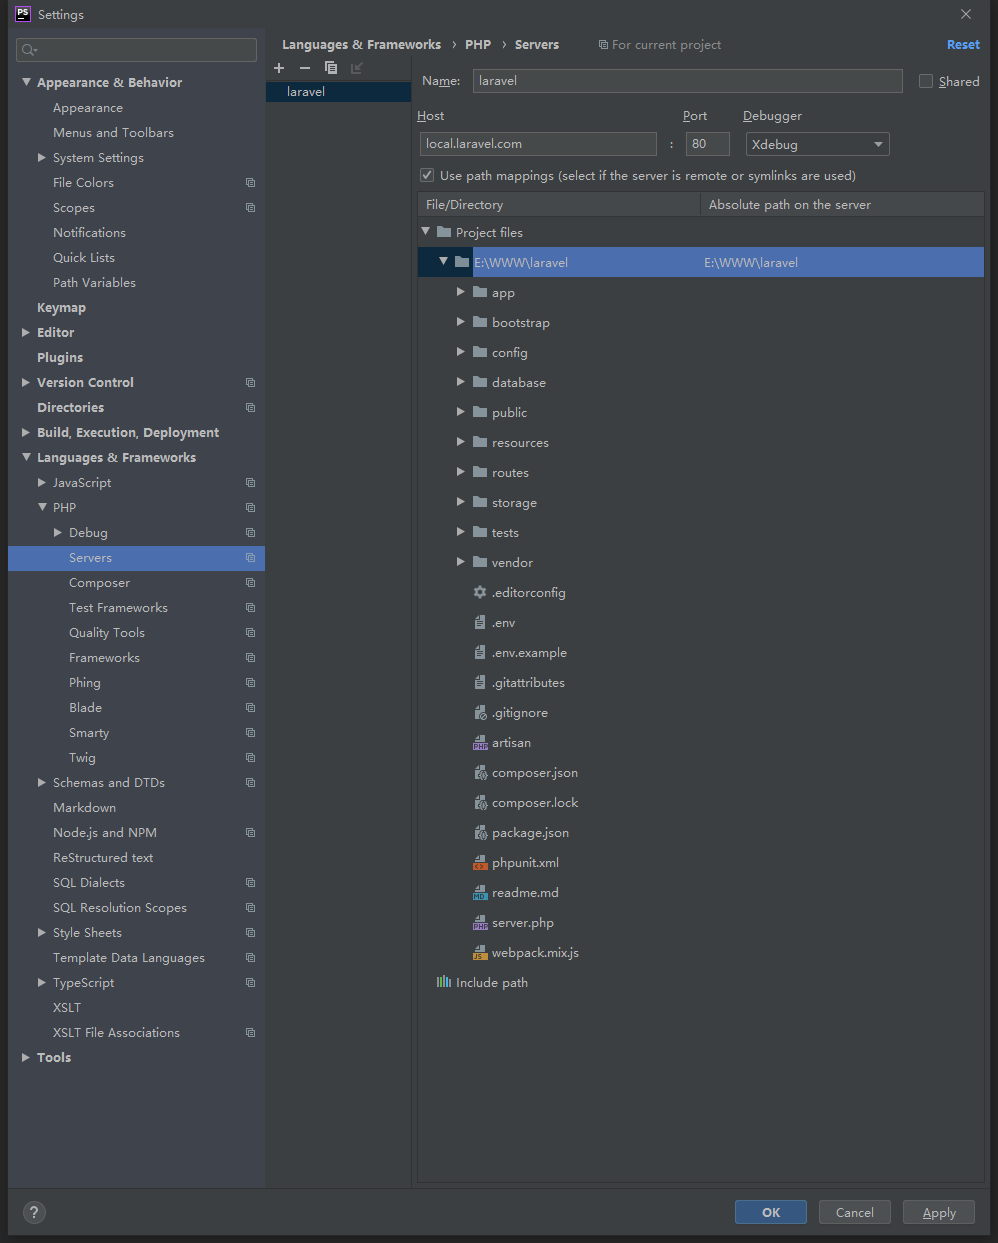
3、添加服務(servers) File | Settings | Languages & Frameworks | PHP | Servers
指定到項目的根目錄,我用的是laravel 所以就 指定到laravel 根目錄就行,不需要指定到public目錄中,因為nginx中已經配置環境了
4、設置完後開啟debug

5、打斷點
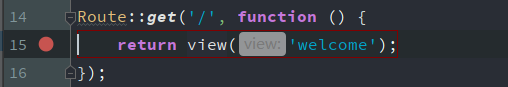
6、刷新打斷點的頁面後 phpstorm 底部就會出現打斷點的相關資訊


