Go服務監控
- 2019 年 11 月 10 日
- 筆記
使用Golang可以開發出高性能的HTTP、GRPC服務。一般項目運行後,我們也需要監控服務的性能或者進行調試。除了打日誌,還有沒有其他可視化的方案呢?答案是有的。
本文將會介紹幾種常用的監控方案。
pprof
這個是go語言自帶的。啟用很簡單:
_ "net/http/pprof"僅需顯式的在 main 包的 import 里增加上面一行即可。完整使用示例:
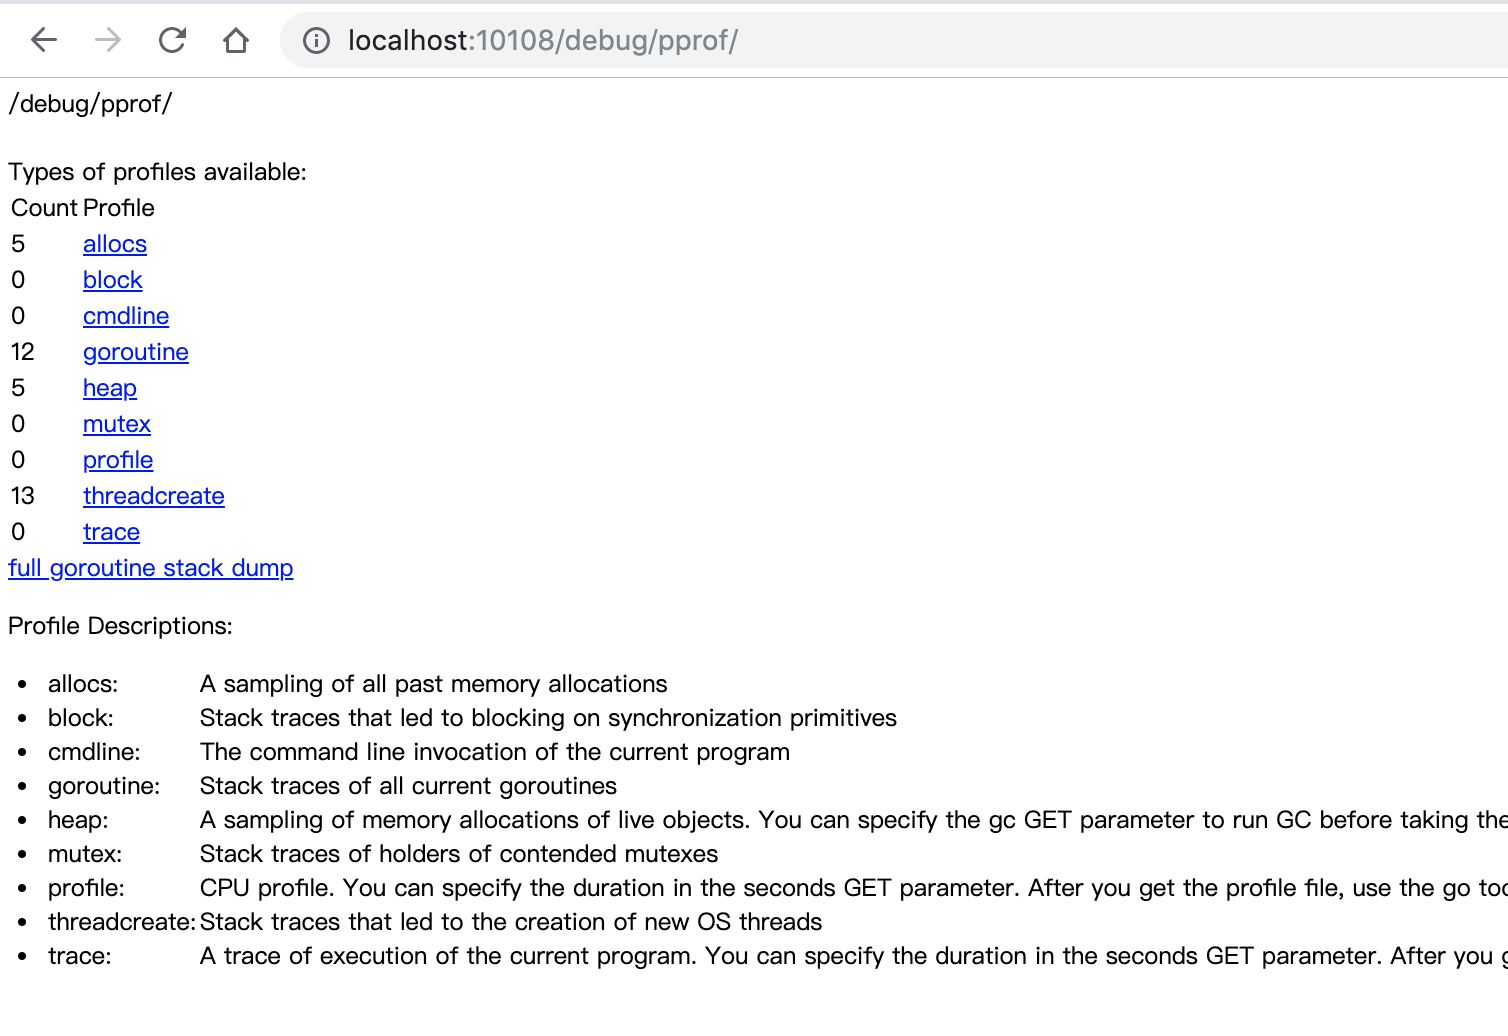
package main import ( "net/http" _ "net/http/pprof" ) func main(){ //提供給負載均衡探活以及pprof調試 http.HandleFunc("/", func(w http.ResponseWriter, r *http.Request) { w.Write([]byte("ok")) }) http.ListenAndServe(":10108", nil) }運行之後,在瀏覽器打開 http://127.0.0.1:10108/debug/pprof/就能看到監控的一些資訊了:
註:生產環境一般不會按上面那麼寫,都是開個協程:
go http.ListenAndServe(":10108", nil)如何啟動 PProf 可視化介面?
需要
graphviz支援,可以到 http://www.graphviz.org/download/ 下載,並把bin加入到環境變數。Mac可以使用brew安裝。
下面以heap為例:
方法一:
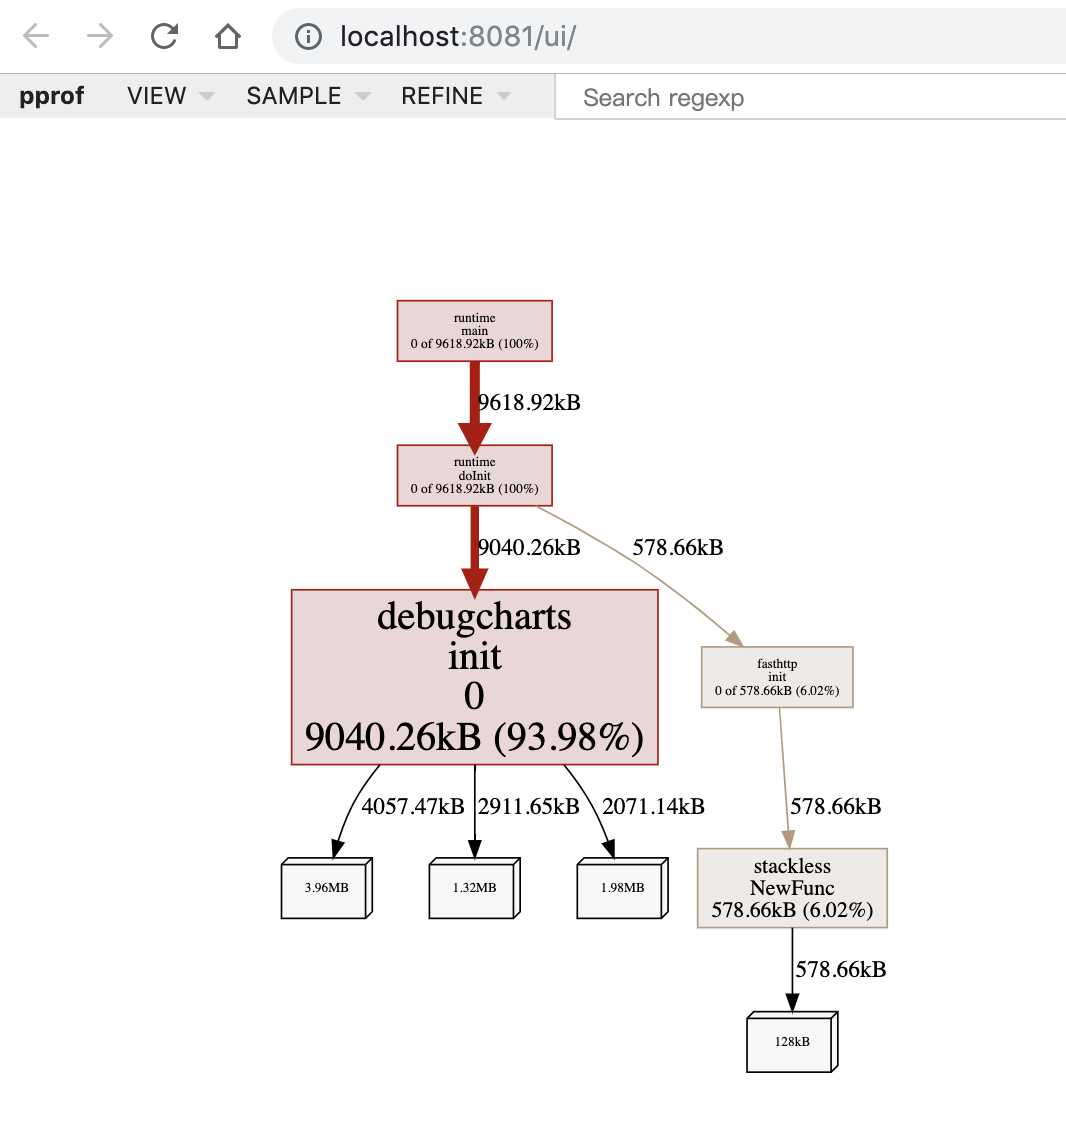
go tool pprof -http=:8081 http://localhost:10108/debug/pprof/heap方法二:
go tool pprof http://localhost:10108/debug/pprof/heap然後在互動式命令行輸入web即可跳轉到默認瀏覽器:
查看協程資訊:
go tool pprof -http=:8081 http://localhost:10108/debug/pprof/goroutinedebugcharts
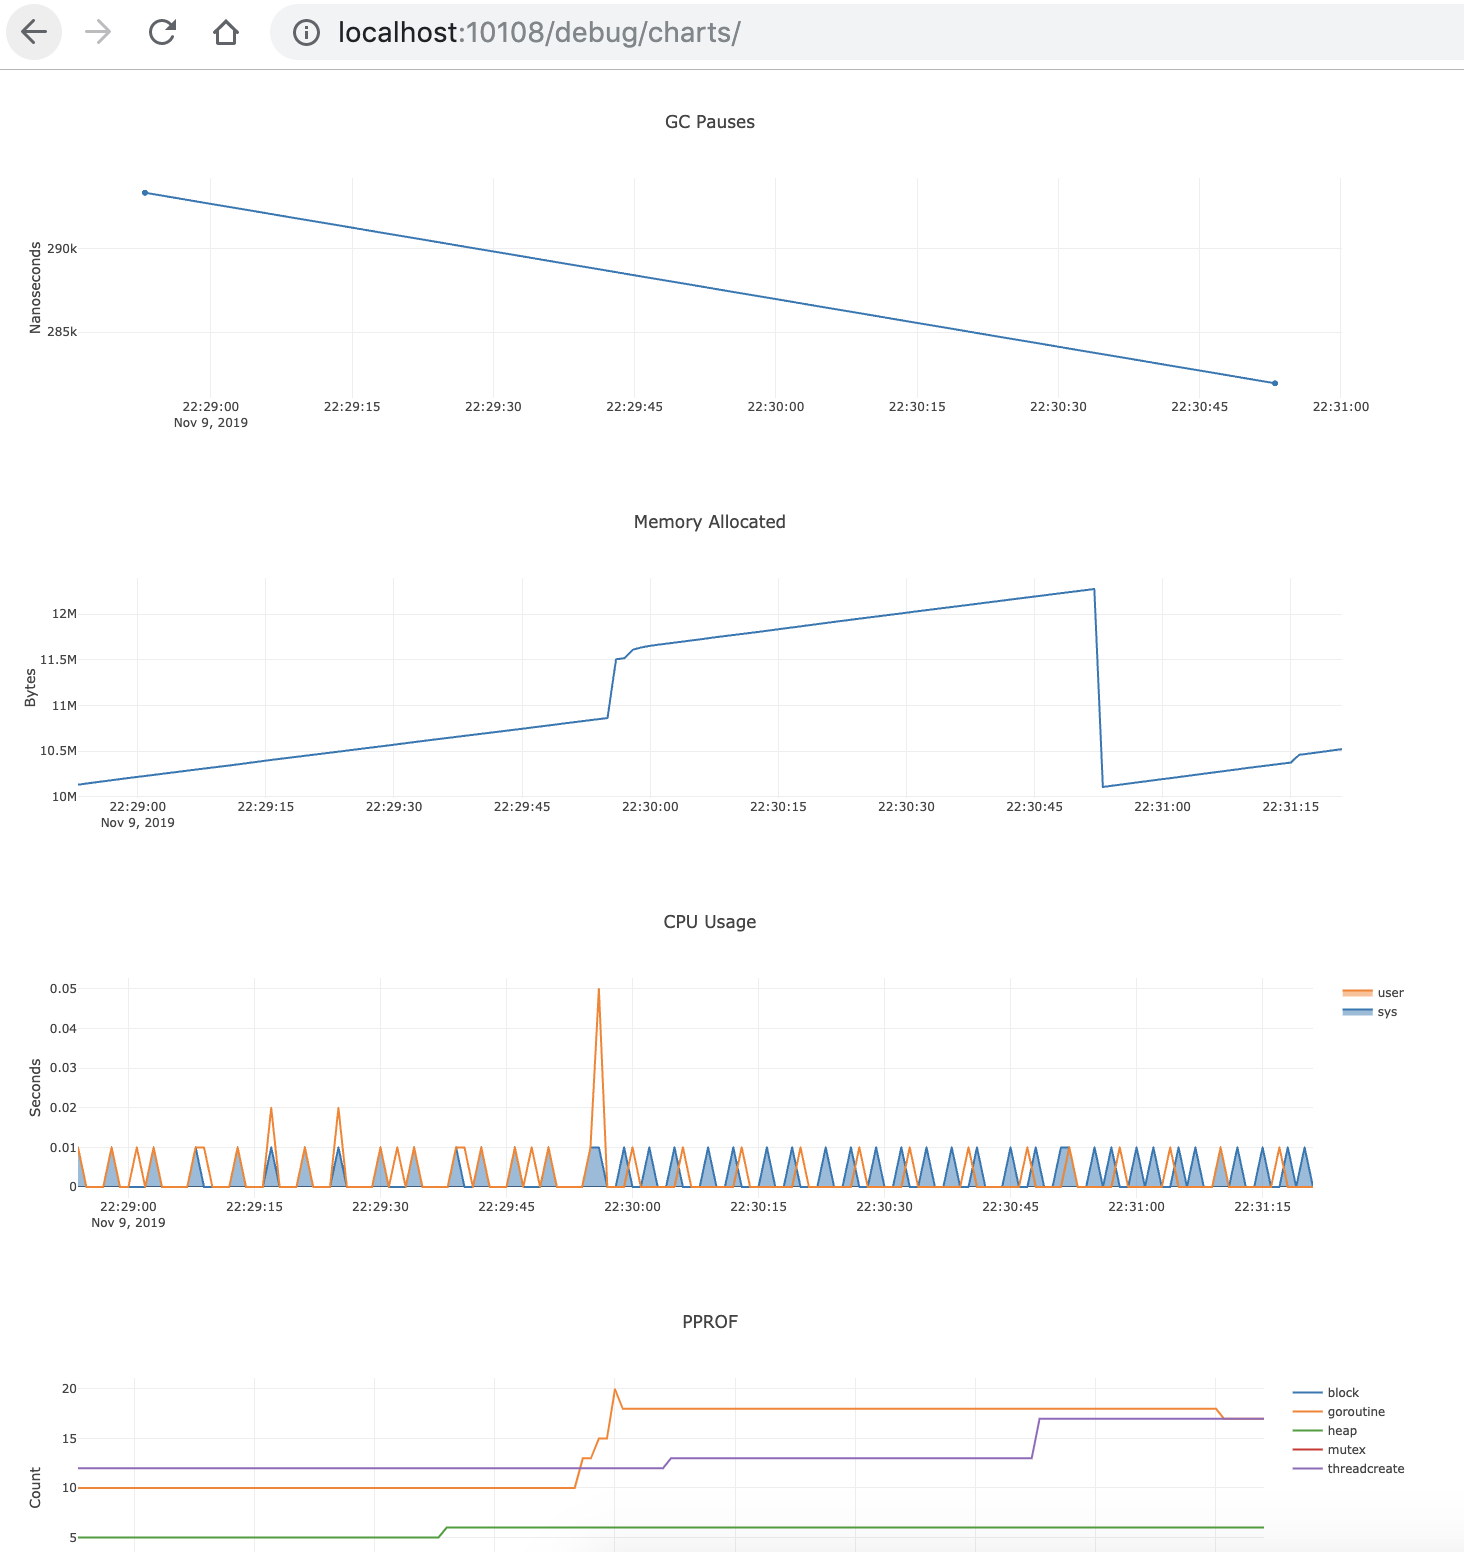
一個可以實時查看golang程式記憶體、CPU、GC、協程等變化情況的可視化工具。
跟pprof一樣, import引入, 然後開埠監聽就行了:
_ "github.com/mkevac/debugcharts"//省略其它程式碼... http.ListenAndServe(":10108", nil)運行後,瀏覽器打開 http://localhost:10108/debug/charts/ 就能看到了:
prometheus
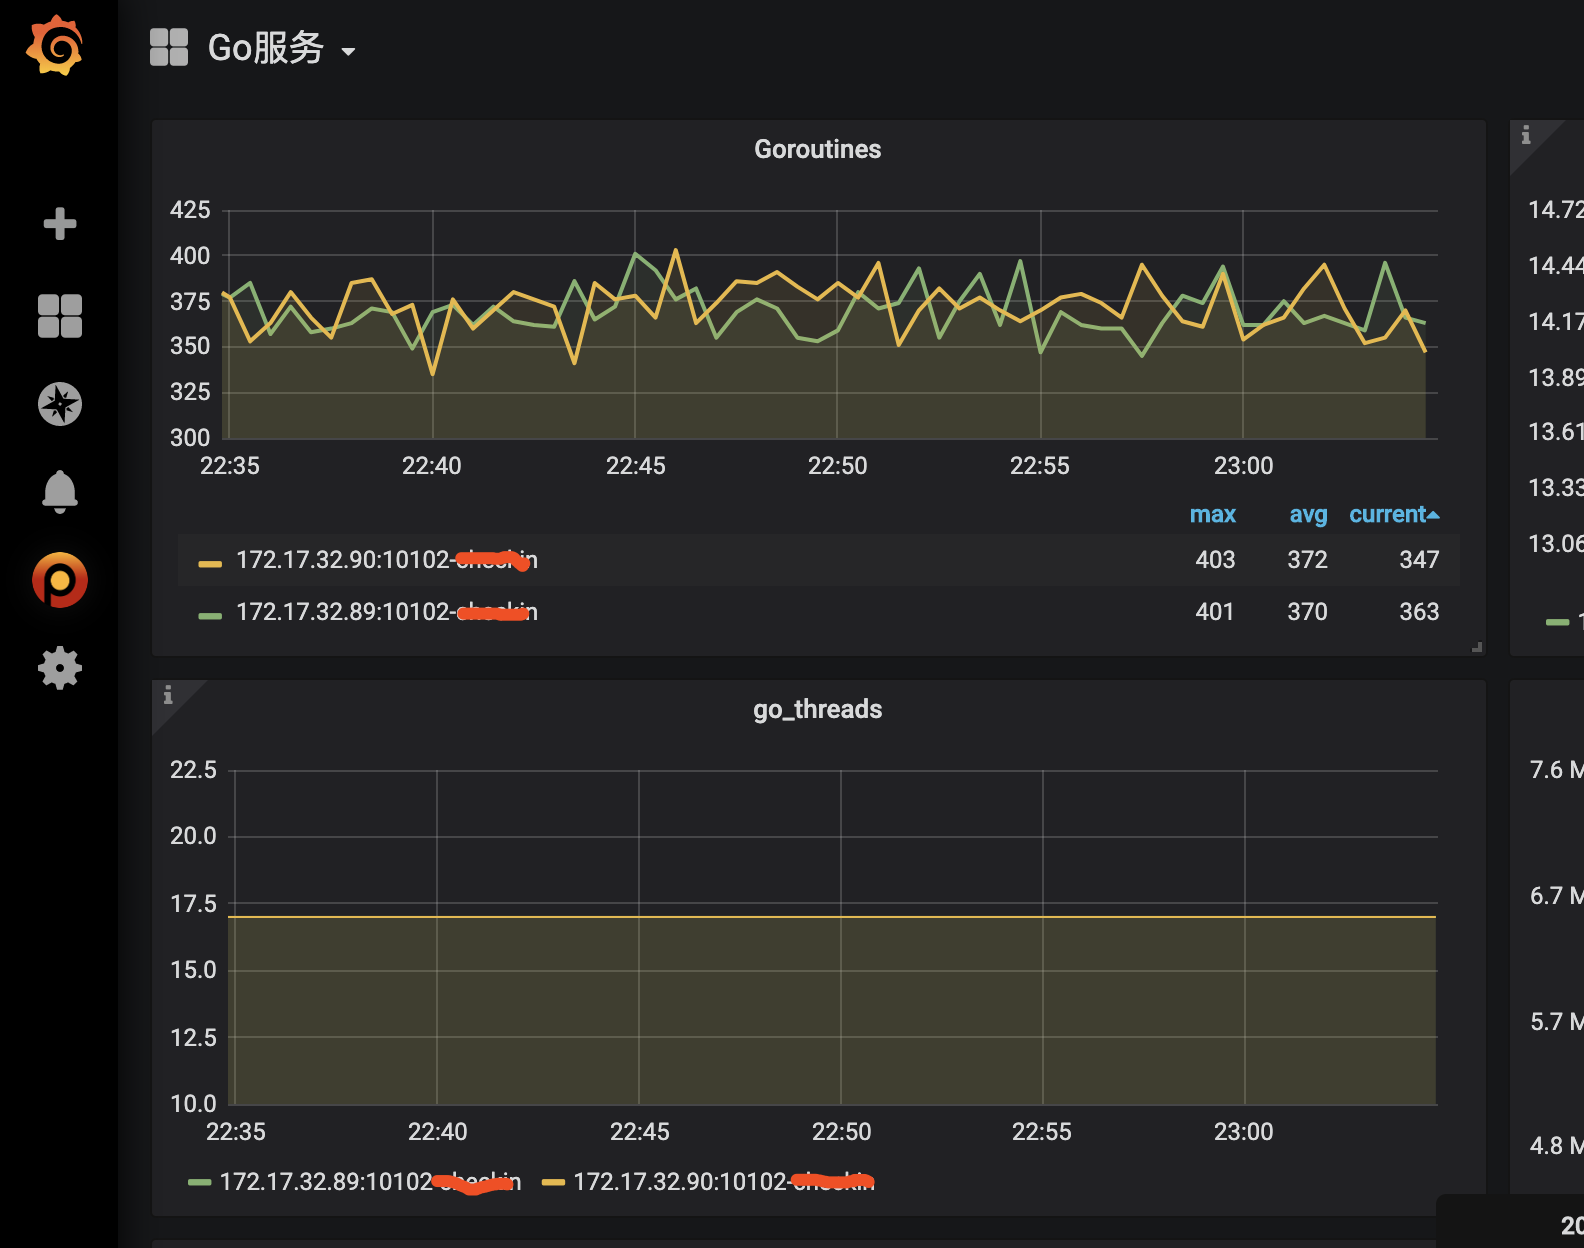
prometheus是grafana的插件,支援go監控的可視化。
首先需要程式碼里引入包:
"github.com/prometheus/client_golang/prometheus/promhttp"然後增加路由:
//prometheus http.Handle("/metrics", promhttp.Handler()) http.ListenAndServe(":10108", nil)配置grafana後,效果圖:
一個埠開啟 pprof+charts+prometheus
如果每一個監控都開一個埠就有點浪費埠了。可以在一個埠里開啟 pprof+charts+prometheus 。
1、入口文件增加程式碼:
//監控 go func() { //提供給負載均衡探活 http.HandleFunc("/", func(w http.ResponseWriter, r *http.Request) { w.Write([]byte("ok")) }) //prometheus http.Handle("/metrics", promhttp.Handler()) //pprof, go tool pprof -http=:8081 http://$host:$port/debug/pprof/heap http.ListenAndServe(":10108", nil) }()2、import增加
_ "github.com/mkevac/debugcharts" "github.com/prometheus/client_golang/prometheus/promhttp" "net/http" _ "net/http/pprof"參考
1、Golang pprof詳解
https://studygolang.com/articles/14519
2、mkevac/debugcharts: Very simple charts with some debug data for Go programs
https://github.com/mkevac/debugcharts
3、prometheus/client_golang: Prometheus instrumentation library for Go applications
https://github.com/prometheus/client_golang/

