一款用於繪製狀態機轉換圖和流程圖的web在線繪圖工具
- 2019 年 11 月 7 日
- 筆記
大型軟體系統中離不開各類狀態機的處理,日常工作中也涉及到各類事務處理流程;從表現力看文不如表,表不如圖;因此日常工作中經常需要繪製各種狀態機的狀態轉換圖和流程圖,以協助理解程式碼邏輯和各類事務處理流程等。
繪製此類圖形的常用工具有visio,liberoffice draw等,這些軟體採用”所見即所得”的設計思想,完全由手動放置形狀、填充文本、繪製線條、拖動箭頭指向關係、調整文本格式、調整布局等等。此類工具優點是繪圖直觀、布局可控;缺點一是需要安裝專門的軟體;二是過於繁瑣,以狀態機狀態轉換圖為例,當狀態和激勵較多時,表示狀態的矩形框和表示激勵的線條會顯得很凌亂,新添加狀態或者激勵時可能需要重新調整已有狀態和激勵的布局。
為了提高繪圖效率,同時讓繪圖在每台電腦上隨時可用,以及隨時可以訪問已經繪製的圖形協助程式碼分析,用python+graphviz開發了狀態機在線繪圖工具。
工具以下列格式的文本作為輸入:
source:XXX; trigger:YYY; destination:ZZZ; color="red"
上述文本表示在XXX狀態下收到YYY激勵會跳轉到新的ZZZ狀態;color=”red”表示該條邊繪製為紅色,可以設置其他顏色,不設置默認為黑色。
注意:上述輸入文本格式中,source,tigger,destination後面必須要有英文冒號(:)和英文分號(;)。
只要在輸入框內輸入多條上述語句,點擊按鈕即可一鍵自動繪圖,只要有網路訪問即可,不需要安裝軟體,不需要手動繪製各類形狀和線條。
下圖是工具繪圖的簡單示例:
訪問http://www.tasksteper.com:8099/flow/home/;以用戶名/密碼:testuser1/ testuser1登錄;進入“集成工具”項目後;點擊“創建條目”;
概要欄隨便填寫,輸入欄輸入以下文本框中的內容;點擊“創建”按鈕後;在刷新後的介面點擊“Graphviz繪圖”按鈕,即可在頁面右側看到繪製的狀態轉換圖;如下圖所示:
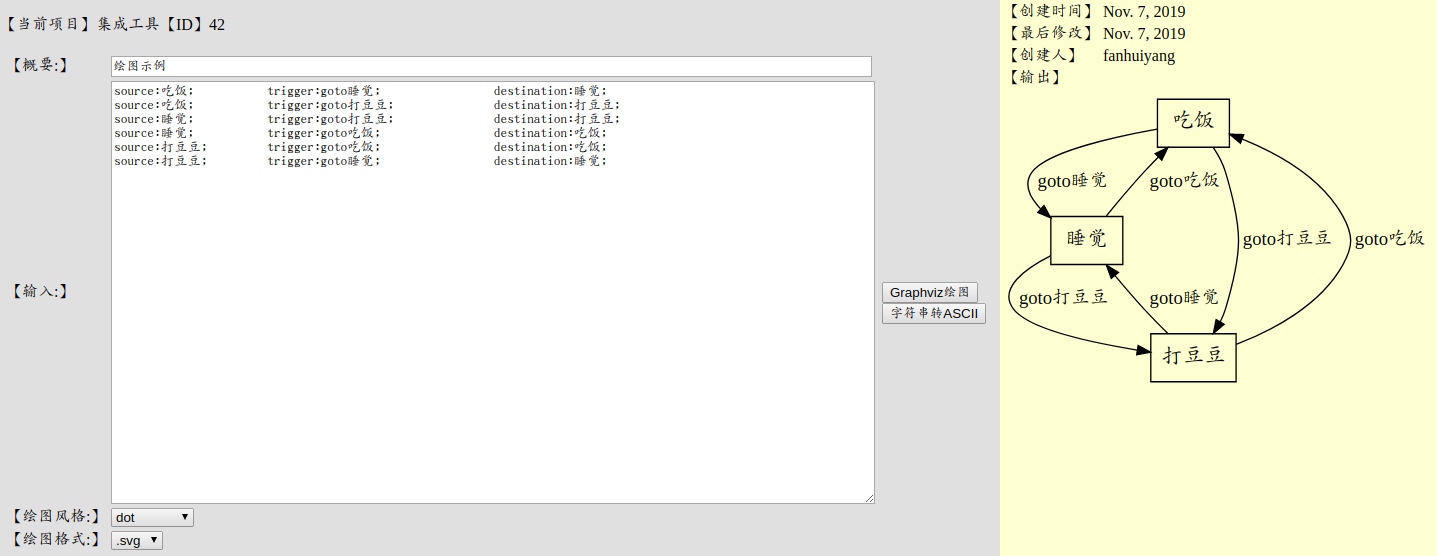
輸入內容:
source:吃飯; trigger:goto睡覺; destination:睡覺; source:吃飯; trigger:goto打豆豆; destination:打豆豆; source:睡覺; trigger:goto打豆豆; destination:打豆豆; source:睡覺; trigger:goto吃飯; destination:吃飯; source:打豆豆; trigger:goto吃飯; destination:吃飯; source:打豆豆; trigger:goto睡覺; destination:睡覺;
輸出:

繪圖的實現步驟如下:
1.後台接收輸入表單中的文本內容,並根據換行符,將一行內容作為一個字元串;
2.循環判斷每個字元串是否滿足如下格式:
source:XXX; trigger:YYY; destination:ZZZ;
若滿足,則在dot語言中生成XXX,ZZZ兩個節點,以及一條XXX指向ZZZ的邊;節點資訊記錄到node_database中,邊資訊記錄到edge_string中;
3.所有字元串遍歷完成後,根據node_database和edge_string中記錄的資訊生成用於graphviz繪圖的臨時dot語言腳本;
4.在後台調用步驟3生成的dot語言腳本進行繪圖,生成圖形後並將圖形顯示在web介面上,隨後刪除dot語言腳本;
接收輸入表單數據,並生成dot語言進行繪圖的python程式碼如下所示:
1 def tools_draw_pygraphviz(request, model_instance): 2 prefix = '''digraph graphviz { 3 graph [ 4 //rankdir = "LR" 5 //splines=polyline 6 overlap=false 7 bgcolor="#FFFFCE" 8 ]; 9 10 node [ 11 fontsize = "16" 12 shape = "ellipse" 13 ]; 14 15 edge [ 16 ]; 17 ''' 18 edge_string = '' 19 space4 = ' ' 20 space8 = space4 + space4 21 node_database = {} 22 node_database['created'] = [] 23 tmpline = "" 24 for tmpchar in model_instance.detail: 25 if tmpchar == 'n': 26 m = re.search(r'source: *([^s].*[^s]) *;.*trigger: *([^s].*[^s]) *;.*destination: *([^s].*[^s]) *;(.*)', tmpline) 27 if m: 28 if m.group(1) not in node_database['created']: 29 node_database['created'].append(m.group(1)) 30 if m.group(3) not in node_database['created']: 31 node_database['created'].append(m.group(3)) 32 n = re.search(r'(color *= *"[^"]*")', m.group(4)) 33 if n: 34 color_string = ', '+n.group(1) 35 else: 36 color_string = '' 37 edge_string = edge_string + """ + m.group(1) + """ + "->" + """ + m.group(3) + """ + "[ label = "" + m.group(2) + """ +color_string+ "]n" + space4 38 tmpline = "" 39 else: 40 tmpline = tmpline + tmpchar 41 42 m = re.search(r'source: *([^s].*[^s]) *;.*trigger: *([^s].*[^s]) *;.*destination: *([^s].*[^s]) *;(.*)', tmpline) 43 if m: 44 if m.group(1) not in node_database['created']: 45 node_database['created'].append(m.group(1)) 46 if m.group(3) not in node_database['created']: 47 node_database['created'].append(m.group(3)) 48 n = re.search(r'(color *= *"[^"]*")', m.group(4)) 49 if n: 50 color_string = ', '+n.group(1) 51 else: 52 color_string = '' 53 edge_string = edge_string + """ + m.group(1) + """ + "->" + """ + m.group(3) + """ + "[ label = "" + m.group(2) + """ +color_string+ "]n" + space4 54 for tmp_node in node_database['created']: 55 tmp_node_string = space4 + """ + tmp_node + "" [n" + space8 + "label = "" + tmp_node + ""n" + space8 + "shape = "record"n" + space4 + "];n" 56 prefix = prefix + tmp_node_string 57 image_path = '/root/virenv_python3/django_for_study/mysite/polls/static/polls/images/' 58 output_file = image_path + 'tools_graphviz_' + str(model_instance.id) + model_instance.graphviz_format 59 dot_file = image_path + 'dot_' + str(model_instance.id) 60 with open(dot_file,'w+') as f_output: 61 f_output.write(prefix + space4 + edge_string + "n}") 62 if os.path.exists(output_file): 63 os.remove(output_file) 64 dot_cmd = model_instance.graphviz_style+' -T'+ model_instance.graphviz_format[1:] + ' ' + dot_file +' -o ' + output_file 65 os.system(dot_cmd) 66 os.remove(dot_file)
由上述程式碼python解析表單輸入自動生成的dot腳本如下所示:
digraph graphviz { graph [ //rankdir = "LR" //splines=polyline overlap=false bgcolor="#FFFFCE" ]; node [ fontsize = "16" shape = "ellipse" ]; edge [ ]; "吃飯" [ label = "吃飯" shape = "record" ]; "睡覺" [ label = "睡覺" shape = "record" ]; "打豆豆" [ label = "打豆豆" shape = "record" ]; "吃飯"->"睡覺"[ label = "goto睡覺"] "吃飯"->"打豆豆"[ label = "goto打豆豆"] "睡覺"->"打豆豆"[ label = "goto打豆豆"] "睡覺"->"吃飯"[ label = "goto吃飯"] "打豆豆"->"吃飯"[ label = "goto吃飯"] "打豆豆"->"睡覺"[ label = "goto睡覺"] }
下圖是實際工作中所涉及FC協議的埠狀態機跳轉流程:
其中紅色表示埠開工主流程,藍色表示埠停工流程;比程式碼直觀許多。

該繪圖工具具有以下優勢:
1.自動布局自動繪圖,避免了手動放置形狀、填充文本、繪製線條、拖動箭頭指向關係、調整文本格式、調整布局等一系列繁瑣的操作;
添加新的狀態跳轉描述時,只需要點擊按鈕一鍵重新繪圖即可,不需要關心之前的布局怎樣;
2. 程式碼中的狀態轉換描述可以輕易的經腳本進行格式化處理為如下格式:
source:XXX; trigger:YYY; destination:ZZZ;
隨後將格式化處理後的文本貼入網頁就可以一鍵繪圖;對於一些複雜的狀態機(比如20+個狀態,20+個激勵)手動繪製可能需要兩天左右,利用腳本預處理並利用網頁生成僅需要幾分鐘;
3.只要能訪問網路就隨時隨地可用,不需要安裝visio等繪圖工具,節約繪圖前等待軟體啟動的時間;
4.支援設置顏色,將主要流程以顏色區分顯示,便於理解;如上圖中的埠啟動和停止流程分別以紅色和藍色顯示。
5.純文本的輸入便於批量修改,比如LLL, MMM, NNN等多個狀態下都收到YYY激勵,我們需要加上激勵編號將YYY修改為YYY(05),在visio等繪圖工具中需要手動修改多個狀態下YYY激勵對應的線條上的描述;使用web繪圖工具只需要將輸入中的YYY全文替換成YYY(05), 點擊按鈕重新繪圖即可。