SLS案例中心
- 2020 年 8 月 25 日
- 筆記
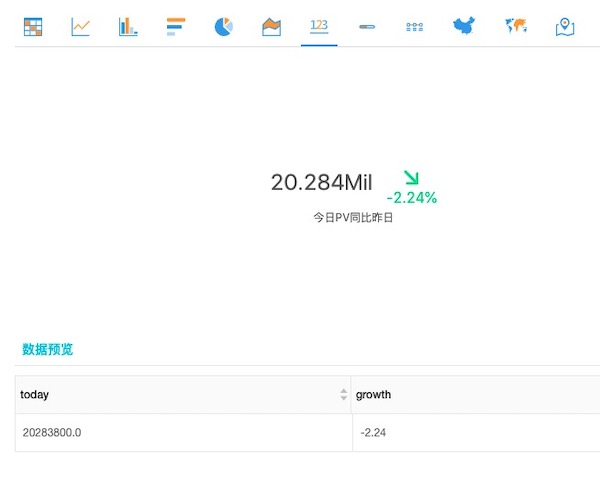
今日PV
nginx日誌查看今日的PV和昨日的對比,先通過count函數計算總的pv,再用compare函數得出今日的pv和昨日的同比。
通過單值圖進行展示,顯示值為20.381Mil,對比值為-2%
 1 *   |
 2 select
 3     diff [1] as  today,
 4     round((diff  [3]  -1.0)  *  100, 2)  as  growth
 5 FROM
 6     (
 7              SELECT
 8                    compare(pv, 86400)  as  diff
 9              FROM
10                   (
11                         SELECT
12                               COUNT( 1 )  AS pv
13                         FROM
14                                log
15                   )
16     )
pv、uv展示
展示tomcat訪問的pv、uv隨時間變化的曲線
使用time_series 函數根據日誌時間做兩分鐘對齊,然後對時間聚合計算COUNT即訪問數量,使用approx_distinct(remote_addr) 計算 remote_addr去重之後的數量,然後跟據時間排序展示。
圖中x軸為時間,y軸表示數量,兩條線分別是uv、pv的情況。
 1 * |
 2 select
 3     time_series(__time__,'2m','%H:%i','0')  as  time,
 4     COUNT(1)  as  pv,
 5     approx_distinct (remote_addr)   as   uv
 6 GROUP  BY
 7      time
 8 ORDER   BY
 9     time
10 LIMIT
11     1000

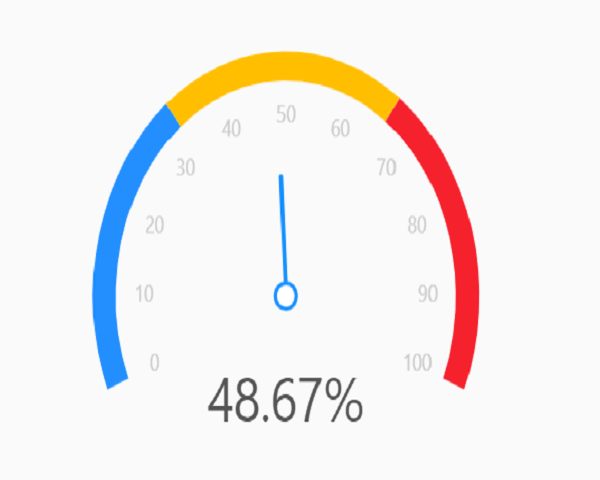
tomcat錯誤請求佔比
先在sql內部獲取到請求status超過400的錯誤請求數量,以及總的請求數量,然後再外部計算比值,
展示時使用單值圖中的刻度盤,單位改為 %
 1 * |
 2 select
 3   round((errorCount * 100.0 / totalCount), 2) as errorRatio
 4 from
 5   (
 6     select
 7       sum(
 8         case
 9           when status >= 400 then 1
10           else 0
11         end
12       ) as errorCount,
13       count(1) as totalCount
14     from
15       log
16   )
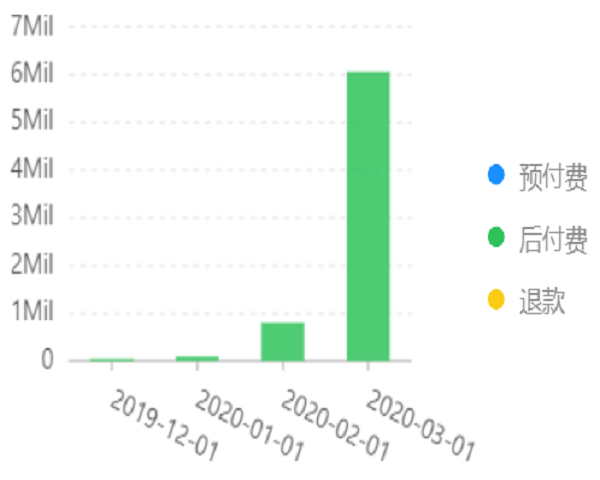
付費類型
展示付費類型各自產生的費用,
按時間月和計費方式聚合計算總費用,並按照時間排序,再使用case when為付費方式起中文別名進行展示。
圖中使用流圖的柱狀圖展示,聚合列是付費類型,x軸時間,y軸費用。
[ date_format(timestamp , format ) 含義:把timestamp 轉化成以 format 形式表示 ]
 1 source  :bill  |
 2 select
 3     date_format(day, '%Y-%m-%d')  as  day,
 4     total, case
 5         when  Item  =  'PayAsYouGoBill'  then  '後付費'
 6         when  Item  =  'SubscriptionOrder'  then  '預付費'
 7         when  Item  =  'Refund'  then  '退款'
 8         when  Item  =  'Adjustment'  then  '調賬'
 9         else   Item
10     end  as  "付費類型"
11 from(
12         select
13              date_trunc('month' , __time__)  as  day,
14              sum(PretaxAmount)  as  total,
15              Item
16         from
17              log
18         group  by
19              day,
20              Item
21        order  by
22              day
23     )
24 limit
25     10000
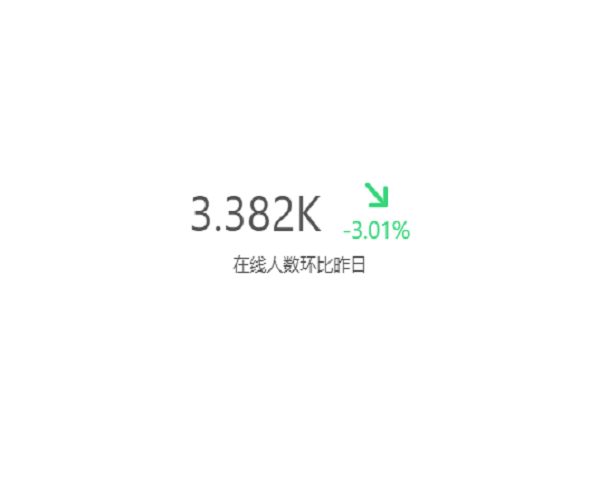
在線人數
在線人數,內層通過approx_distinct函數獲取client_ip唯一數,然後通過compare獲取昨天的uv以及昨天的比值。
結果使用單值圖中的同比環比圖展示,可以同時看到當時的uv及與昨天的比值。
 1 *  |
 2 select
 3     diff [1],
 4     diff [2],
 5     round (diff  [3]  - 1,4)  *  100
 6 from
 7     (
 8         select
 9             compare(uv, 86400)  as  diff
10             from
11                 (
12                     select
13                         approx_distinct()  as  uv
14                     from
15                         log
16                 )
17     )
統計具體時間 request_method
用date_trunc 把時間戳轉化為時間格式,用map_agg 把時間做為key, 把request_method 作為value, 返回的是json格式
1 |
2 select
3   map_agg(date_trunc('minute', __time__), request_method) as request_method
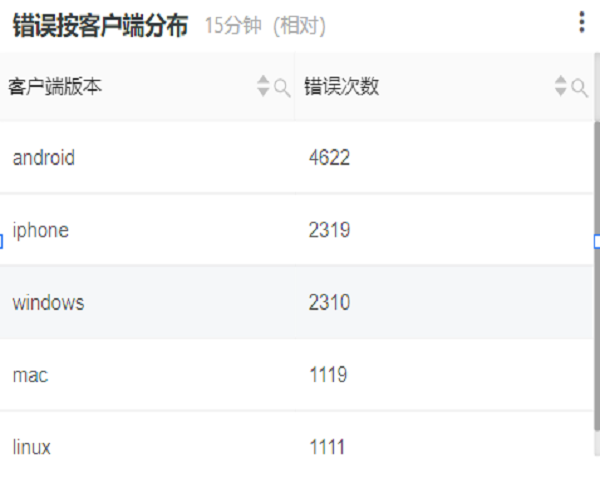
請求錯誤按客戶端分布
先通過return_code 進行過濾,return_code大於400表示請求錯誤。然後通過user_agent 聚合計算請求數,按照請求數量倒敘排列,取前10個。
 1 return_code > 400 |
 2 select
 3   user_agent as "客戶端版本",
 4   count(*) as "錯誤次數"
 5 group by
 6   user_agent
 7 order by
 8   "錯誤次數" desc
 9 limit
10   10
。。。後續繼續總結,按每一個可視化來分布


