動態追蹤技術之SystemTap
SystemTap
SystemTap是一個深入檢查Linux系統活動的工具,使用該工具編寫一些簡單的程式碼就可以輕鬆的提取應用或內核的運行數據,以診斷複雜的性能或者功能問題。有了它,開發者不再需要重編譯、安裝新內核、重啟動等煩人的步驟,應用程式同理。
配合火焰圖的可視化,對程式的性能分析極其有利。
原理
SystemTap 基本思想是命名事件,並為它們提供處理程式。每當發生指定的事件時,內核都會將處理程式視為子常式運行,然後繼續運行。有一系列的事件,例如進入或退出函數,計時器到期或整個SystemTap會話的開始和停止。處理程式是一系列腳本語言語句,用於指定事件發生時要完成的工作。這項工作通常包含從事件上下文中提取數據,將其存儲到內部變數或列印結果。
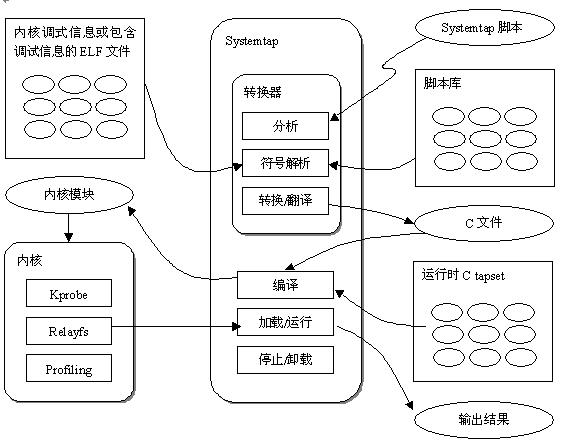
SystemTap 的工作原理是將腳本翻譯成C語言,執行C編譯器創建一個內核模組。當模組被載入後,通過掛載到內核來激活所有的探測事件。然後,當事件發生再任何處理器上時,編譯後的處理程式就運行,最終,SystemTap繪畫停止,Hook取消,內核模組被移除,整個過程由命令行程式stap驅動。
原理圖如下:
安裝
需要內核級別的支援,依賴了三個rpm下載鏈接,
- kernel-debuginfo-common
- kernel-debuginfo
- kernel-devel
這三個包的版本必須匹配當前內核的版本,比如我自己的內核版本是 3.10.0-327, 那麼以上三個包版本都必須保持一致。
安裝 SystemTap:
$ yum install systemtap
測試是否成功安裝:
$ stap -ve ‘probe begin{printf(“Hello, World\n”); exit();}’
正常的話會輸出 Hello, World,但是不出意外會出現版本不一致的情況:
ERROR: module version mismatch (#1 SMP Fri Nov 20 11:12:42 CST 2015 vs #1 SMP Thu Nov 19 22:10:57 UTC 2015), release 3.10.0-327.el7.x86_64
出現這個的情況是版本相同但是打包事件不相同的情況,修改這個時間和uname -a 中的時間保持一致。
$ rpm -ql kernel-devel | xargs grep UTS_VERSION 2>/dev/null

/usr/src/kernels/3.10.0-327.el7.x86_64/include/generated/compile.h:#define UTS_VERSION "#1 SMP Fri Nov 20 11:12:42 CST 2015"
再次運行那個hello測試,出現快取的錯誤,刪除快取文件
- /root/.systemtap/cache/34/stap_34443d4ad1fe1d37c0352b7b8c691aee_975.c
- /root/.systemtap/cache/34/stap_34443d4ad1fe1d37c0352b7b8c691aee_975.ko
追蹤
最簡單的探測類型就是跟蹤事件。Systemtap支援許多內置事件,所有的事件家族見 tapset
可以探測的的常用事件:
- begin, systemtap 會話開始
- end, systemtap 會話結束
- kernel.function(“sys_xxx”), 系統調用xx的入口
- kernel.function(“sys_xxx”).return, 系統調用xx的返回
- timer.ms(300), 每300毫秒的定時器
- timer.profile, 每個CPU上周期觸發的定時器
- process(“a.out”).function(“foo*”), a.out 中函數名前綴為foo的函數資訊
- process(“a.out”).statement(“*@main.c:200”), a.out中文件main.c 200行處的狀態
常用的可列印值(具體見 tapset):
- tid(), 當前執行緒id
- pid(), 當前進程id
- uid(), 當前用戶id
- execname(), 當前進程名稱
- cpu(), 當前cpu編號
- gettimeofday_s(), 秒時間戳
- get_cycles(), 硬體周期計數器快照
- pp(), 探測點事件名稱
- ppfunc(), 探測點觸發的函數名稱
$$var, 上下文中存在$var,可以使用該變數- print_backtrace(), 列印內核棧
- print_ubacktrace(), 列印用戶空間棧
SystemTap 腳本
stap 腳本簡單,語法類似C;
- 注釋
# fuck
// fuck
/* fuck */
- 函數
function foo() {
    // exit(); // 退出 systemtap 會話
}
- 基本的 if/else/while/for 控制結構
function if_expr() {
    i = 0
    if (i == 1)
        printf("[if] i = %d\n", i);
    else
        printf("[else] i = %d\n", i);
}

function while_expr() {
    i = 0;
    while (i != 2)
        printf("[while] i = %d\n", i++);
}

function for_expr() {
    for (i = 0; i < 2; i++)
        printf("[for] i = %d\n", i);
}
- 字元串比較,拼接,轉換
function str() {
    uid = uid();
    s_uid = sprint(uid);
    f_uid = "fuck" . s_uid
    printf("uid: %d-%s-%s\n", uid, s_uid); // uid: 0-0-fuck0

    // exit();
}
- 元組
global t; // 聲明元組
global tpl[400]; // 聲明一個400容量的元組

t["fuck"]++;  // t["fuck"] 初始值默認為0, ++ 變成 1
t["fuck"] = 4396; // 賦值為4396

tpl["fuck", pid()]++; // 兩個元素
tpl["shit", tid()]++;
- 聚集統計
// 包含4個維度 @count @avg @min @max
global t;

t["fuck", tid()] <<< 1
t["fuck", pid()] <<< 1
t[execname(), tid()] <<< 1
t["fuck", 5487] <<< 2
t["fuck", 5487] <<< 3
t["fuck", 5487] <<< 1

具體結構如下:
t["fuck",5487] @count=3 @min=1 @max=3 @sum=6 @avg=2
t["fuck",26060] @count=2 @min=1 @max=1 @sum=2 @avg=1
t["stapio",26060] @count=1 @min=1 @max=1 @sum=1 @avg=1


// 遍歷(升序), 限制5次循環
foreach([key, value] in t+ limit 5)
    printf("%s: %d\n", key, value)

// 結果
stapio: 2571
fuck: 2571
fuck: 5487
應用
stap 常用命令
Usage: stap [options] FILE                    Run script in file.
   or: stap [options] -e SCRIPT               Run given script.
   or: stap [options] -l PROBE                List matching probes.
   or: stap [options] -L PROBE                List matching probes and local variables.
[options]
   -T TIME    terminate the script after TIME seconds
除了直接執行腳本文件外,另外一個比較有用的功能 -L -l 現象,列出可探測點及局部變數
- 列出程式中的可探測點
// 截取部分~
[root@localhost stp]# stap -l 'process("/tmp/limlog/build/tests/LogTest").function("*")'
process("/tmp/limlog/build/tests/LogTest").function("write@/tmp/limlog/limlog/Log.cpp:107")
process("/tmp/limlog/build/tests/LogTest").function("~LimLog@/tmp/limlog/limlog/Log.cpp:213")
process("/tmp/limlog/build/tests/LogTest").function("~LogLine@/tmp/limlog/limlog/Log.cpp:341")
process("/tmp/limlog/build/tests/LogTest").function("~LogSink@/tmp/limlog/limlog/Log.cpp:59")
process("/tmp/limlog/build/tests/LogTest").function("~_Impl@/usr/include/c++/4.8.2/thread:107")
process("/tmp/limlog/build/tests/LogTest").function("~_Impl_base@/usr/include/c++/4.8.2/thread:97")
- 列出程式中的可探測點及局部變數(前綴為
$)
[root@localhost stp]# stap -L 'process("/tmp/limlog/build/tests/LogTest").function("*")'
process("/tmp/limlog/build/tests/LogTest").function("id@/usr/include/c++/4.8.2/thread:73") $this:class id* const
process("/tmp/limlog/build/tests/LogTest").function("incConsumable@/tmp/limlog/limlog/Log.cpp:313") $this:class LimLog* const $n:uint32_t
process("/tmp/limlog/build/tests/LogTest").function("incConsumablePos@/tmp/limlog/limlog/Log.cpp:135") $this:class BlockingBuffer* const $n:uint32_t
process("/tmp/limlog/build/tests/LogTest").function("incConsumablePos@/tmp/limlog/limlog/Log.cpp:460") $n:uint32_t
process("/tmp/limlog/build/tests/LogTest").function("insert@/usr/include/c++/4.8.2/bits/basic_string.h:1319") $__c:char $__n:size_type $__pos:size_type $this:class basic_string<char, std::char_traits<char>, std::allocator<char> >* const
有這個功能,我們就可以看到函數所在源文件中的位置及可以根據的局部變數。
systemtap 腳本
探針事件的關鍵字是 probe, 由 probe 引出需要跟蹤的事件
// 腳本執行後顯示 === begin ===
probe begin {
    printf("=== begin ===\n");
}
根據上述的可跟蹤的事件
- begin/end, 分別是systemtap會話的起始和結尾
[root@localhost stp]# cat foo.stp
#!/usr/bin/env stap

probe begin {
    printf("=== begin ===\n");
}

probe end {
    printf("=== end ===\n");
}

// 執行腳本
[root@localhost stp]# stap foo.stp -T 1
=== begin ===
=== end ===
- kernel.function(“sys_xxx”), 系統調用
// 調用open系統調用
[root@localhost stp]# cat foo.stp
#!/usr/bin/env stap

probe kernel.function("sys_open").call {
    printf("%s call %s\n", execname(), ppfunc());
}

// open系統調用返回
probe kernel.function("sys_open").call {
    printf("%s call %s over\n", execname(), ppfunc());
}

[root@localhost stp]# stap foo.stp -T 1
sh call SyS_open
sh call SyS_open over
sh call SyS_open
sh call SyS_open over
sh call SyS_open
sh call SyS_open over
- 定時器調用
[root@localhost stp]# cat foo.stp
#!/usr/bin/env stap

// 定時調用函數
probe timer.ms(500) {
    printf("now: %d\n", gettimeofday_s());
}

[root@localhost stp]# stap foo.stp -T 3
now: 1593141081
now: 1593141081
now: 1593141082
now: 1593141082
now: 1593141083
- 定時cpu取樣
// 取自春哥的sample-bt示例程式碼,定時調用棧取樣
global bts;

probe timer.profile {
    if (pid() == 5291)
        bts[backtrace(), ubacktrace()] <<< 1
}

probe timer.s(10) {
    foreach([k, u] in bts-) {
        print_stack(k);
        print_ustack(u);
        printf("\\t%d\\n", @count(bts[k, u]));
    }
    exit();
}

// 結果為16進位地址,截取一部分數據,這部分數據需要進一步加工統計
[root@localhost stp]# stap foo.stp
 0xffffffff810d6244 : 0xffffffff810d6244
 0xffffffff810475fa : 0xffffffff810475fa
\t1\n 0xffffffffa0139f0d : 0xffffffffa0139f0d [xfs]
- 指定程式中的函數事件(需要運行程式)
// 列印程式 LogTest 所有執行的函數
[root@localhost stp]# cat foo.stp
probe process("/tmp/limlog/build/tests/LogTest").function("*") {
    printf("function: %s\n", ppfunc());
}

// 庫函數也載入進來了
[root@localhost stp]# stap foo.stp
function: offsetOfPos
function: __distance<char*>
function: operator+<long int, std::ratio<1l, 1000000000l>, long int, std::ratio<1l, 1000000l> >
function: operator<<
- 指定程式指定文件中的可追蹤事件
//列印 LogTest 程式屬於 Log.cpp 中的函數資訊
[root@localhost stp]# cat foo.stp
probe process("/tmp/limlog/build/tests/LogTest").statement("*@Log.cpp") {
    printf("function: %s\n", ppfunc());
}

// 過濾了庫函數,只留下Log.cpp中的函數執行
[root@localhost stp]# stap foo.stp
function: singleton
function: produce
function: produce
function: produce
function: produce
function: used
function: used
function: consumable
function: operator<<
function: ~LogLine
- 上下文變數
// 獲取上下文變數
[root@localhost stp]# stap -L 'process("/tmp/limlog/build/tests/LogTest").statement("*@Log.cpp")'
process("/tmp/limlog/build/tests/LogTest").statement("LimLog@/tmp/limlog/limlog/Log.cpp:185") $this:class LimLog* const
process("/tmp/limlog/build/tests/LogTest").statement("LogLine@/tmp/limlog/limlog/Log.cpp:336") $this:class LogLine* const $level:enum LogLevel $loc:struct LogLoc const&
process("/tmp/limlog/build/tests/LogTest").statement("append@/tmp/limlog/limlog/Log.cpp:346") $this:class LogLine* const $data:char const* $n:size_t
process("/tmp/limlog/build/tests/LogTest").statement("consumable@/tmp/limlog/limlog/Log.cpp:140") $this:class BlockingBuffer const* const
process("/tmp/limlog/build/tests/LogTest").statement("consume@/tmp/limlog/limlog/Log.cpp:146") $this:class BlockingBuffer* const $to:char* $n:uint32_t

// 這裡我們追蹤 consume 函數中的兩個參數
[root@localhost stp]# cat foo.stp
probe process("/tmp/limlog/build/tests/LogTest").function("consume") {
    printf("func = %s, $var(n) = %d, $var(to) = %p\n", ppfunc(), $n, $to);
}

[root@localhost stp]# stap foo.stp
func = consume, $var(n) = 406, $var(to) = 0x7f902a94d010
func = consume, $var(n) = 203, $var(to) = 0x7f902a94d1a6
func = consume, $var(n) = 790, $var(to) = 0x7f902a94d010
func = consume, $var(n) = 3319, $var(to) = 0x7f902a94d326
func = consume, $var(n) = 4235, $var(to) = 0x7f902a94d010
func = consume, $var(n) = 4235, $var(to) = 0x7f902a94d010
func = consume, $var(n) = 2326, $var(to) = 0x7f902a94d010
func = consume, $var(n) = 8470, $var(to) = 0x7f902a94d010
示例分析
在探測點被執行時列印這種簡單的用法外,還能進一步做一些其它的事情。
- 統計某一時間段內運行次數top k的函數
[root@localhost stp]# cat foo.stp
#!/usr/bin/env stap

global top_funcs;

probe begin {
    printf("=== begin ===\n");
}

probe process("/tmp/limlog/build/tests/LogTest").statement("*@Log.cpp") {
    top_funcs[ppfunc()]++;
}

probe end {
    foreach(func in top_funcs- limit 10)
        printf("%s: %d\n", func, top_funcs[func]);

    printf("=== end ===\n");
}

// LogTest 在3秒內執行最多的10個函數及次數
[root@localhost stp]# stap foo.stp -T 3
=== begin ===
produce: 1152
append: 720
singleton: 646
operator<<: 608
produceLog: 576
used: 576
consumable: 359
incConsumablePos: 64
getLogLevel: 32
LogLine: 32
=== end ===
- 統計系統調用某一時間段內被調用最頻繁的k個程式及次數
[root@localhost stp]# cat foo.stp
#!/usr/bin/env stap

global top_exec;

probe begin {
    printf("=== begin ===\n");
}

probe kernel.function("sys_write") {
    top_exec[execname()]++;
}

probe end {
    foreach(exec in top_exec- limit 10)
        printf("%s: %d\n", exec, top_exec[exec]);

    printf("=== end ===\n");
}

[root@localhost stp]# stap foo.stp -T 3
=== begin ===
qemu-kvm: 2948
sync: 2174
virsh: 673
libvirtd: 305
route: 28
grep: 21
ps: 21
ssh: 16
python: 16
nginx: 16
=== end ===
- 列印函數調用層次(用戶程式)
調用層次需要藉助 thread_indent 來列印合適的縮進,另外需要設置函數入口(call)和返回(return)的探測點。函數命名不足以使用function通配符來匹配,而 statement 雖然可以匹配我們想要的結果(過濾第三方函數),但是不支援 call 和return。雖然有一個比較傻但是的確可行的方式是,在腳本裡面手動寫入這些函數。
// 先取出需要關注的函數名稱
stap -L 'process("/tmp/limlog/build/tests/LogTest").statement("*@*.cpp")' |  sed 's/.*statement(\"\(.*\)@.*\".*/\1/g'  | sort -u
腳本如下:
#!/usr/bin/env stap

global f;

function init() {
    f["append"] = 1;
    f["benchmark"] = 1;
    f["consumable"] = 1;
    f["consume"] = 1;
    f["date"] = 1;
    f["datetime"] = 1;
    f["formatTimestamp"] = 1;
    f["getLogLevel"] = 1;
    f["gettid"] = 1;
    f["i16toa"] = 1;
    f["i2a"] = 1;
    f["i32toa"] = 1;
    f["i64toa"] = 1;
    f["incConsumable"] = 1;
    f["incConsumablePos"] = 1;
    f["LimLog"] = 1;
    f["~LimLog"] = 1;
    f["listStatistic"] = 1;
    f["log_10_diff_element_len"] = 1;
    f["log_10_diff_element_str"] = 1;
    f["log_10_diff_element_x1"] = 1;
    f["log_16_same_element_x6"] = 1;
    f["log_1_same_element_x6"] = 1;
    f["log_4_same_element_x6"] = 1;
    f["LogLine"] = 1;
    f["~LogLine"] = 1;
    f["LogSink"] = 1;
    f["~LogSink"] = 1;
    f["main"] = 1;
    f["now"] = 1;
    f["operator<<"] = 1;
    f["produce"] = 1;
    f["produceLog"] = 1;
    f["rollFile"] = 1;
    f["setLogFile"] = 1;
    f["setLogLevel"] = 1;
    f["setRollSize"] = 1;
    f["singleton"] = 1;
    f["sink"] = 1;
    f["sinkThreadFunc"] = 1;
    f["stringifyLogLevel"] = 1;
    f["test_blocking_buffer"] = 1;
    f["test_itoa"] = 1;
    f["test_timestamp"] = 1;
    f["time"] = 1;
    f["u16toa"] = 1;
    f["u2a"] = 1;
    f["u32toa"] = 1;
    f["u64toa"] = 1;
    f["used"] = 1;
    f["write"] = 1;
}

probe begin {
    printf("=== begin ===\n");
    init();
}

probe process("/tmp/limlog/build/tests/LogTest").function("*").call {
    fn = ppfunc()
    if (f[fn] == 1)
        printf("%s -> %s\n", thread_indent(4), ppfunc());
}

probe process("/tmp/limlog/build/tests/LogTest").function("*").return {
    fn = ppfunc()
    if (f[fn] == 1)
        printf("%s <- %s\n", thread_indent(-4), ppfunc());
}

probe end {
    printf("=== end ===\n");
}
函數的部分調用樹如下所示:
=== begin ===
     0 LogTest(25381):    -> main
   101 LogTest(25381):        -> setLogFile
   111 LogTest(25381):            -> singleton
   121 LogTest(25381):                -> LimLog
   129 LogTest(25381):                    -> LogSink
   270 LogTest(25381):                        -> now
   282 LogTest(25381):                        <- now
   288 LogTest(25381):                        -> date
   296 LogTest(25381):                            -> datetime
   453 LogTest(25381):                            <- datetime
   472 LogTest(25381):                        <- date
   478 LogTest(25381):                    <- LogSink
   576 LogTest(25381):                <- LimLog
   586 LogTest(25381):            <- singleton
   603 LogTest(25381):            -> rollFile
     0 LogTest(25382):    -> sinkThreadFunc
   650 LogTest(25381):            <- rollFile
   ···
樹狀調用可以很清楚的展示出來程式的執行邏輯,甚至可以看到多執行緒的處理:sinkThreadFunc 和 rollFile 之間的跨度。
- 開源庫對systemtap的集成
像libguestfs 和libvirt都有支援,恰好工作環境這兩個庫也經常有一些難以排查的問題出現
觀察 libguestfs 的啟動過程及耗時,libvirt 支援function 和mark(有5個,大致邏輯上的埋點)
#! /usr/bin/env stap

global start_time, prev;

function display_time () {
  now = gettimeofday_us ()
  delta = (prev > 0 ) ? now - prev : 0
  printf ("%18d (+%10d): ", now - start_time, delta)
  prev = now
}

probe begin {
  start_time = gettimeofday_us ()
  prev = 0
  printf ("%-18s (+%10s): %s\n", "# time_usec",
          "delta usec", "event")
}

probe process("/usr/lib*/libguestfs.so.0*").function("*")
{
  display_time()
  printf ("%s\n", ppfunc())
}
列印的結果,如果使用 libguestfs-test-tools 執行失敗,可以根據產生的函數進入源程式碼中進行排查,縮小排查的範圍
[root@localhost stp]# stap libguestfs.stp
# time_usec        (+delta usec): event
           1880754 (+         0): _init
           1880765 (+        11): frame_dummy
           1880768 (+         3): register_tm_clones
           1880772 (+         4): compile_regexp_re_hostname_port
           1880804 (+        32): init_libguestfs
           1881074 (+       270): guestfs_int_init_direct_backend
           1881079 (+         5): guestfs_int_register_backend
           1881083 (+         4): guestfs_int_init_libvirt_backend
           1881085 (+         2): guestfs_int_register_backend
           1881088 (+         3): guestfs_int_init_uml_backend
           ···
而 libvirt 中 example/ 目錄中就有包含一些關於 systemtap 的腳本文件。
火焰圖的生成
在函數調用樹之上更進一步,加入樣本的頻率得到svg格式的火焰圖,用戶可以點擊不同的圖層來查看更詳細的資訊。
火焰圖工具為brendangregg開發的開源項目FlameGraph,配合春哥寫的systemtap工具,用一段簡單的shell腳本如下,可以得到一張svg的圖片
#!/bin/bash

# 火焰圖工具的路徑
FlameGraph_PATH="/FlameGraph"

# 春哥的棧收集工具
OR_Stap_PATH="/home/zxh/dev/openresty-systemtap-toolkit"

if [ $# != 1 ] ; then
        echo "Usage: sh $0 PID"
        echo "  e.g.: sh $0 4396"
        exit 1;
fi

${OR_Stap_PATH}/sample-bt -p $1 -t 180 -u > /tmp/bt-sample
${FlameGraph_PATH}/stackcollapse-stap.pl /tmp/bt-sample > /tmp/bt_stap.out
${FlameGraph_PATH}/flamegraph.pl /tmp/bt_stap.out > backtrace.svg

rm -rf /tmp/bt-sample
rm -rf /tmp/bt_stap.out
CPU定時取樣,根據取樣生成的 backtrace.svg 如下,橫軸為CPU佔用的時間比例,縱軸為函數調用的深度:
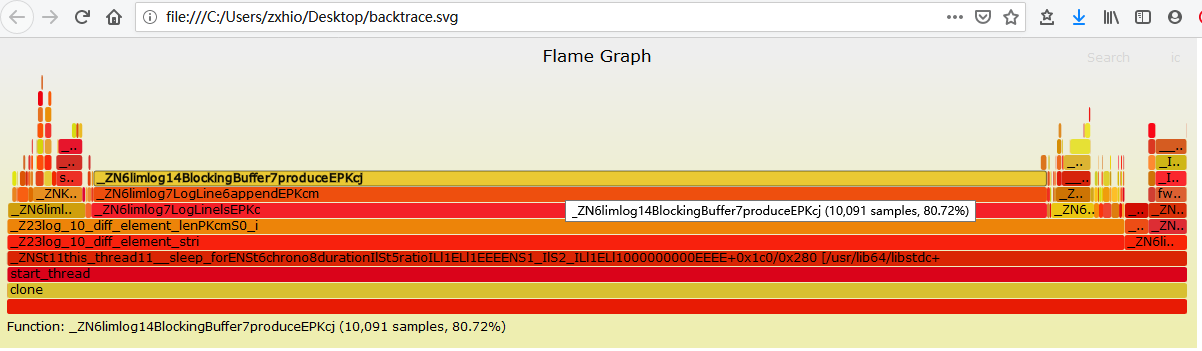
這是一個日誌庫的benchmark,而主要耗時也在阻塞隊列的消費上,符合預期。
rpm 鏈接
- //mirrors.ocf.berkeley.edu/centos-debuginfo/7/x86_64/kernel-debuginfo-common-x86_64-3.10.0-327.el7.x86_64.rpm
- //mirrors.ocf.berkeley.edu/centos-debuginfo/7/x86_64/kernel-debuginfo-3.10.0-327.el7.x86_64.rpm
- ftp://ftp.pbone.net/mirror/ftp.scientificlinux.org/linux/scientific/7.0/x86_64/updates/security/kernel-devel-3.10.0-327.el7.x86_64.rpm
參考
- systemtap 原理圖, //www.ibm.com/developerworks/cn/linux/l-cn-systemtap3/index.html?ca=drs-
- systemtap 官方教程(推薦),//sourceware.org/systemtap/tutorial/1_Introduction.html
- systemtap 內置函數庫 tapset,//sourceware.org/systemtap/tapsets/index.html
- 春哥的一系列stap工具,//github.com/openresty/openresty-systemtap-toolkit
- 火焰圖工具,//github.com/brendangregg/FlameGraph


