CVPR2018關鍵字分析生成詞雲圖與查找
今日目標:爬取CVPR2018論文,進行分析總結出提到最多的關鍵字,生成wordCloud詞雲圖展示,並且設置點擊後出現對應的論文以及鏈接
對任務進行分解:
①爬取CVPR2018的標題,簡介,關鍵字,論文鏈接
②將爬取的信息生成wordCloud詞雲圖展示
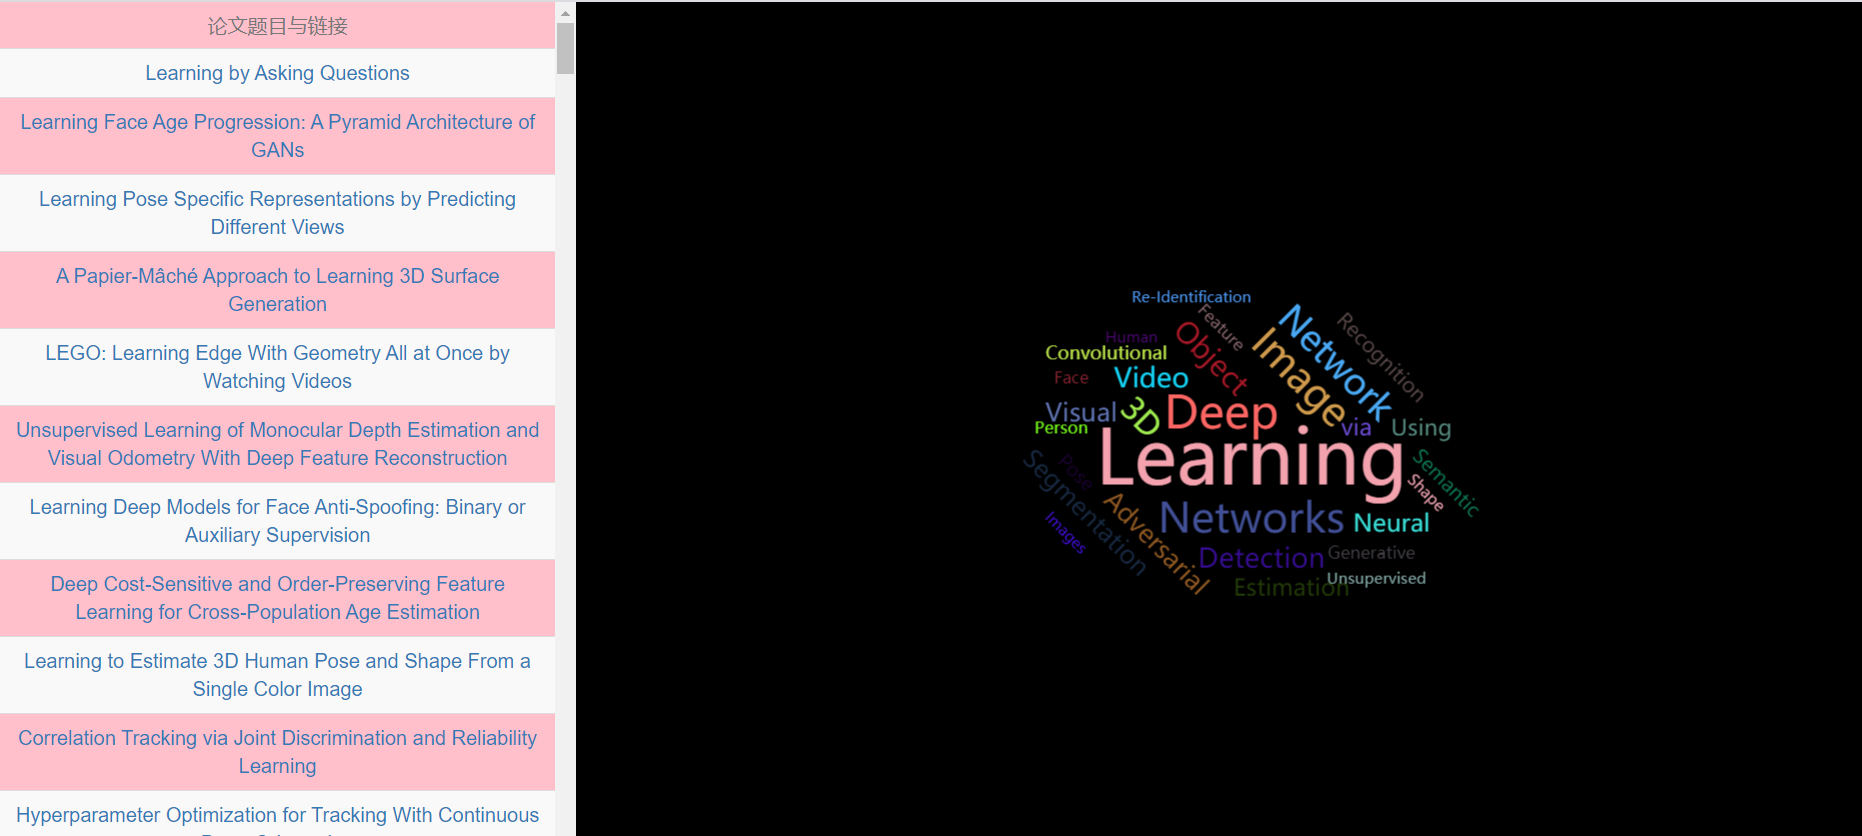
③設置點擊事件,展示對應關鍵字的論文以及鏈接
一、爬蟲實現
由於文章中並沒有找到關鍵字,於是將標題進行拆分成關鍵字,用逗號隔開


import re
import requests
from bs4 import BeautifulSoup
import demjson
import pymysql
import os

headers = {'user-agent':'Mozilla/5.0 (Windows NT 10.0; Win64; x64) AppleWebKit/537.36 (KHTML, like Gecko) Chrome/74.0.3729.131 Safari/537.36'}#創建頭部信息
url='//openaccess.thecvf.com/CVPR2018.py'
r=requests.get(url,headers=headers)
content=r.content.decode('utf-8')
soup = BeautifulSoup(content, 'html.parser')
dts=soup.find_all('dt',class_='ptitle')
hts='//openaccess.thecvf.com/'
#數據爬取
alllist=[]
for i in range(len(dts)):
    print('這是第'+str(i)+'個')
    title=dts[i].a.text.strip()
    href=hts+dts[i].a['href']
    r = requests.get(href, headers=headers)
    content = r.content.decode('utf-8')
    soup = BeautifulSoup(content, 'html.parser')
    #print(title,href)
    divabstract=soup.find(name='div',attrs={"id":"abstract"})
    abstract=divabstract.text.strip()
    #print('第'+str(i)+'個:',abstract)
    alllink=soup.select('a')
    link=hts+alllink[4]['href'][6:]
    keyword=str(title).split(' ')
    keywords=''
    for k in range(len(keyword)):
        if(k==0):
            keywords+=keyword[k]
        else:
            keywords+=','+keyword[k]
    value=(title,abstract,link,keywords)
    alllist.append(value)
print(alllist)
tuplist=tuple(alllist)
#數據保存
db = pymysql.connect("localhost", "root", "fengge666", "yiqing", charset='utf8')
cursor = db.cursor()
sql_cvpr = "INSERT INTO cvpr values (%s,%s,%s,%s)"
try:
    cursor.executemany(sql_cvpr,tuplist)
    db.commit()
except:
      print('執行失敗,進入回調3')
      db.rollback()
db.close()
View Code
二、將數據進行wordCloud展示
首先找到對應的包,來展示詞雲圖
<script src='//cdn.bootcss.com/echarts/3.7.0/echarts.simple.js'></script>
<script src='js/echarts-wordcloud.js'></script>
<script src='js/echarts-wordcloud.min.js'></script>
然後通過異步加載,將後台的json數據進行展示。
由於第一步我們獲得的數據並沒有對其進行分析,因此我們在dao層會對其進行數據分析,找出所有的關鍵字的次數並對其進行降序排序(用Map存儲是最好的方式)
public Map<String,Integer> getallmax()
    {
        String sql="select * from cvpr";
        Map<String, Integer>map=new HashMap<String, Integer>();
        Map<String, Integer>sorted=new HashMap<String, Integer>();
        Connection con=null;
        Statement state=null;
        ResultSet rs=null;
        con=DBUtil.getConn();
        try {
            state=con.createStatement();
            rs=state.executeQuery(sql);
            while(rs.next())
            {
                String keywords=rs.getString("keywords");
                String[] split = keywords.split(",");
                for(int i=0;i<split.length;i++)
                {
                    if(map.get(split[i])==null)
                    {
                        map.put(split[i],0);
                    }
                    else
                    {
                        map.replace(split[i], map.get(split[i])+1);
                    }
                }
            }
        } catch (SQLException e) {
            // TODO Auto-generated catch block
            e.printStackTrace();
        }
        DBUtil.close(rs, state, con);
        sorted = map
                .entrySet()
                .stream()
                .sorted(Collections.reverseOrder(comparingByValue()))
                .collect(
                        toMap(Map.Entry::getKey, Map.Entry::getValue, (e1, e2) -> e2,
                                LinkedHashMap::new));
        return sorted;
    }
View Code
到servlet層後,我們還需對數據進行一定的篩選(介詞,a,等詞語應該去除掉,要不然會干擾我們分析關鍵字),取前30名關鍵字,在前台進行展示
request.setCharacterEncoding("utf-8");
        Map<String, Integer>sortMap=dao.getallmax();
        JSONArray json =new JSONArray();
        int k=0;
        for (Map.Entry<String, Integer> entry : sortMap.entrySet())
        {
            JSONObject ob=new JSONObject();
            ob.put("name", entry.getKey());
            ob.put("value", entry.getValue());
            if(!(entry.getKey().equals("for")||entry.getKey().equals("and")||entry.getKey().equals("With")||entry.getKey().equals("of")||entry.getKey().equals("in")||entry.getKey().equals("From")||entry.getKey().equals("A")||entry.getKey().equals("to")||entry.getKey().equals("a")||entry.getKey().equals("the")||entry.getKey().equals("by")))
            {
                json.add(ob);
                k++;
            }
            if(k==30)
                break;
        }
        System.out.println(json.toString());
        response.getWriter().write(json.toString());
View Code
三、設置點擊事件,展示對應關鍵字的論文以及鏈接
//設置點擊效果
var ecConfig = echarts.config;
myChart.on('click', eConsole);
用函數來實現點擊事件的內容:通過點擊的關鍵字,後台進行模糊查詢,找到對應的論文題目以及鏈接,返回到前端頁面
 //點擊事件
        function eConsole(param) {
            if (typeof param.seriesIndex == 'undefined') {
                return;
            }
            if (param.type == 'click') {
                var word=param.name;
                var htmltext="<table class='table table-striped' style='text-align:center'><caption style='text-align:center'>論文題目與鏈接</caption>";
                $.post(
                        'findkeytitle',
                        {'word':word},
                        function(result)
                        {
                            json=JSON.parse(result);
                            for(i=0;i<json.length;i++)
                            {
                                htmltext+="<tr><td><a target='_blank' href='"+json[i].Link+"'>"+json[i].Title+"</a></td></tr>";
                            }
                            htmltext+="</table>"
                            $("#show").html(htmltext);
                        }
                )
            }
       }
View Code
成果展示:
前台頁面代碼:
<html>
    <head>
        <meta charset="utf-8">
        <link href="css/bootstrap.min.css" rel="stylesheet">
        <!-- jQuery (Bootstrap 的所有 JavaScript 插件都依賴 jQuery,所以必須放在前邊) -->
        <script src="js/jquery-1.11.3.min.js"></script>
        <!-- 加載 Bootstrap 的所有 JavaScript 插件。你也可以根據需要只加載單個插件。 -->
        <script src="js/bootstrap.js"></script>
        <script src='//cdn.bootcss.com/echarts/3.7.0/echarts.simple.js'></script>
        <script src='js/echarts-wordcloud.js'></script>
        <script src='js/echarts-wordcloud.min.js'></script>
    </head>
    <body>
        <style>
            body{
                background-color: black;
            }
            #main {
                width: 70%;
                height: 100%;
                margin: 0;
                float:right;
                background: black;
            }
            #show{
                overflow-x: auto;
                 overflow-y: auto;
                width: 30%;
                height: 100%;
                float:left;
                margin-top:100dp;
                padding-top:100dp;
                background: pink;
            }
        </style>
        <div id='show'></div>
        <div id='main'></div>
    <script>
        $(function(){
            echartsCloud();
        });
        //點擊事件
        function eConsole(param) {
            if (typeof param.seriesIndex == 'undefined') {
                return;
            }
            if (param.type == 'click') {
                var word=param.name;
                var htmltext="<table class='table table-striped' style='text-align:center'><caption style='text-align:center'>論文題目與鏈接</caption>";
                $.post(
                        'findkeytitle',
                        {'word':word},
                        function(result)
                        {
                            json=JSON.parse(result);
                            for(i=0;i<json.length;i++)
                            {
                                htmltext+="<tr><td><a target='_blank' href='"+json[i].Link+"'>"+json[i].Title+"</a></td></tr>";
                            }
                            htmltext+="</table>"
                            $("#show").html(htmltext);
                        }
                )
            }
       }
        function echartsCloud(){


            $.ajax({
                 url:"getmax",
                 type:"POST",
                 dataType:"JSON",
                 async:true,
                 success:function(data)
                 {
                     var mydata = new Array(0);

                     for(var i=0;i<data.length;i++)
                     {
                         var d = {

                         };
                         d["name"] = data[i].name;//.substring(0, 2);
                         d["value"] = data[i].value;
                         mydata.push(d);
                     }
                     var myChart = echarts.init(document.getElementById('main'));
                     //設置點擊效果
                     var ecConfig = echarts.config;
                     myChart.on('click', eConsole);

                     myChart.setOption({
                         title: {
                             text: ''
                         },
                         tooltip: {},
                         series: [{
                             type : 'wordCloud',  //類型為字符雲
                                 shape:'smooth',  //平滑
                                 gridSize : 8, //網格尺寸
                                 size : ['50%','50%'],
                                 //sizeRange : [ 50, 100 ],
                                 rotationRange : [-45, 0, 45, 90], //旋轉範圍
                                 textStyle : {
                                     normal : {
                                         fontFamily:'微軟雅黑',
                                         color: function() {
                                             return 'rgb(' +
                                                 Math.round(Math.random() * 255) +
                                          ', ' + Math.round(Math.random() * 255) +
                                          ', ' + Math.round(Math.random() * 255) + ')'
                                                }
                                         },
                                     emphasis : {
                                         shadowBlur : 5,  //陰影距離
                                         shadowColor : '#333'  //陰影顏色
                                     }
                                 },
                                 left: 'center',
                                 top: 'center',
                                 right: null,
                                 bottom: null,
                                 width:'100%',
                                 height:'100%',
                                 data:mydata
                         }]
                     });
                 }
             });
    }
    </script>
    </body>
</html>
View Code

