Matplotlib(基本用法)
Matplotlib 是數據分析繪圖的常見模塊,可以算是 2D-繪圖(Python)領域使用最廣泛的套件,可以將數據圖形化,並且提供多樣化的輸出格式,利於數據的顯示並分析。
接下來展示的是Matplotlib 常見繪製的圖形,也是我自己對知識的一種總結。
# 模塊的導入
import matplotlib.pyplot as plt
import numpy as np
matplotlib經常會遇到中文顯示不出來的問題,中文亂碼設置一般在設置樣式之後,之前一直沒注意順序,導致一直沒看到效果(😶)
# 設置樣式
plt.style.use('seaborn')
# 設置中文亂碼
plt.rcParams['font.sans-serif'] = 'KaiTi'
plt.rcParams['font.sans-serif'] = ['SimHei']  #用來正常顯示中文標籤
# 忽視警告
import warnings
warnings.filterwarnings('ignore')
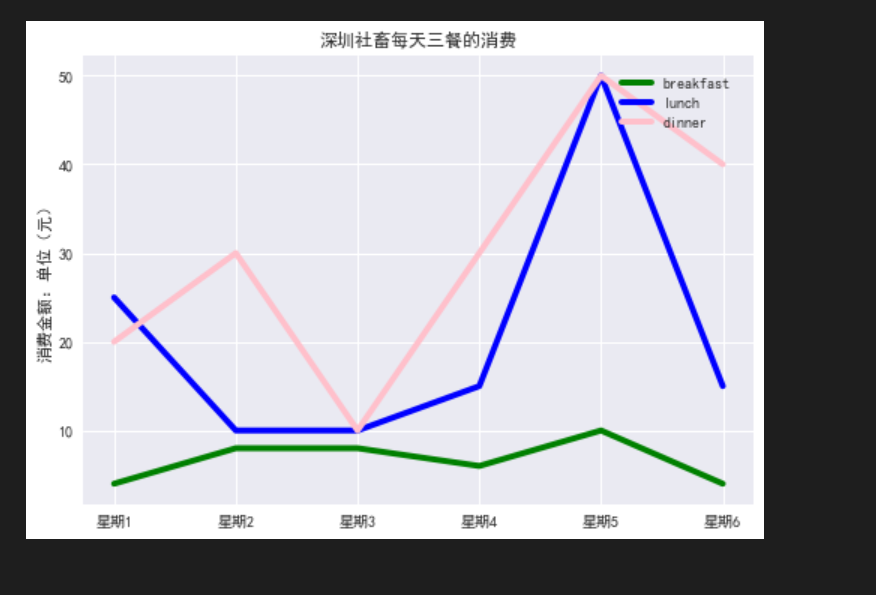
繪製折線圖,折線圖可以直觀得對比數據間的變化
# 構造數據
breakfast = [4,8,8,6,10,4]
lunch = [25,10,10,15,50,15]
dinner = [20,30,10,30,50,40]

# 繪製折線圖
plt.plot(breakfast,label='breakfast',linewidth=4,c='green')
plt.plot(lunch,label='lunch',linewidth=4,c='blue')
plt.plot(dinner,label='dinner',linewidth=4,c='pink')
# 設置樣式
x_ticks = [f’星期{i}’ for i in range(1,7)]
plt.xticks(ticks=range(6),labels=x_ticks) # x軸刻度值所一一對應的值
plt.ylabel(‘消費金額:單位(元)’)
plt.title(‘深圳社畜每天三餐的消費’)
#添加圖例upper right 右上角 邊框 透明度 陰影 邊框寬度
plt.legend(loc=’upper right’,fancybox=True,framealpha=1,shadow=True,borderpad=1)
繪製曲線圖
# 繪製曲線圖
plt.figure(figsize=(15,5)) # 設置畫布
x = np.linspace(1,10,num=100)
plt.subplot(1,3,1)  # 添加分佈 1行3列 第1列畫布繪製
plt.plot(x,np.sin(x),linewidth='7',color='blue') # 正弦
plt.subplot(1,3,2)  # 第2列畫布繪製
plt.plot(x,np.cos(x),linewidth='7',color='red') # 餘弦
plt.subplot(1,3,3) # 第3列畫布繪製
plt.plot(x,np.tanh(x),linewidth='7',color='green') # 正切

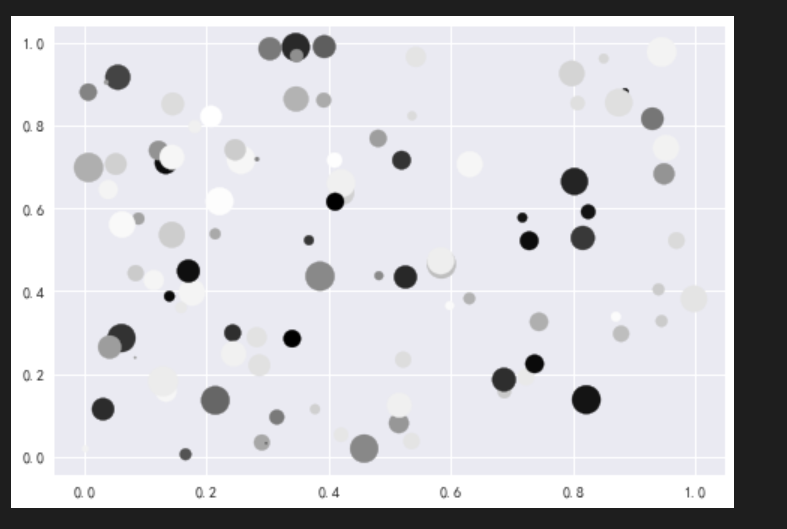
繪製散點圖 一般用於查看數據是否線性相關 中間可以添加直線分析
# 繪製散點圖
x = np.random.rand(100) # rand:服從「0~1」均勻分佈的隨機樣本值均勻分佈
y = np.random.rand(100)
colors = np.random.rand(100)
sizes = np.random.rand(100)*400
plt.scatter(x,y,c=colors,s=sizes)
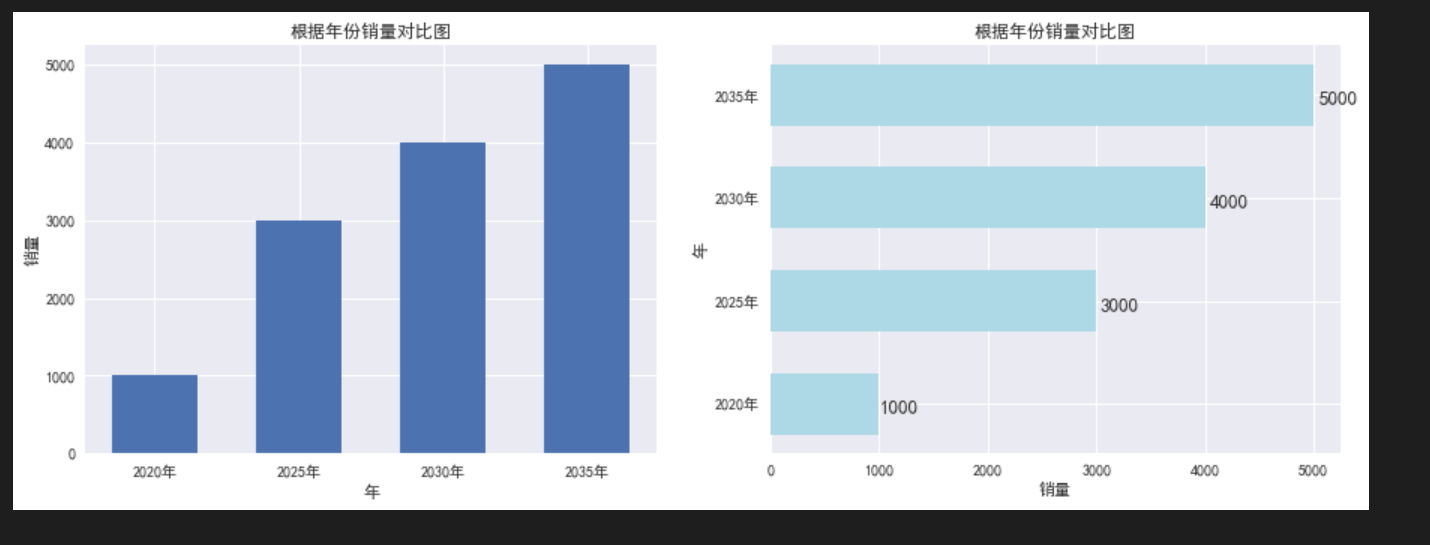
繪製條形圖 可以多數據(例如每一年4個季度,一起比較分析)
# 繪製縱向條形圖
x=[2020,2025,2030,2035]
y=[1000,3000,4000,5000]

plt.figure(figsize=(15,5)) # 設置畫布

plt.subplot(1,2,1)
plt.xticks(x,[f'{x}年' for x in x]) # 橫坐標的刻度尺
plt.bar(x,y,width=3)
plt.xlabel('年') # 橫坐標標籤
plt.ylabel('銷量') # 縱坐標標籤
plt.title('根據年份銷量對比圖')

# 繪製橫向條形圖
plt.subplot(1,2,2)
plt.yticks(x,[f'{x}年' for x in x])
bars = plt.barh(x,y,height=3,color='lightblue')
for bar,d in zip(bars,y):
    x = bar.get_width() + bar.get_width()*0.01
    y = bar.get_y() + bar.get_height()/3
    text_data = d
    plt.text(x,y,text_data,fontsize=13)
plt.xlabel('銷量')
plt.ylabel('年')
plt.title('根據年份銷量對比圖')
繪製餅圖 直觀分辨哪個數據所佔比份最重
# 構造數據
全市 = 17560061
福田區 = 1553225/全市
羅湖區 = 1143801/全市
鹽田區 = 214225/全市
南山區 = 1795826/全市
寶安區 = 4476554/全市
龍崗區 = 3979037/全市
龍華區 = 2528872/全市
坪山區 = 551333/全市
光明區  = 1095289/全市
大鵬新區 = 156236/全市

explode = (0, 0, 0, 0, 0, 0.1, 0, 0, 0, 0)
labels = ['福田區','羅湖區','鹽田區','南山區','寶安區','龍崗區','龍華區','坪山區','光明區','大鵬新區']
paches,texts,autotexts = plt.pie([福田區,羅湖區,鹽田區,南山區,寶安區,龍崗區,龍華區,坪山區,光明區,大鵬新區],
        autopct='%0.1f%%',
        labels=labels,
        explode=explode)
plt.title('深圳市第七次全國人口普查——分區人口情況')

for text in texts:
    text.set_fontsize(10)
    text.set_color('blue')

for t in autotexts:
    t.set_fontsize(10)
    t.set_color('white')

繪製直方圖
# 繪製直方圖
x = np.random.rand(100)

plt.hist(x,bins=10,align='mid',rwidth=0.8,histtype='barstacked') # rwidth 控制着間隙的寬度

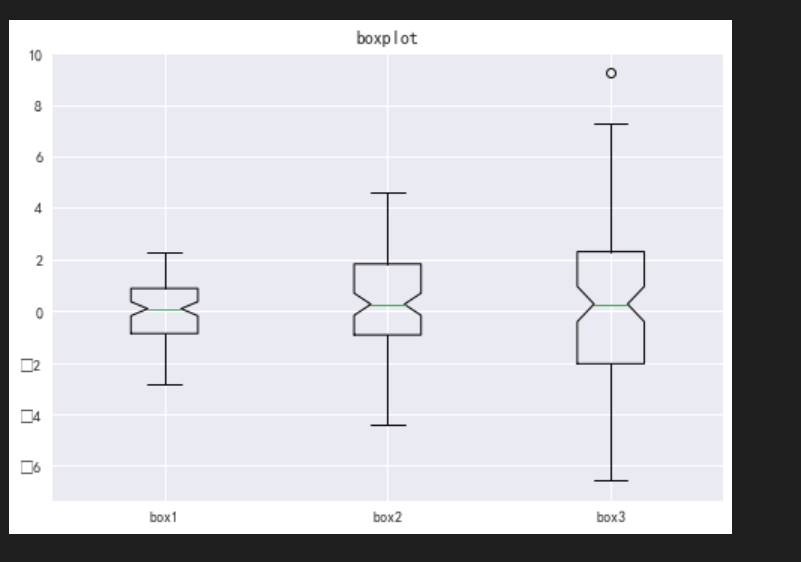
繪製盒圖 盒圖經常用於觀察數據的離散程度 上下兩條橫線代表最大最小值,上方的空心圓代表異常值
# 繪製盒圖
data = [np.random.normal(0,i,100) for i in range(1,4)]
# vert:是否需要將箱線圖垂直擺放,默認垂直擺放
# notch:是否是凹口的形式展現箱線圖,默認非凹口
plt.boxplot(data,vert=True,notch=True)
plt.title('boxplot')
plt.xticks([1,2,3],['box1','box2','box3']) # 橫坐標三個刻度尺,分別對應三個值
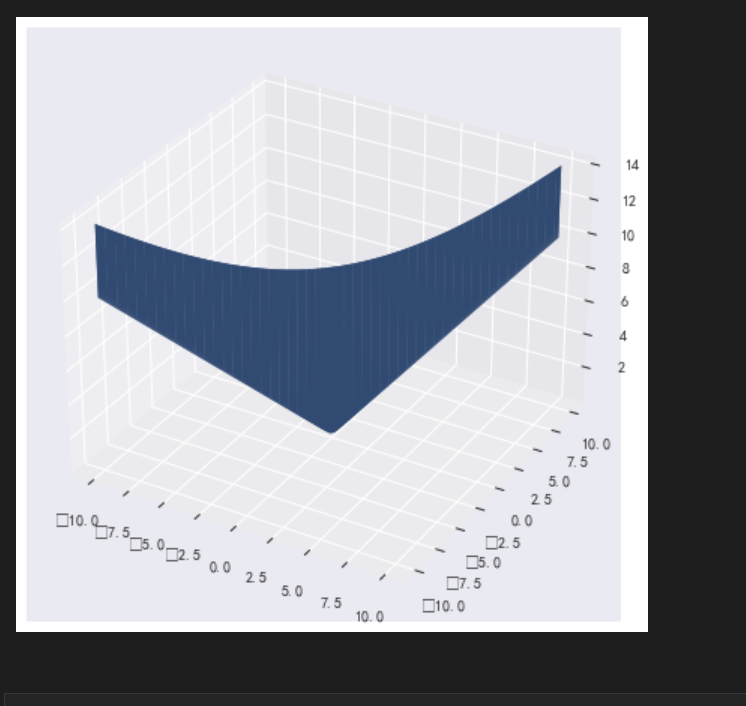
# 繪製三維圖
from mpl_toolkits.mplot3d import Axes3D
x = np.linspace(-10,10,100)
y = np.linspace(-10,10,100)
X,Y = np.meshgrid(x,y) # 網格線
z = np.sqrt(X**2+Y**2)
ax = Axes3D(plt.figure())
ax.plot_surface(x,y,z)