matplotlib 並列條形圖
1 繪製並列條形圖,並在條形圖上加標註
1.1 代碼
from matplotlib import pyplot
from matplotlib import font_manager
import numpy as np
import random

# 小學期間語文和數學的成績
x_label = ['一年級','二年級','三年級','四年級','五年級','六年級']
chinese = [random.randint(40,100) for i in range(6)]
math = [random.randint(20,100) for i in range(6)]

#x軸刻度 用數組方便數據運算
x = np.arange(len(x_label))
width = 0.3 # 條形圖寬度

plt.figure(figsize=(20,8),dpi=80)
# 語文條形圖
# bar(self, x, height, width=0.8, bottom=None, *, align='center', data=None, **kwargs)
# 將chinese的條形圖向左平移半個寬度
rects1=plt.bar(x-width/2,chinese,width=width,label='語文')
# 將math的條形圖向左平移半個寬度
rects2=plt.bar(x+width/2,math,width=width,label='數學')

# 添加標題、圖例、網格、y軸標題、x刻度標籤
my_font = font_manager.FontProperties(fname='C:/Windows/Fonts/msyh.ttc',size=10)
plt.title('小學語文和數學分數對比',fontproperties=my_font)
plt.legend(prop=my_font,loc='upper right')
plt.grid(alpha=0.4)
plt.ylabel('分數',fontproperties=my_font)
plt.xticks(x,x_label,fontproperties=my_font)

# 在條形圖上加標註(水平居中)
# plt.bar()可以返回條形圖的每個條形,所以前代碼將各個柱形賦值給一個變量
for rect1 in rects1:
    height = rect1.get_height()
    plt.text(rect1.get_x()+rect1.get_width()/2,height+1,str(height),ha='center')

for rect2 in rects2:
    height = rect2.get_height()
    plt.text(rect2.get_x()+rect2.get_width()/2,height+1,str(height),ha='center')


plt.show()
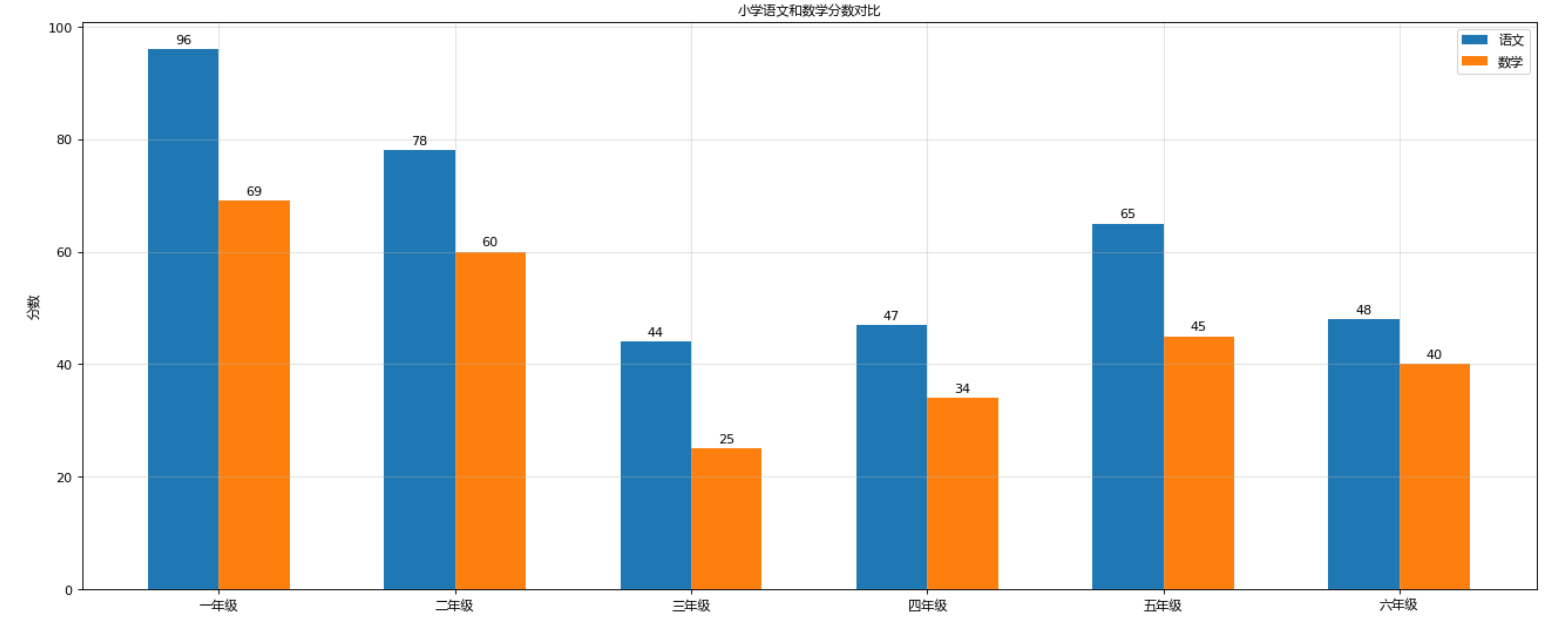
1.2 圖表展示
2 代碼分解
2.1 並列條形圖
在同一個繪圖區內繪製兩個條形圖,此時兩個條形圖重疊在一起
為了解決重疊,調整兩個條形圖的x。如上圖chinese條形圖向左平移半個寬度,math條形圖向右平移半個寬度,不用移動x軸
# 語文條形圖
# bar(self, x, height, width=0.8, bottom=None, *, align='center', data=None, **kwargs)
# 將chinese的條形圖向左平移半個寬度
rects1=plt.bar(x-width/2,chinese,width=width,label='語文')
# 將math的條形圖向右平移半個寬度
rects2=plt.bar(x+width/2,math,width=width,label='數學')
2.2 中文顯示
2.2.1 使用font_manager導入電腦中的字體
查看電腦支持的字體
查看Linux、Mac下支持的字體:
終端執行
fc-list
查看支持的中文:
# 冒號前有兩個空格
fc-list  :lang=zh
查看win下的字體:
‘C:/windows/Fonts/’
#### 在代碼中引入中文
```python
my_font = font_manager.FontProperties(fname='C:/Windows/Fonts/msyh.ttc',size=10)
plt.title('小學語文和數學分數對比',fontproperties=my_font)
注意
plt.title、plt.ylabel、plt.xticks等需要使用中文時,參數為fontproperties=my_font
但設置圖例的時候使用中文,plt.legend中,參數為prop=my_font
2.2.2 使用rcParams引入中文
plt.rcParams['font.family'] = ['sans-serif']
plt.rcParams['font.sans-serif'] = ['SimHei']
2.3 在條形圖上加標註
plt.bar()可以返回條形圖的每個條形,所以前代碼將各個柱形賦值給一個變量
rects1=plt.bar(x-width/2,chinese,width=width,label='語文')
再使用for遍歷每一個條形
獲取到一個條形後,使用get_height()方法獲取條形的高,即值
再使用plt.text加標註,text(self, x, y, s, fontdict=None, **kwargs)
註:
- get_x()獲取的是條形的左側,若要標註居中,需要在get_x()的基礎上再向右移動半個寬度;
- 若標註的高僅使用get_height(),則會出現標註和條形的間隔過小,此時get_height()+1將標註往上,增加標註和條形之間的距離;
- 標註內容要求為str類型,需要將值進行轉換
- 調整標註和定位點的對齊方式使用參數ha={‘center’,’right’,’left’}
for rect1 in rects1:
    height = rect1.get_height()
    plt.text(rect1.get_x()+rect1.get_width()/2,height+1,str(height),ha='center')