Java JFR 民間指南 – 事件詳解 – jdk.ObjectAllocationOutsideTLAB
- 2021 年 4 月 27 日
- 筆記
- JAVA, JVM, 通過JFR詳解JVM
重新申請 TLAB 分配對象事件:jdk.ObjectAllocationOutsideTLAB
引入版本:Java 11
相關 ISSUES:
- JFR: RecordingStream leaks memory:啟用 jdk.ObjectAllocationInNewTLAB 發現在 RecordingStream 中有內存泄漏,影響 Java 14、15、16,在 jdk-16+36 (Java 16.0.1) 修復。
- Introduce JFR Event Throttling and new jdk.ObjectAllocationSample event (enabled by default):引入 jdk.ObjectAllocationSample 優化並替代 jdk.ObjectAllocationInNewTLAB 和 jdk.ObjectAllocationOutsideTLAB 事件。
各版本配置:
從 Java 11 引入之後沒有改變過:
默認配置(default.jfc of Java 11,default.jfc of Java 12,default.jfc of Java 13,default.jfc of Java 14,default.jfc of Java 15,default.jfc of Java 16,default.jfc of Java 17):
| 配置 | 值 | 描述 |
|---|---|---|
| enabled | false | 默認不啟用 |
| stackTrace | true | 採集事件的時候,也採集堆棧 |
採樣配置(profile.jfc of Java 11,profile.jfc of Java 12,profile.jfc of Java 13,profile.jfc of Java 14,profile.jfc of Java 15,profile.jfc of Java 16,profile.jfc of Java 17):
| 配置 | 值 | 描述 |
|---|---|---|
| enabled | true | 默認啟用 |
| stackTrace | true | 採集事件的時候,也採集堆棧 |
為何需要這個事件?
首先我們來看下 Java 對象分配的流程:
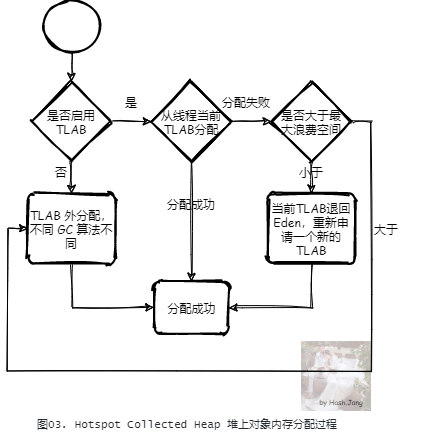
對於 HotSpot JVM 實現,所有的 GC 算法的實現都是一種對於堆內存的管理,也就是都實現了一種堆的抽象,它們都實現了接口 CollectedHeap。當分配一個對象堆內存空間時,在 CollectedHeap 上首先都會檢查是否啟用了 TLAB,如果啟用了,則會嘗試 TLAB 分配;如果當前線程的 TLAB 大小足夠,那麼從線程當前的 TLAB 中分配;如果不夠,但是當前 TLAB 剩餘空間小於最大浪費空間限制,則從堆上(一般是 Eden 區) 重新申請一個新的 TLAB 進行分配(對應當前提到的事件 jdk.ObjectAllocationInNewTLAB)。否則,直接在 TLAB 外進行分配(對應事件 jdk.ObjectAllocationOutsideTLAB)。TLAB 外的分配策略,不同的 GC 算法不同。例如G1:
- 如果是 Humongous 對象(對象在超過 Region 一半大小的時候),直接在 Humongous 區域分配(老年代的連續區域)。
- 根據 Mutator 狀況在當前分配下標的 Region 內分配
對於大部分的 JVM 應用,大部分的對象是在 TLAB 中分配的。如果 TLAB 外分配過多,或者 TLAB 重分配過多,那麼我們需要檢查代碼,檢查是否有大對象,或者不規則伸縮的對象分配,以便於優化代碼。
事件包含屬性
| 屬性 | 說明 | 舉例 |
|---|---|---|
| startTime | 事件開始時間 | 10:16:27.718 |
| objectClass | 觸發本次事件的對象的類 | byte[] (classLoader = bootstrap) |
| allocationSize | 分配對象大小 | 10.0 MB |
| eventThread | 事件發生所在線程 | “Thread-0” (javaThreadId = 27) |
| stackTrace | 事件發生所在堆棧 | 略 |
使用代碼測試這個事件
package com.github.hashjang.jfr.test;

import jdk.jfr.Recording;
import jdk.jfr.consumer.RecordedEvent;
import jdk.jfr.consumer.RecordedFrame;
import jdk.jfr.consumer.RecordingFile;
import sun.hotspot.WhiteBox;

import java.io.File;
import java.nio.file.Path;

public class TestAllocOutsideTLAB {

    //對於位元組數組對象頭佔用16位元組
    private static final int BYTE_ARRAY_OVERHEAD = 16;
    //我們要測試的對象大小是100kb
    private static final int OBJECT_SIZE = 1024;
    //位元組數組對象名稱
    private static final String BYTE_ARRAY_CLASS_NAME = new byte[0].getClass().getName();

    //需要使用靜態field,而不是方法內本地變量,否則編譯後循環內的new byte[]全部會被省略,只剩最後一次的
    public static byte[] tmp;

    public static void main(String[] args) throws Exception {
        WhiteBox whiteBox = WhiteBox.getWhiteBox();
        //初始化 JFR 記錄
        Recording recording = new Recording();
        //啟用 jdk.ObjectAllocationOutsideTLAB 事件監控
        recording.enable("jdk.ObjectAllocationOutsideTLAB");
        // JFR 記錄啟動
        recording.start();
        //強制 fullGC 防止接下來程序發生 GC
        //同時可以區分出初始化帶來的其他線程的TLAB相關的日誌
        whiteBox.fullGC();
        //分配對象,大小1KB
        for (int i = 0; i < 2048; ++i) {
            tmp = new byte[OBJECT_SIZE - BYTE_ARRAY_OVERHEAD];
        }
        //強制 fullGC,回收所有 TLAB
        whiteBox.fullGC();
        //分配對象,大小100KB
        for (int i = 0; i < 10; ++i) {
            tmp = new byte[OBJECT_SIZE * 100 - BYTE_ARRAY_OVERHEAD];
        }
        whiteBox.fullGC();
        //將 JFR 記錄 dump 到一個文件
        Path path = new File(new File(".").getAbsolutePath(), "recording-" + recording.getId() + "-pid" + ProcessHandle.current().pid() + ".jfr").toPath();
        recording.dump(path);
        int countOf1KBObjectAllocationOutsideTLAB = 0;
        int countOf100KBObjectAllocationOutsideTLAB = 0;
        //讀取文件中的所有 JFR 事件
        for (RecordedEvent event : RecordingFile.readAllEvents(path)) {
            //獲取分配的對象的類型
            String className = event.getString("objectClass.name");

            if (
                //確保分配類型是 byte[]
                    BYTE_ARRAY_CLASS_NAME.equalsIgnoreCase(className)
            ) {
                RecordedFrame recordedFrame = event.getStackTrace().getFrames().get(0);
                //同時必須是咱們這裡的main方法分配的對象,並且是Java堆棧中的main方法
                if (recordedFrame.isJavaFrame()
                        && "main".equalsIgnoreCase(recordedFrame.getMethod().getName())
                ) {
                    //獲取分配對象大小
                    long allocationSize = event.getLong("allocationSize");
                    //統計各種事件個數
                    if ("jdk.ObjectAllocationOutsideTLAB".equalsIgnoreCase(event.getEventType().getName())) {
                        if (allocationSize == 102400) {
                            countOf100KBObjectAllocationOutsideTLAB++;
                        } else if (allocationSize == 1024) {
                            countOf1KBObjectAllocationOutsideTLAB++;
                        }
                    } else {
                        throw new Exception("unexpected size of TLAB event");
                    }
                    System.out.println(event);
                }
            }
        }
        System.out.println("countOf1KBObjectAllocationOutsideTLAB: " + countOf1KBObjectAllocationOutsideTLAB);
        System.out.println("countOf100KBObjectAllocationOutsideTLAB: " + countOf100KBObjectAllocationOutsideTLAB);
        //阻塞程序,保證所有日誌輸出完
        Thread.currentThread().join();
    }
}
以下面參數運行這個程序,注意將 whitebox jar 包位置參數替換成你的 whitebox jar 包所在位置。
-Xbootclasspath/a:D:\github\jfr-spring-all\jdk-white-box\target\jdk-white-box-17.0-SNAPSHOT.jar -XX:+UnlockDiagnosticVMOptions -XX:+WhiteBoxAPI -Xms512m -Xmx512m
運行結果:
jdk.ObjectAllocationOutsideTLAB {
  //事件開始時間
  startTime = 08:56:49.220
  //分配對象類
  objectClass = byte[] (classLoader = bootstrap)
  //分配對象大小
  allocationSize = 100.0 kB
  //事件發生所在線程
  eventThread = "main" (javaThreadId = 1)
  //事件發生所在堆棧
  stackTrace = [
    com.github.hashjang.jfr.test.TestAllocOutsideTLAB.main(String[]) line: 95
  ]
}


jdk.ObjectAllocationOutsideTLAB {
  startTime = 08:56:49.220
  objectClass = byte[] (classLoader = bootstrap)
  allocationSize = 100.0 kB
  eventThread = "main" (javaThreadId = 1)
  stackTrace = [
    com.github.hashjang.jfr.test.TestAllocOutsideTLAB.main(String[]) line: 95
  ]
}


jdk.ObjectAllocationOutsideTLAB {
  startTime = 08:56:49.220
  objectClass = byte[] (classLoader = bootstrap)
  allocationSize = 100.0 kB
  eventThread = "main" (javaThreadId = 1)
  stackTrace = [
    com.github.hashjang.jfr.test.TestAllocOutsideTLAB.main(String[]) line: 95
  ]
}


jdk.ObjectAllocationOutsideTLAB {
  startTime = 08:56:49.220
  objectClass = byte[] (classLoader = bootstrap)
  allocationSize = 100.0 kB
  eventThread = "main" (javaThreadId = 1)
  stackTrace = [
    com.github.hashjang.jfr.test.TestAllocOutsideTLAB.main(String[]) line: 95
  ]
}


jdk.ObjectAllocationOutsideTLAB {
  startTime = 08:56:49.220
  objectClass = byte[] (classLoader = bootstrap)
  allocationSize = 100.0 kB
  eventThread = "main" (javaThreadId = 1)
  stackTrace = [
    com.github.hashjang.jfr.test.TestAllocOutsideTLAB.main(String[]) line: 95
  ]
}


countOf1KBObjectAllocationOutsideTLAB: 0
countOf100KBObjectAllocationOutsideTLAB: 5
底層原理以及相關 JVM 源碼
在每次發生內存分配的時候,都會創建一個 Allocation 對象記錄描述本次分配的一些狀態,他的構造函數以及析構函數為(其中 JFR 事件要採集的我已經注釋出來了):
public:
  Allocation(const MemAllocator& allocator, oop* obj_ptr)
      //內存分配器
    : _allocator(allocator),
      //分配線程
      _thread(Thread::current()),
      //要分配的對象指針
      _obj_ptr(obj_ptr),
      _overhead_limit_exceeded(false),
      //是否是 tlab 外分配
      _allocated_outside_tlab(false),
      //本次分配新分配的 tlab 大小,只有發生 tlab 重分配這個值才會大於 0
      _allocated_tlab_size(0),
      _tlab_end_reset_for_sample(false)
  {
    verify_before();
  }

  ~Allocation() {
    if (!check_out_of_memory()) {
      verify_after();
      //在銷毀時,調用 notify_allocation 來上報相關採集
      notify_allocation();
    }
  }
notify_allocation()包括:
void MemAllocator::Allocation::notify_allocation() {
  notify_allocation_low_memory_detector();
  //上報 jfr 相關
  notify_allocation_jfr_sampler();
  notify_allocation_dtrace_sampler();
  notify_allocation_jvmti_sampler();
}

void MemAllocator::Allocation::notify_allocation_jfr_sampler() {
  HeapWord* mem = cast_from_oop<HeapWord*>(obj());
  size_t size_in_bytes = _allocator._word_size * HeapWordSize;
  //如果標記的是 tlab 外分配,調用 send_allocation_outside_tlab
  if (_allocated_outside_tlab) {
    AllocTracer::send_allocation_outside_tlab(obj()->klass(), mem, size_in_bytes, _thread);
  } else if (_allocated_tlab_size != 0) {
    //如果不是 tlab 外分配,並且 _allocated_tlab_size 大於 0,代表發生了 tlab 重分配,調用 send_allocation_outside_tlab
    AllocTracer::send_allocation_in_new_tlab(obj()->klass(), mem, _allocated_tlab_size * HeapWordSize,
                                             size_in_bytes, _thread);
  }
}
在發生 TLAB 外分配的時候,會立刻生成這個事件並上報,對應源碼:
allocTracer.cpp
//在每次發生 TLAB 外分配的時候,調用這個方法上報
void AllocTracer::send_allocation_outside_tlab(Klass* klass, HeapWord* obj, size_t alloc_size, Thread* thread) {
  JFR_ONLY(JfrAllocationTracer tracer(obj, alloc_size, thread);)
  //立刻生成 jdk.ObjectAllocationOutsideTLAB 這個事件
  EventObjectAllocationOutsideTLAB event;
  if (event.should_commit()) {
    event.set_objectClass(klass);
    event.set_allocationSize(alloc_size);
    event.commit();
  }
  //採樣 jdk.ObjectAllocationSample 事件
  normalize_as_tlab_and_send_allocation_samples(klass, static_cast<intptr_t>(alloc_size), thread);
}
通過源碼分析我們可以知道,如果開啟這個事件,那麼只要發生 TLAB 外分配,就會生成並採集一個 jdk.ObjectAllocationOutsideTLAB 事件。
為何一般不在先生持續開啟這個事件
這個事件配置項比較少,只要開啟,就會發生一個 TLAB 外分配,就生成並採集一個 jdk.ObjectAllocationOutsideTLAB 事件。對於大型項目來說,分析這個事件,如果沒有堆棧,會很難定位。並且,TLAB 外分配如果發生的話,就會連續比較大量發生,採集這個事件會進一步增加性能消耗,但是也無法簡單的動態採集定位。如果需要動態開啟採集,需要我們寫額外的代碼實現。如果開啟堆棧採集,那麼只要發生比較大量的 jdk.ObjectAllocationInNewTLAB 事件,就會成為性能瓶頸,因為堆棧採集是很耗費性能的。目前大部分的 Java 線上應用,尤其是微服務應用,都使用了各種框架,堆棧非常深,可能達到幾百,如果涉及響應式編程,這個堆棧就更深了。JFR 考慮到這一點,默認採集堆棧深度最多是 64,即使是這樣,也還是比較耗性能的。並且,在 Java 11 之後,JDK 一直在優化獲取堆棧的速度,例如堆棧方法字符串放入緩衝池,優化緩衝池過期策略與 GC 策略等等,但是目前性能損耗還是不能忽視。
如果你不想開發額外代碼,還想線上持續監控的話,建議使用 Java 16 引入的 jdk.ObjectAllocationSample
總結
- jdk.jdk.ObjectAllocationOutsideTLAB 監控 TLAB 外分配事件,如果開啟,只要發生 TLAB 外分配,就會生成並採集一個 jdk.ObjectAllocationOutsideTLAB 事件。
- 開啟採集,並打開堆棧採集的話,會非常消耗性能。
- 如果你不想開發額外代碼,還想線上持續監控的話,建議使用 Java 16 引入的 jdk.ObjectAllocationSample
微信搜索「我的編程喵」關注公眾號,加作者微信,每日一刷,輕鬆提升技術,斬獲各種offer: