二 prometheus 監控 Redis
- 2021 年 1 月 16 日
- 筆記
- Prometheus
Prometheus 監控Redis需要用到redis_exporter客戶端, Prometheus -> redis_exporter這個模式, 類似監控Mysql 一個思路.
1 ) 設置系統代理,golang有可能被牆,導致編譯失敗.
# Enable the go modules feature
export GO111MODULE=on
# Set the GOPROXY environment variable
export GOPROXY=//goproxy.io

source /etc/profile
2 )部署 redis_exporter:
# 2.1 )redis_exporter Github 地址:
//github.com/oliver006/redis_exporter/

# 2.2 ) 開始安裝:
cd /data/soft/
git clone //github.com/oliver006/redis_exporter.git
cd redis_exporter
go build .
./redis_exporter --version

# 2.3 )驗證安裝結果:
[root@prod-8 redis_exporter]# ./redis_exporter -version
INFO[0000] Redis Metrics Exporter <<< filled in by build >>>    build date: <<< filled in by build >>>    sha1: <<< filled in by build >>>    Go: go1.15.5    GOOS: linux    GOARCH: amd64

*** 這樣就算是安裝完成了.
3 ) 配置 redis_exporter:
# 3.1 ) 帶參數啟動redis_expoeter:
nohup ./redis_exporter  -redis.addr 10.0.2.10:6379 -redis.password 123456 &

# 3.2 ) 參數說明:
-redis.addr        # redis的服務地址.
-redis.password    # redis認證密碼如果沒有密碼,該參數不需要.
......
*** 還有很多其他的參數可以添加,這兩個參數就夠用.

# 3.3 ) 訪問redis 頁面:
curl //10.0.2.8:9121/Metrics

# 3.3 ) 多個redis 添加
nohup ./redis_exporter -redis.addr 10.0.2.11:6379,10.0.2.11:6380,10.0.2.11:6381 -redis.password 12312312

# 3.4 ) 多實例部署:

......後續再補
4 ) Prometheus.conf 配置:
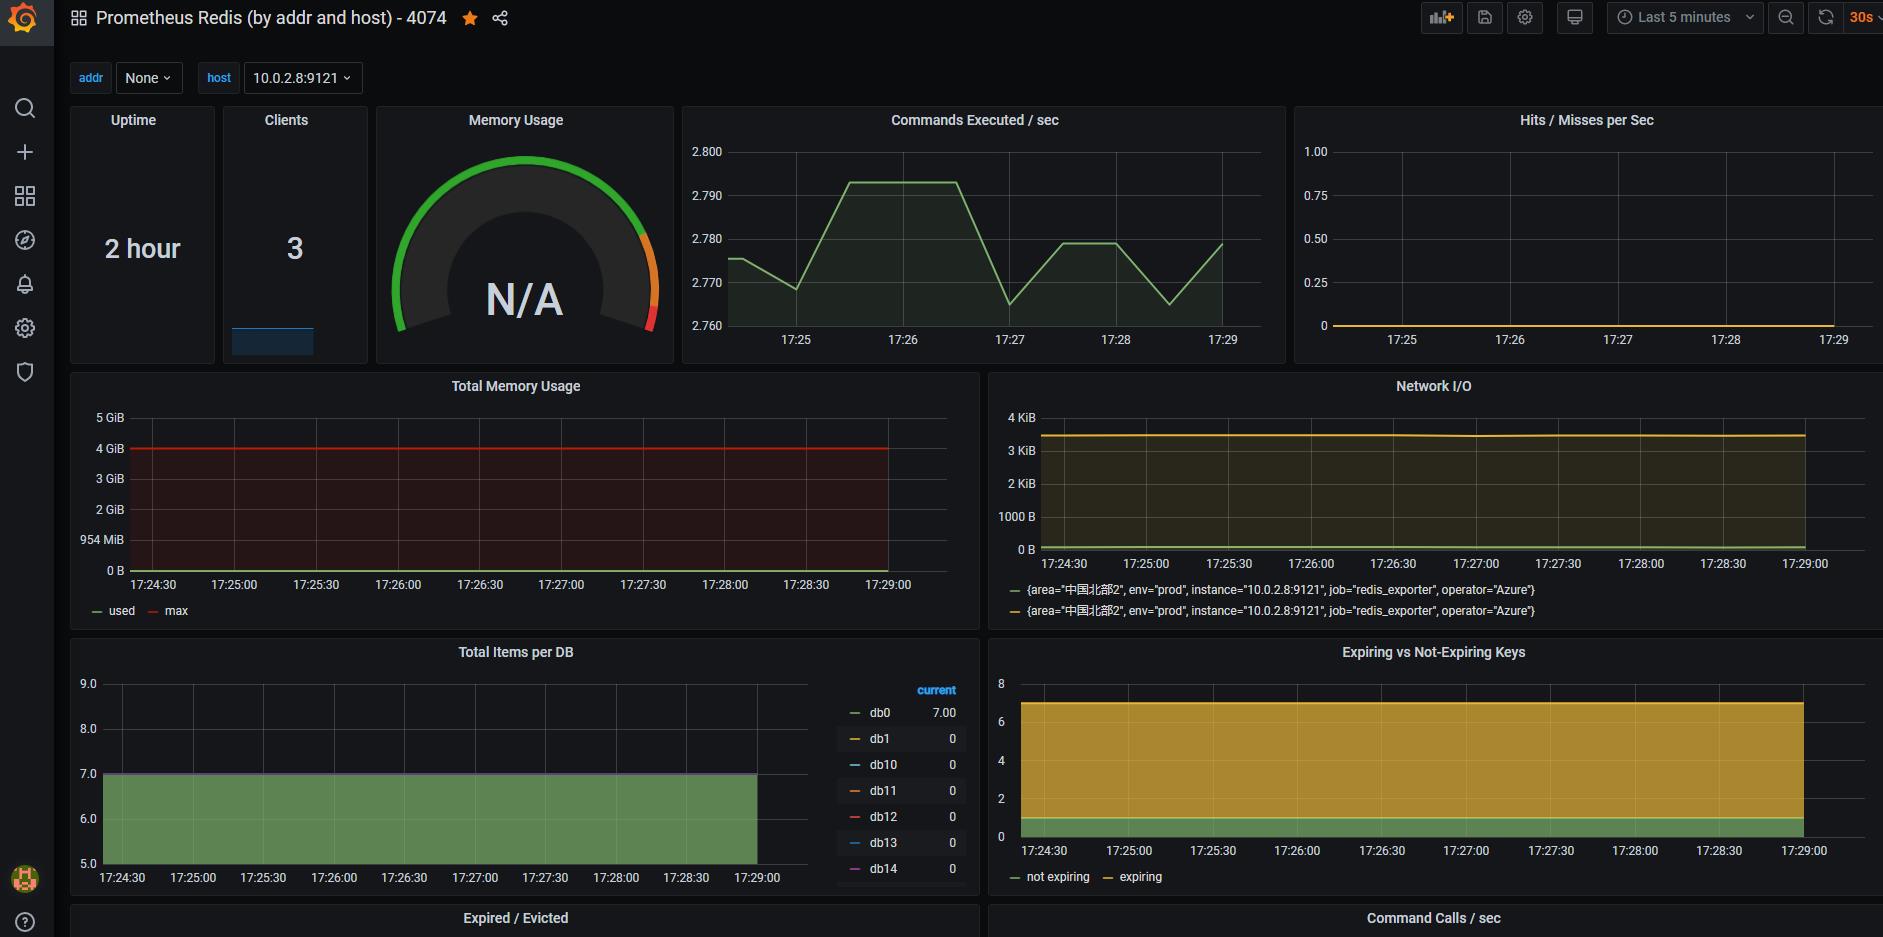
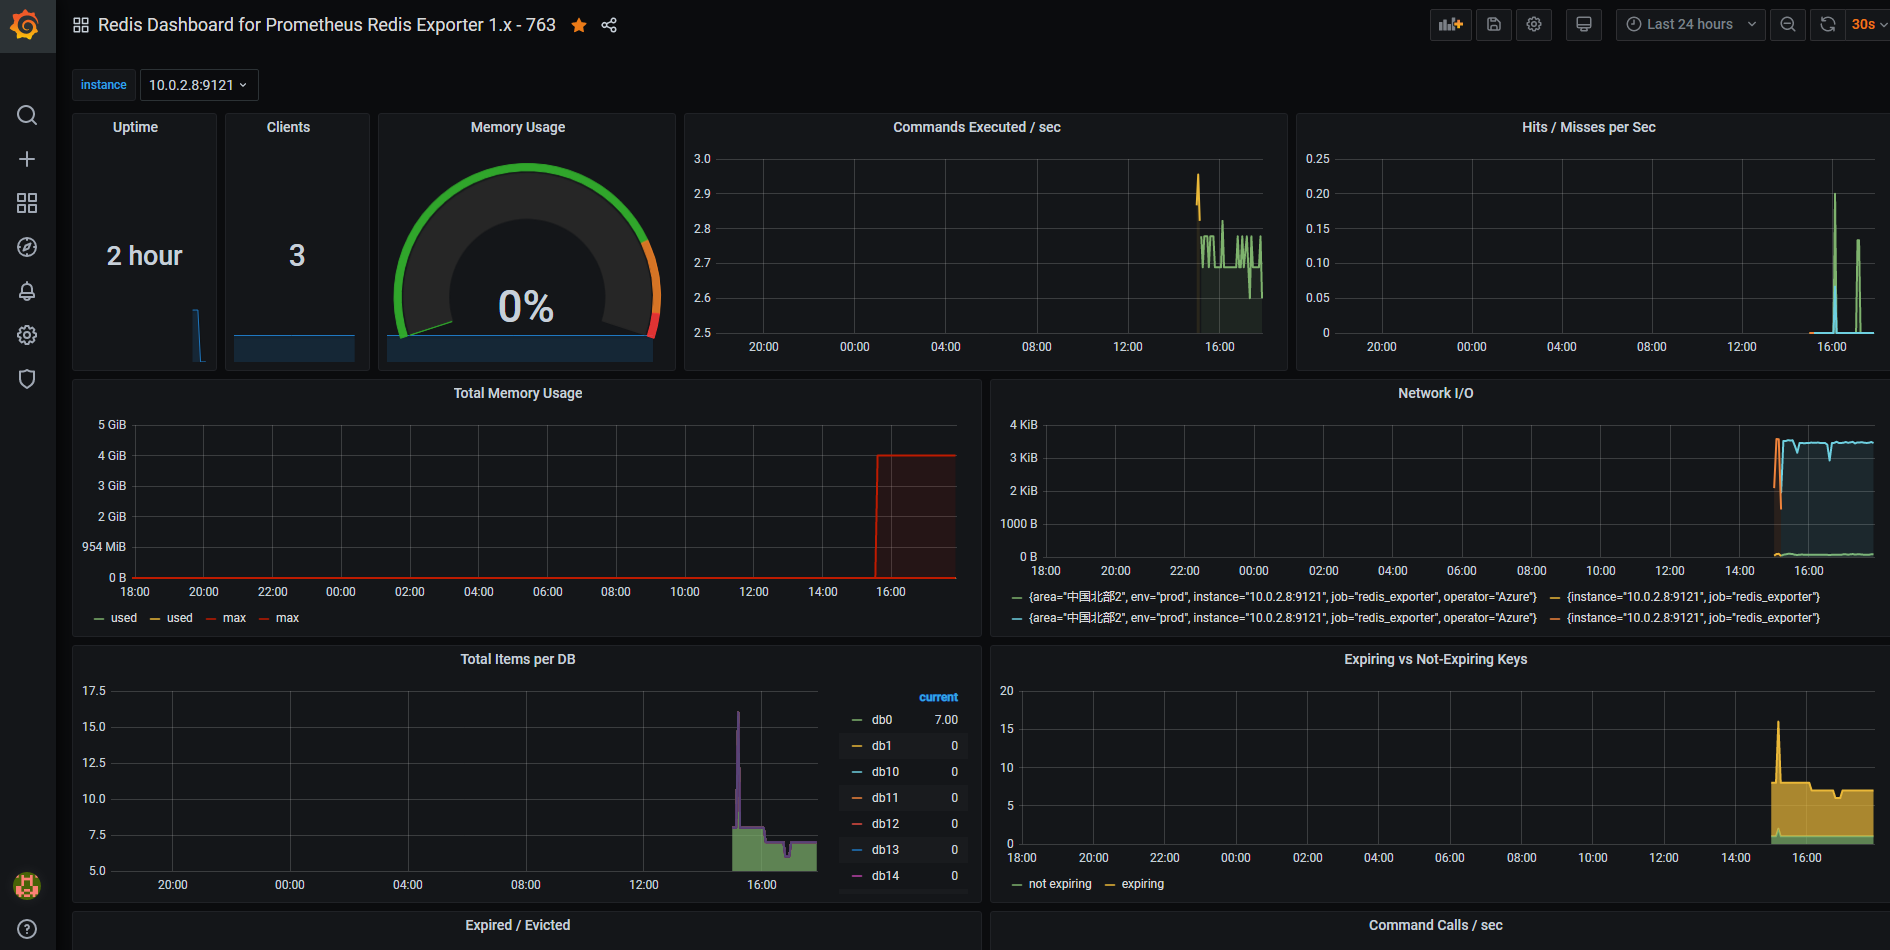
# 4.1 ) Grafana 添加模板:
模板號: 763   |   4074 均可:

# 4.2 ) Prometheus 添加配置:
vim proemtheus.yml
......
  - job_name: 'redis_exporter'
    static_configs:
    - targets: ['10.0.2.8:9121']       # 注意IP地址和端口
      labels:
        operator: 'Azure'
        area: "中國北部2"
        env: 'prod'

......保存退出.

*** 注意給對應主機打標籤,可以做報警分組抑制.

# 4.3 ) 重載prometheus配置:
systemctl restart prometheus
systemctl status prometheus
5 ) 訪問Prometheus Url 查看截圖: