寫一手漂亮的代碼,走向極致的編程 二、代碼運行時內存分析
前言
上篇文章中介紹了如何對代碼性能進行分析優化,這篇文章將介紹如何對代碼運行時內存進行分析。
說到內存,就想起之前在搞數據挖掘競賽的時候,往往要跑很大的數據集,經常就是炸內存。當時的解決辦法就是對着任務管理器用 jupyter notebook 分 cell 的跑代碼,將需要耗費大量內存的代碼塊找出來,然後考慮各種方式進行優化。
這篇文章將會介紹些更好的方法,來對代碼運行時內存進行分析,通過這些方法了解了代碼的內存使用情況之後,我們可以思考:
- 能不能重寫這個函數讓它使用更少的 RAM 來工作得更有效率
- 我們能不能使用更多的 RAM 緩存來節省 CPU 時間
開始分析
代碼仍採用上篇文章中的
memory_profiler
通過 pip install memory_profiler 來安裝這個庫。在需要進行分析的函數前加上修飾器 @profile
from memory_profiler import profile
...
...
@profile
def calculate_z_serial_purepython(maxiter, zs, cs):
    ...

@profile
def calc_pure_python(desired_width, max_itertions):
    ...
...
然後命令行輸入
python -m memory_profiler code_memory.py
跑得十分的慢 – -,跑了一個多小時,輸出如下
Length of x: 1000
Total elements: 1000000
Filename: code_memory.py

Line #    Mem usage    Increment   Line Contents
================================================
    30    159.1 MiB    159.1 MiB   @profile
    31                             def calculate_z_serial_purepython(maxiter, zs, cs):
    32    166.7 MiB      7.6 MiB       output = [0] * len(zs)
    33    166.7 MiB      0.0 MiB       for i in range(len(zs)):
    34    166.7 MiB      0.0 MiB           n = 0
    35    166.7 MiB      0.0 MiB           z = zs[i]
    36    166.7 MiB      0.0 MiB           c = cs[i]
    37    166.7 MiB      0.0 MiB           while n < maxiter and abs(z) < 2:
    38    166.7 MiB      0.0 MiB               z = z * z + c
    39    166.7 MiB      0.0 MiB               n += 1
    40    166.7 MiB      0.0 MiB           output[i] = n
    41    108.3 MiB      0.0 MiB       return output


calculate_z_serial_purepython took 8583.605925321579 seconds
Filename: code_memory.py

Line #    Mem usage    Increment   Line Contents
================================================
    43     80.9 MiB     80.9 MiB   @profile
    44                             def calc_pure_python(desired_width, max_itertions):
    45     80.9 MiB      0.0 MiB       x_step = (float(x2 - x1)) / float(desired_width)
    46     80.9 MiB      0.0 MiB       y_step = (float(y2 - y1)) / float(desired_width)
    47     80.9 MiB      0.0 MiB       x, y = [], []
    48     80.9 MiB      0.0 MiB       ycoord = y1
    49     80.9 MiB      0.0 MiB       while ycoord < y2:
    50     80.9 MiB      0.0 MiB           y.append(ycoord)
    51     80.9 MiB      0.0 MiB           ycoord += y_step
    52     80.9 MiB      0.0 MiB       xcoord = x1
    53     80.9 MiB      0.0 MiB       while xcoord < x2:
    54     80.9 MiB      0.0 MiB           x.append(xcoord)
    55     80.9 MiB      0.0 MiB           xcoord += x_step
    56     80.9 MiB      0.0 MiB       zs, cs = [], []
    57    159.1 MiB      0.0 MiB       for ycoord in y:
    58    159.1 MiB      0.1 MiB           for xcoord in x:
    59    159.1 MiB      0.9 MiB               zs.append(complex(xcoord, ycoord))
    60    159.1 MiB      0.1 MiB               cs.append(complex(c_real, c_imag))
    61    159.1 MiB      0.0 MiB       print(f"Length of x: {len(x)}")
    62    159.1 MiB      0.0 MiB       print(f"Total elements: {len(zs)}")
    63    159.1 MiB      0.0 MiB       start_time = time.time()
    64    108.6 MiB      0.0 MiB       output = calculate_z_serial_purepython(max_itertions, zs, cs)
    65    108.6 MiB      0.0 MiB       end_time = time.time()
    66    108.6 MiB      0.0 MiB       secs = end_time - start_time
    67    108.6 MiB      0.0 MiB       print("calculate_z_serial_purepython took", secs, "seconds")
    68
    69    108.6 MiB      0.0 MiB       assert sum(output) == 33219980
可以看到:
- 第 32 行,可以看到分配了 1000000 個項目,導致大約 7M 的 RAM 被加入這個進程
- 在 57 行的父進程中,可以看到 zs 和 cs 列表的分配佔用了大約 70M。
註:這裡的的數字並不一定是數組的真實大小,只是進程在創建這些列表的過程中增長的大小
mprof
在 memory_profiler 庫中,還有一種通過隨時間進行採樣並畫圖的方式來展示內存使用變化,叫 mprof。
記得把 @profile 注釋掉
mprof run code_memory.py
運行結束後會有一個 .dat 文件,接着命令行輸入
mprof plot
生成圖片

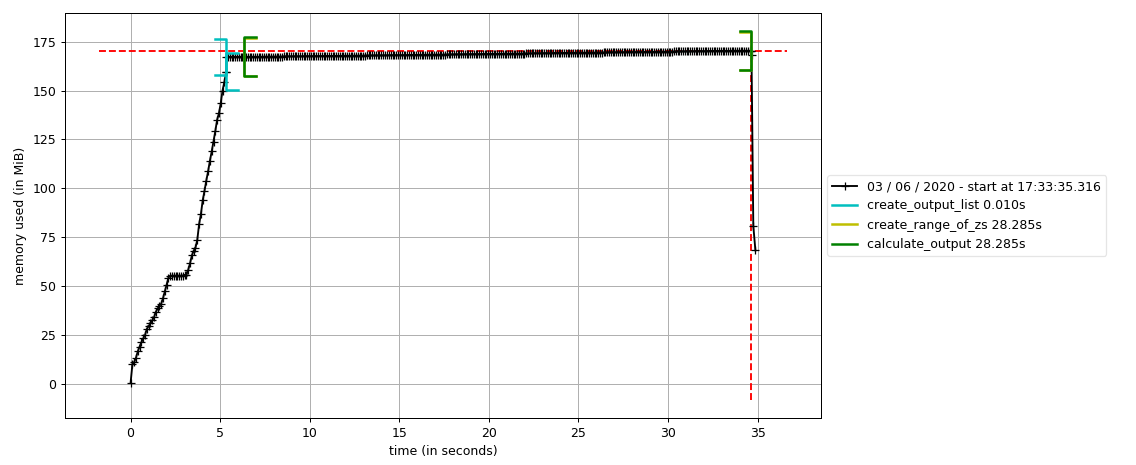
這個圖看起來好像還不是很直觀,並不能看出內存增長是在哪裡,修改下函數,這裡還要把 from memory_profiler import profile 注釋掉
def calculate_z_serial_purepython(maxiter, zs, cs):
    with profile.timestamp("create_output_list"):
        output = [0] * len(zs)
    time.sleep(1)
    with profile.timestamp("create_range_of_zs"):
        iterations = range(len(zs))
        with profile.timestamp('calculate_output'):
            for i in iterations:
                n = 0
                z = zs[i]
                c = cs[i]
                while n < maxiter and abs(z) < 2:
                    z = z * z + c
                    n += 1
                output[i] = n
    return output
然後命令行
mprof run code_memory.py
畫圖
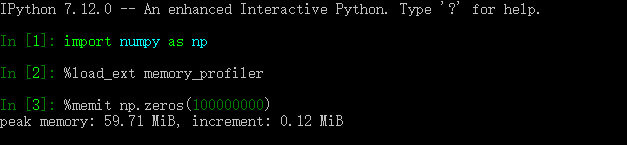
memit
類似於運行時間測量的 timeit,內存測量中也有 memit,可在 ipython 或 jupyter notebook 中使用
heapy 調查堆上對象
當需要知道某一時刻有多少對象被使用,以及他們是否被垃圾收集時,通過對堆的查看,可以很好的得到結果。
安裝
pip install guppy3
代碼修改如下
import time
import numpy as np
# import imageio
# import PIL
# import matplotlib.pyplot as plt
from guppy import hpy
# import cv2 as cv

from functools import wraps

x1, x2, y1, y2 = -1.8, 1.8, -1.8, 1.8
c_real, c_imag = -0.62772, -0.42193


def timefn(fn):
    @wraps(fn)
    def measure_time(*args, **kwargs):
        t1 = time.time()
        result = fn(*args, **kwargs)
        t2 = time.time()
        print("@timefn:" + fn.__name__ + " took " + str(t2 - t1), " seconds")
        return result
    return measure_time

def calculate_z_serial_purepython(maxiter, zs, cs):
    output = [0] * len(zs)
    for i in range(len(zs)):
        n = 0
        z = zs[i]
        c = cs[i]
        while n < maxiter and abs(z) < 2:
            z = z * z + c
            n += 1
        output[i] = n
    return output

def calc_pure_python(desired_width, max_itertions):
    x_step = (float(x2 - x1)) / float(desired_width)
    y_step = (float(y2 - y1)) / float(desired_width)
    x, y = [], []

    ycoord = y1
    while ycoord < y2:
        y.append(ycoord)
        ycoord += y_step

    xcoord = x1
    while xcoord < x2:
        x.append(xcoord)
        xcoord += x_step

    print("heapy after creating y and x lists of floats")
    hp = hpy()
    h = hp.heap()
    print(h)
    print("")

    zs, cs = [], []
    for ycoord in y:
        for xcoord in x:
            zs.append(complex(xcoord, ycoord))
            cs.append(complex(c_real, c_imag))

    print("heapy after creating zs and cs using complex numbers")
    h = hp.heap()
    print(h)
    print("")

    print(f"Length of x: {len(x)}")
    print(f"Total elements: {len(zs)}")
    start_time = time.time()
    output = calculate_z_serial_purepython(max_itertions, zs, cs)
    end_time = time.time()
    secs = end_time - start_time
    print("calculate_z_serial_purepython took", secs, "seconds")

    print("")
    print("heapy after calling calculate_z_serial_purepython")
    h = hp.heap()
    print(h)

    assert sum(output) == 33219980


if __name__ == "__main__":
    calc_pure_python(desired_width=1000, max_itertions=300)
在使用的時候發現不能 import imageio 這個庫,不然調用 hp.heap() 的時候會直接退出。。。。
輸出
heapy after creating y and x lists of floats
Partition of a set of 96564 objects. Total size = 12355685 bytes.
 Index  Count   %     Size   % Cumulative  % Kind (class / dict of class)
     0  27588  29  4021242  33   4021242  33 str
     1  25226  26  1920104  16   5941346  48 tuple
     2  12595  13   962362   8   6903708  56 bytes
     3   6336   7   912831   7   7816539  63 types.CodeType
     4   5855   6   796280   6   8612819  70 function
     5    922   1   789656   6   9402475  76 type
     6    255   0   499248   4   9901723  80 dict of module
     7    922   1   496880   4  10398603  84 dict of type
     8    514   1   284608   2  10683211  86 set
     9    529   1   276160   2  10959371  89 dict (no owner)
<248 more rows. Type e.g. '_.more' to view.>

heapy after creating zs and cs using complex numbers
Partition of a set of 2096566 objects. Total size = 93750677 bytes.
 Index  Count   %     Size   % Cumulative  % Kind (class / dict of class)
     0 2000003  95 64000096  68  64000096  68 complex
     1    536   0 17495680  19  81495776  87 list
     2  27588   1  4021242   4  85517018  91 str
     3  25226   1  1920104   2  87437122  93 tuple
     4  12595   1   962362   1  88399484  94 bytes
     5   6336   0   912831   1  89312315  95 types.CodeType
     6   5855   0   796280   1  90108595  96 function
     7    922   0   789656   1  90898251  97 type
     8    255   0   499248   1  91397499  97 dict of module
     9    922   0   496880   1  91894379  98 dict of type
<248 more rows. Type e.g. '_.more' to view.>

Length of x: 1000
Total elements: 1000000
calculate_z_serial_purepython took 24.96058201789856 seconds

heapy after calling calculate_z_serial_purepython
Partition of a set of 2196935 objects. Total size = 104561033 bytes.
 Index  Count   %     Size   % Cumulative  % Kind (class / dict of class)
     0 2000003  91 64000096  61  64000096  61 complex
     1    537   0 25495744  24  89495840  86 list
     2  27588   1  4021242   4  93517082  89 str
     3 102343   5  2870796   3  96387878  92 int
     4  25226   1  1920104   2  98307982  94 tuple
     5  12595   1   962362   1  99270344  95 bytes
     6   6336   0   912831   1 100183175  96 types.CodeType
     7   5855   0   796280   1 100979455  97 function
     8    922   0   789656   1 101769111  97 type
     9    255   0   499248   0 102268359  98 dict of module
<248 more rows. Type e.g. '_.more' to view.>
可以發現:
- 在創建了 zs 和 cs 列表後,內存增長了大約 80M, 2000003 個複數對象消耗了 64000096 位元組內存,佔用了當前大部分的內存。
- 第 3 段中,計算完集合後佔用了 104M 的內存,除了之前的複數,現在還保存了大量的整數,列表中的項目也增多了。
hpy.setrelheap() 可以用來創建一個斷點,當後續調用 hpy.heap() 時,會產生一個跟這個斷點的差額,這樣可以略過斷點前產生的內存分配。
小節
這篇文章介紹了一些對於代碼運行時內存的分析方法,相信通過合理運用這些方法對代碼進行分析修改,能寫出性能更優的代碼。
這是彩蛋
之前在做數據挖掘競賽的時候,有一個經常使用的分批處理的模板(針對 .csv 數據),就在這裡分享給大家
import pandas as pd
import tqdm

data = pd.read_csv(path, iterator=True)
chunk_size = 500000 # 每一批讀入數據大小
data_size = 300000 # 採樣時用
tmp_df = data.get_chunk(chunk_size).head(data_size)
# 每次讀取 chunk_size 大小的數據,迭代 n 次
with tqdm.tqdm(range(n), 'Training..') as t:
	for _ in t:
		try:
			# your code here
		except StopIteration:
			break