(数据科学学习手札133)利用geopandas绘制拓扑着色地图
- 2021 年 12 月 27 日
- 筆記
本文示例代码及文件已上传至我的Github仓库//github.com/CNFeffery/DataScienceStu …
Continue Reading
本文示例代码及文件已上传至我的Github仓库//github.com/CNFeffery/DataScienceStu …
Continue Reading
本文示例代码及文件已上传至我的Github仓库//github.com/CNFeffery/DataScienceStu …
Continue Reading本文示例代码及文件已上传至我的Github仓库//github.com/CNFeffery/DataScienceStu …
Continue Reading
本文完整代码及数据已上传至我的Github仓库//github.com/CNFeffery/FefferyViz 1 简 …
Continue Reading
本文完整代码及数据已上传至我的Github仓库//github.com/CNFeffery/FefferyViz 1 简 …
Continue Reading
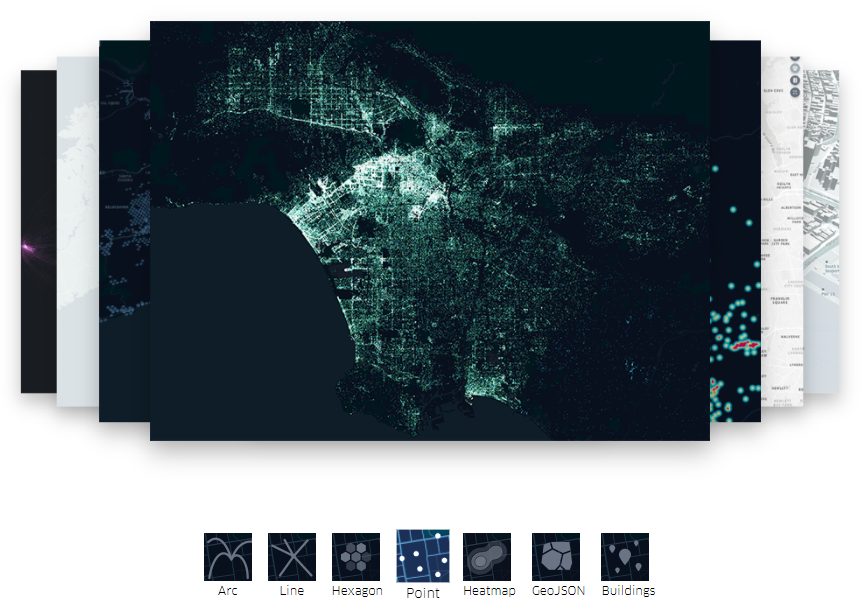
1 简介 kepler.gl作为开源地理空间数据可视化神器,也一直处于活跃的迭代开发状态下。而在前不久,kepler …
Continue Reading
本文完整代码及数据已上传至我的Github仓库//github.com/CNFeffery/FefferyViz 1 简 …
Continue Reading
本文完整代码已上传至我的Github仓库//github.com/CNFeffery/FefferyViz 1 简介 …
Continue Reading
本文示例文件已上传至我的Github仓库//github.com/CNFeffery/DataScienceStudyN …
Continue Reading
本文示例代码及数据已上传至我的Github仓库//github.com/CNFeffery/DataScienceStu …
Continue Reading