没想到吧!这个可可爱爱的游戏居然是用 ECharts 实现的!
摘要:echarts 是一个很强大的图表库,除了我们常见的图表功能,还可以自定义图形,这个功能让我们可以很简单地在画布上绘制一些非常规的图形,基于此,我们来玩一些花哨的:做一个 Flappy Bird 小游戏。
本文分享自华为云社区《没想到吧!这个可可爱爱的游戏居然是用 ECharts 实现的!》,作者: DevUI 。
前言
echarts 是一个很强大的图表库,除了我们常见的图表功能,echarts 有一个自定义图形的功能,这个功能可以让我们很简单地在画布上绘制一些非常规的图形,基于此,我们来玩一些花哨的。
Flappy Bird 小游戏体验地址(看看你能玩几分)://foolmadao.github.io/echart-flappy-bird/echarts-bird.html
下面我们来一步步实现他。
1 在坐标系中画一只会动的小鸟
首先实例化一个 echart 容器,再从网上找一个像素小鸟的图片,将散点图的散点形状,用自定义图片的方式改为小鸟。
const myChart = echarts.init(document.getElementById('main'));
option = {
  series: [
    {
      name: 'bird',
      type: 'scatter',
      symbolSize: 50,
      symbol: 'image://bird.png',
      data: [
        [50, 80]
      ],
      animation: false
    },
  ]
};

myChart.setOption(option);
要让小鸟动起来,就需要给一个向右的速度和向下的加速度,并在每一帧的场景中刷新小鸟的位置。而小鸟向上飞的动作,则可以靠角度的旋转来实现,向上飞的触发条件设置为空格事件。
option = {
  series: [
    {
      xAxis: {
        show: false,
        type: 'value',
        min: 0,
        max: 200,
      },
      yAxis: {
        show: false,
        min: 0,
        max: 100
      },
      name: 'bird',
      type: 'scatter',
      symbolSize: 50,
      symbol: 'image://bird.png',
      data: [
        [50, 80]
      ],
      animation: false
    },
  ]
};

// 设置速度和加速度
let a = 0.05;
let vh = 0;
let vw = 0.5

timer = setInterval(() => {
  // 小鸟位置和仰角调整
  vh = vh - a;
  option.series[0].data[0][1] += vh;
  option.series[0].data[0][0] += vw;
  option.series[0].symbolRotate = option.series[0].symbolRotate ? option.series[0].symbolRotate - 5 : 0;

  // 坐标系范围调整
  option.xAxis.min += vw;
  option.xAxis.max += vw;

  myChart.setOption(option);
}, 25);
效果如下
2 用自定义图形绘制障碍物
echarts 自定义系列,渲染逻辑由开发者通过 renderItem 函数实现。该函数接收两个参数 params 和 api,params 包含了当前数据信息和坐标系的信息,api 是一些开发者可调用的方法集合,常用的方法有:
- api.value (…),意思是取出 dataItem 中的数值。例如 api.value (0) 表示取出当前 dataItem 中第一个维度的数值。
- api.coord (…),意思是进行坐标转换计算。例如 var point = api.coord ([api.value (0), api.value (1)]) 表示 dataItem 中的数值转换成坐标系上的点。
- api.size (…), 可以得到坐标系上一段数值范围对应的长度。
- api.style (…),可以获取到 series.itemStyle 中定义的样式信息。
灵活使用上述 api,就可以将用户传入的 Data 数据转换为自己想要的坐标系上的像素位置。
renderItem 函数返回一个 echarts 中的 graphic 类,可以多种图形组合成你需要的形状,graphic 类型。对于我们游戏中的障碍物只需要使用矩形即可绘制出来,我们使用到下面两个类。
- type: group, 组合类,可以将多个图形类组合成一个图形,子类放在 children 中。
- type: rect, 矩形类,通过定义矩形左上角坐标点,和矩形宽高确定图形。
// 数据项定义为[x坐标,下方水管上侧y坐标, 上方水管下侧y坐标]
data: [
  [150, 50, 80],
  ...
]

renderItem: function (params, api) {
    // 获取每个水管主体矩形的起始坐标点
    let start1 = api.coord([api.value(0) - 10, api.value(1)]);
    let start2 = api.coord([api.value(0) - 10, 100]);
    // 获取两个水管头矩形的起始坐标点
    let startHead1 = api.coord([api.value(0) - 12, api.value(1)]);
    let startHead2 = api.coord([api.value(0) - 12, api.value(2) + 8])
    // 水管头矩形的宽高
    let headSize = api.size([24, 8])
    // 水管头矩形的宽高
    let rect = api.size([20, api.value(1)]);
    let rect2 = api.size([20, 100 - api.value(2)]);
    // 坐标系配置
    const common = {
        x: params.coordSys.x,
        y: params.coordSys.y,
        width: params.coordSys.width,
        height: params.coordSys.height
    }
    // 水管形状
    const rectShape = echarts.graphic.clipRectByRect(
      {
        x: start1[0],
        y: start1[1],
        width: rect[0],
        height: rect[1]
      },common
    );
    const rectShape2 = echarts.graphic.clipRectByRect(
      {
        x: start2[0],
        y: start2[1],
        width: rect2[0],
        height: rect2[1]
      },
      common
    )

    // 水管头形状
    const rectHeadShape = echarts.graphic.clipRectByRect(
      {
        x: startHead1[0],
        y: startHead1[1],
        width: headSize[0],
        height: headSize[1]
      },common
    );

    const rectHeadShape2 = echarts.graphic.clipRectByRect(
      {
        x: startHead2[0],
        y: startHead2[1],
        width: headSize[0],
        height: headSize[1]
      },common
    );

    // 返回一个group类,由四个矩形组成
    return {
        type: 'group',
        children: [{
            type: 'rect',
            shape: rectShape,
            style: {
              ...api.style(),
              lineWidth: 1,
              stroke: '#000'
            }
        }, {
            type: 'rect',
            shape: rectShape2,
            style: {
              ...api.style(),
              lineWidth: 1,
              stroke: '#000'
            }
        },
        {
            type: 'rect',
            shape: rectHeadShape,
            style: {
              ...api.style(),
              lineWidth: 1,
              stroke: '#000'
            }
        },
        {
            type: 'rect',
            shape: rectHeadShape2,
            style: {
              ...api.style(),
              lineWidth: 1,
              stroke: '#000'
            }
        }]
    };
  },
颜色定义,我们为了让水管具有光泽使用了 echarts 的线性渐变色对象。
itemStyle: {
  // 渐变色对象
  color: {
    type: 'linear',
    x: 0,
    y: 0,
    x2: 1,
    y2: 0,
    colorStops: [{
        offset: 0, color: '#ddf38c' // 0% 处的颜色
    }, {
        offset: 1, color: '#587d2a' // 100% 处的颜色
    }],
    global: false // 缺省为 false
  },
  borderWidth: 3
},
另外,用一个 for 循环一次性随机出多个柱子的数据
function initObstacleData() {
    // 添加minHeight防止空隙太小
    let minHeight = 20;
    let start = 150;
    obstacleData = [];
    for (let index = 0; index < 50; index++) {
      const height = Math.random() * 30 + minHeight;
      const obstacleStart = Math.random() * (90 - minHeight);
      obstacleData.push(
        [
          start + 50 * index,
          obstacleStart,
          obstacleStart + height > 100 ? 100 : obstacleStart + height
        ]
      )
    }
  }
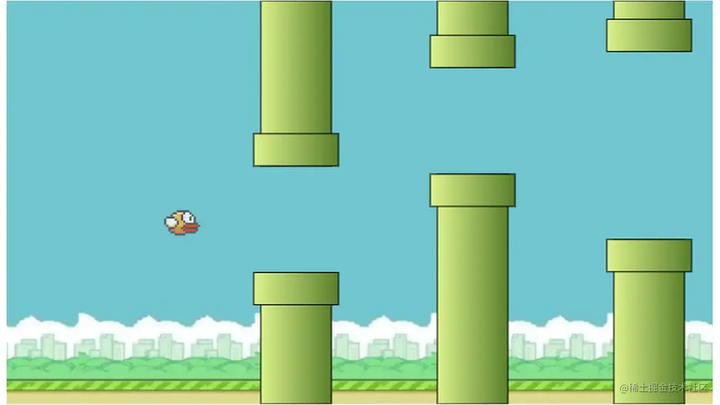
再将背景用游戏图片填充,我们就将整个游戏场景,绘制完成:
3 进行碰撞检测
由于飞行轨迹和障碍物数据都很简单,所以我们可以将碰撞逻辑简化为小鸟图片的正方形中,我们判断右上和右下角是否进入了自定义图形的范围内。
对于特定坐标下的碰撞范围,因为柱子固定每格 50 坐标值一个,宽度也是固定的,所以,可碰撞的横坐标范围就可以简化为 (x / 50 % 1) < 0.6
在特定范围内,依据 Math.floor (x / 50) 获取到对应的数据,即可判断出两个边角坐标是否和柱子区域有重叠了。在动画帧中判断,如果重叠了,就停止动画播放,游戏结束。
// centerCoord为散点坐标点
function judgeCollision(centerCoord) {
  if (centerCoord[1] < 0 || centerCoord[1] > 100) {
    return false;
  }
  let coordList = [
    [centerCoord[0] + 15, centerCoord[1] + 1],
    [centerCoord[0] + 15, centerCoord[1] - 1],
  ]

  for (let i = 0; i < 2; i++) {
    const coord = coordList[i];
    const index = coord[0] / 50;
    if (index % 1 < 0.6 && obstacleData[Math.floor(index) - 3]) {
      if (obstacleData[Math.floor(index) - 3][1] > coord[1] || obstacleData[Math.floor(index) - 3][2] < coord[1]) {
        return false;
      }
    }
  }
  return false
}

function initAnimation() {
  // 动画设置
  timer = setInterval(() => {
    // 小鸟速度和仰角调整
    vh = vh - a;
    option.series[0].data[0][1] += vh;
    option.series[0].data[0][0] += vw;
    option.series[0].symbolRotate = option.series[0].symbolRotate ? option.series[0].symbolRotate - 5 : 0;

    // 坐标系范围调整
    option.xAxis.min += vw;
    option.xAxis.max += vw;

    // 碰撞判断
    const result = judgeCollision(option.series[0].data[0])

    if(result) { // 产生碰撞后结束动画
      endAnimation();
    }

    myChart.setOption(option);
  }, 25);
}
总结
echarts 提供了强大的图形绘制自定义能力,要使用好这种能力,一定要理解好数据坐标点和像素坐标点之间的转换逻辑,这是将数据具象到画布上的重要一步。
运用好这个功能,再也不怕产品提出奇奇怪怪的图表需求。
源码地址://github.com/foolmadao/echart-flappy-bird


